Thermal signature of an Antares rocket launch
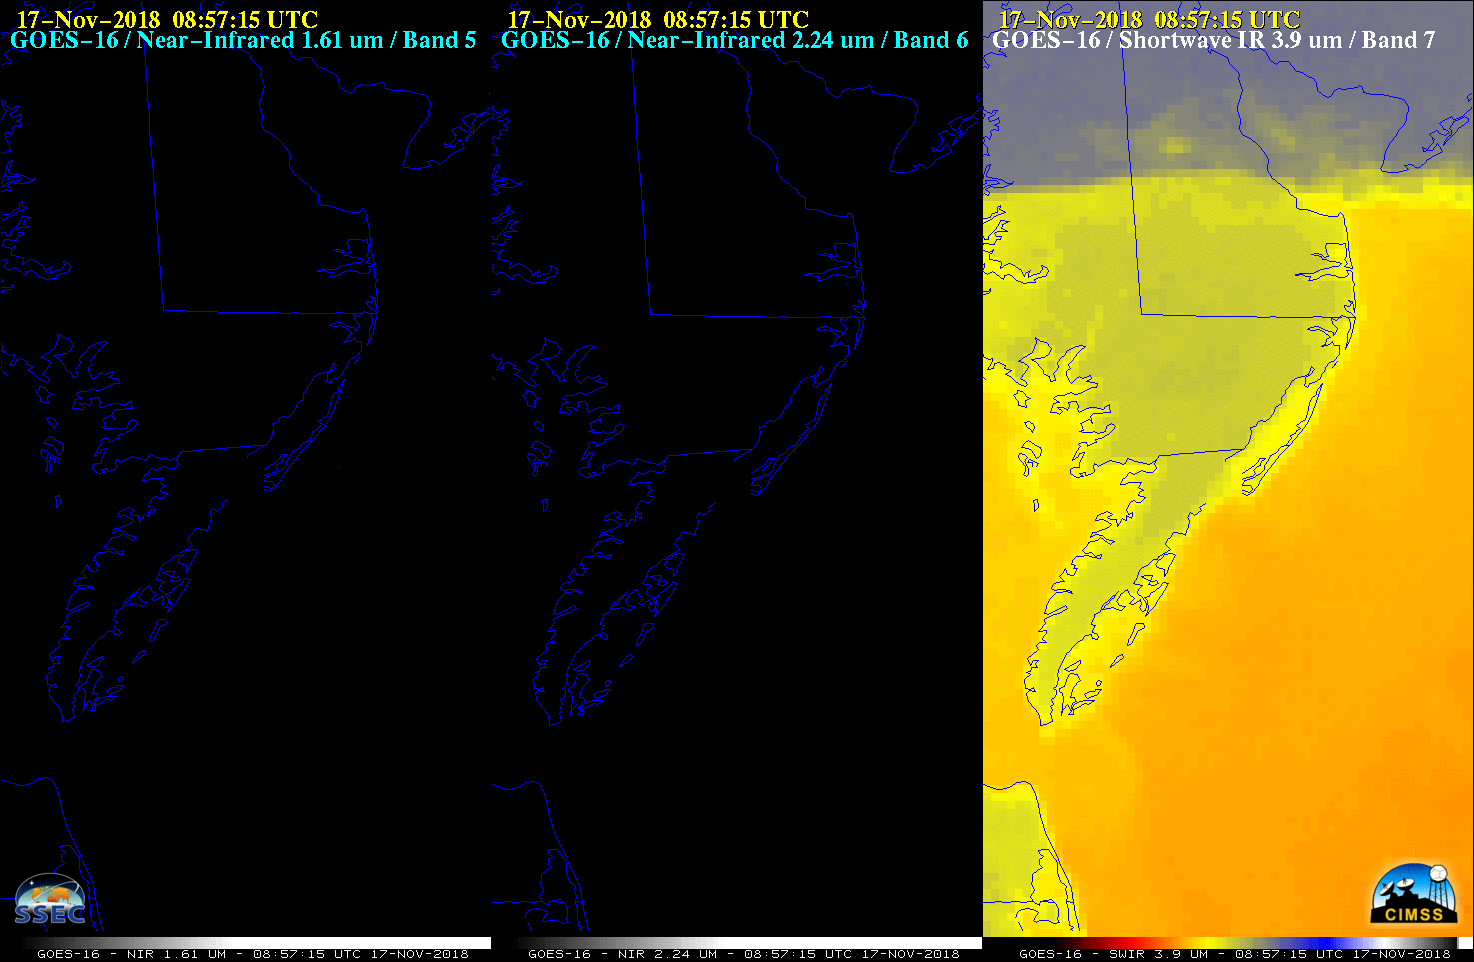
GOES-16 Near-Infrared “Snow/Ice” (1.61 µm, left), Near-Infrared “Cloud Particle Size” (2.24 µm, center) and Shortwave Infrared (3.9 µm, right) images [click to play animation | MP4]
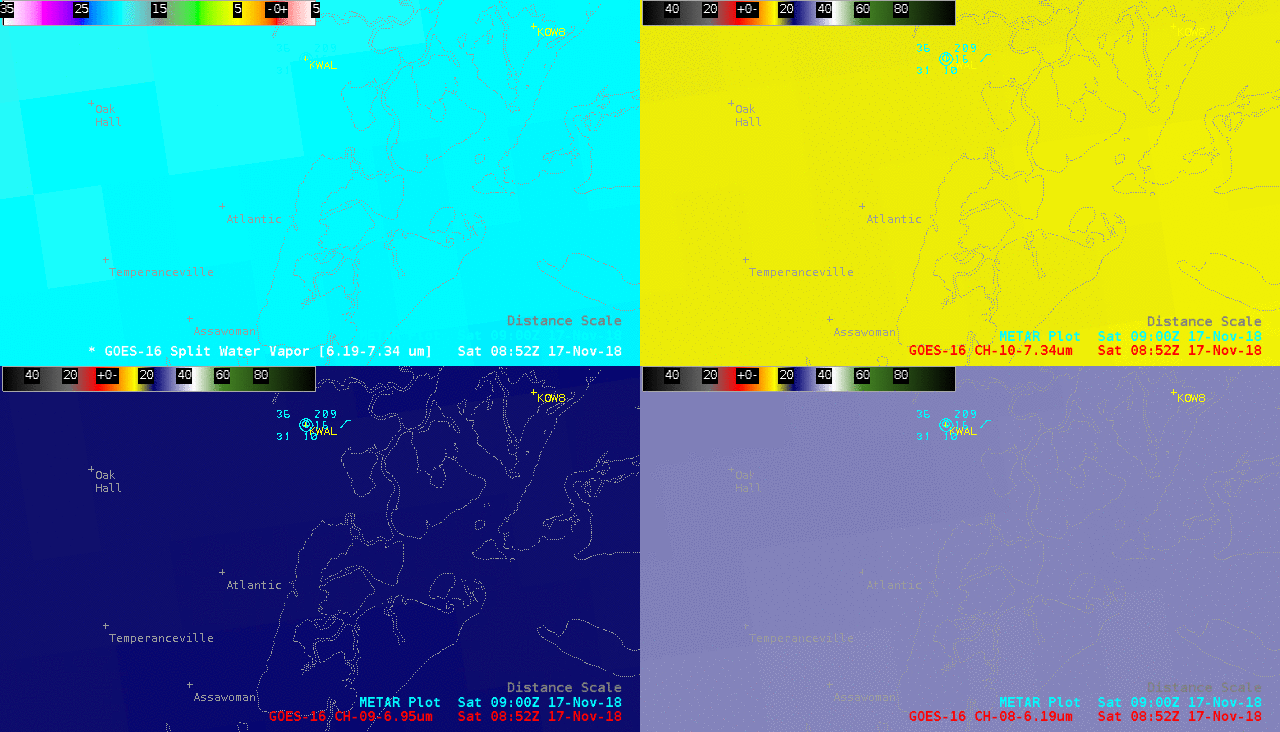
A corresponding thermal signature was also evident on 0902 UTC GOES-16 Low-level (7.3 µm). Mid-level (6.9 µm) and Upper-level (6.2 µm) Water Vapor images (below) — since the Water Vapor spectral bands are essentially Infrared bands, the signal was due to superheated air from the powerful First Stage rocket (which burned for 3.5 minutes after launch).
![GOES-16 Low-level (7.3 µm, left). Mid-level (6.9 µm, center) and Upper-level (6.2 µm, right) Water Vapor images [click to play animation | MP4]](https://cimss.ssec.wisc.edu/satellite-blog/wp-content/uploads/sites/5/2018/11/181117_goes16_waterVapor_Antares_launch_Wallops_anim.gif)
GOES-16 Low-level (7.3 µm, left), Mid-level (6.9 µm, center) and Upper-level (6.2 µm, right) Water Vapor images [click to play animation | MP4]
![GOES-16 Near-Infrared "Snow/Ice" (1.61 µm, left). Near-Infrared "Cloud Particle Size" (2.24 µm, center), Shortwave Infrared (3.9 µm, right) and "Clean" Infrared Window (10.3 µm) images [click to play animation | MP4]](https://cimss.ssec.wisc.edu/satellite-blog/wp-content/uploads/sites/5/2018/11/181117_goes16_nearInfrared_shortwaveInfrared_waterVapor_Antares_launch_Wallops_anim.gif)
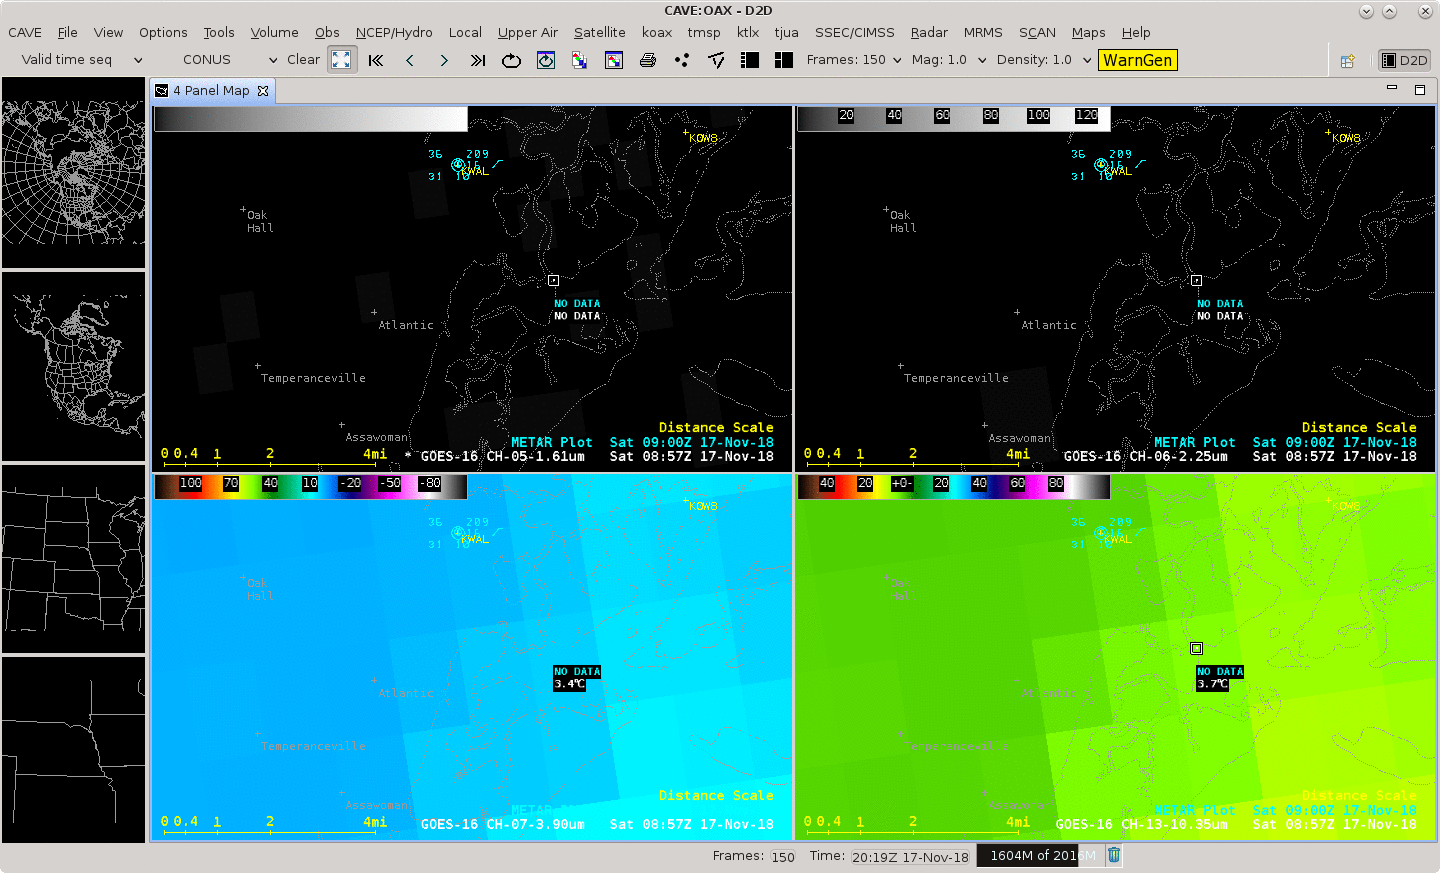
GOES-16 Near-Infrared “Snow/Ice” (1.61 µm, top left),. Near-Infrared “Cloud Particle Size” (2.24 µm, top right), Shortwave Infrared (3.9 µm, bottom left) and “Clean” Infrared Window (10.3 µm, bottom right) images [click to play animation | MP4]
![GOES-16 Near-Infrared "Snow/Ice" (1.61 µm, top left). Low-level Water Vapor (7.3 µm, top right), Mid-level Water Vapor (6.9 µm, bottom left) and Upper-level Water Vapor (6.2 µm, bottom right) images [click to play animation | MP4]](https://cimss.ssec.wisc.edu/satellite-blog/wp-content/uploads/sites/5/2018/11/181117_goes16_nearInfrared_waterVapor_Antares_launch_Wallops_anim.gif)
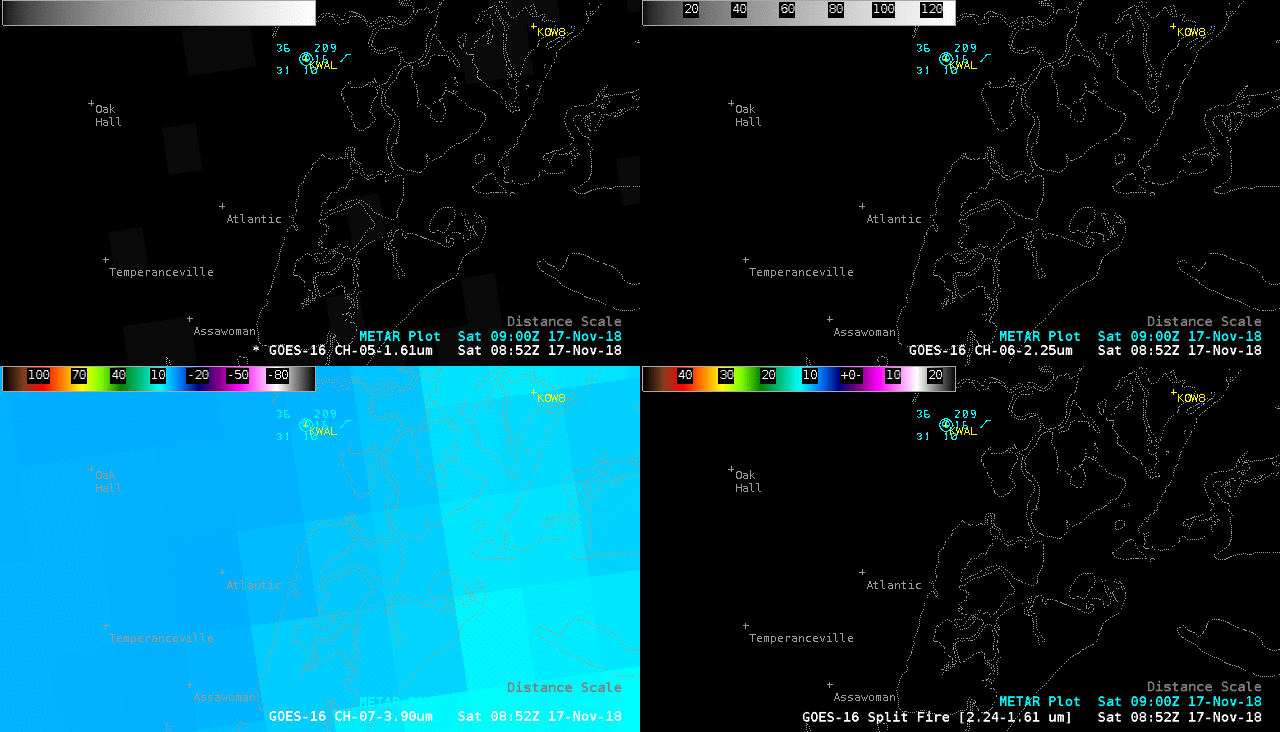
GOES-16 Near-Infrared “Snow/Ice” (1.61 µm, top left), Low-level Water Vapor (7.3 µm, top right), Mid-level Water Vapor (6.9 µm, bottom left) and Upper-level Water Vapor (6.2 µm, bottom right) images [click to play animation | MP4]