On 01 May, GOES-17 (GOES-West) Shortwave Infrared (3.9 µm) and “Red” Visible (0.64 µm) images (above) showed the thermal anomaly (or fire “hot spot”) and dispersion of smoke from the first moderate-size wildfire of 2019 in the Interior of Alaska — the Oregon Lakes Impact Area Fire about 7 miles southwest of Fort Greely.... Read More
![GOES-17 Shortwave Infrared (3.9 µm) and "Red" Visible (0.64 µm) images [click to play animation | MP4]](https://cimss.ssec.wisc.edu/satellite-blog/wp-content/uploads/sites/5/2019/05/ak_swir-20190501_122034.png)
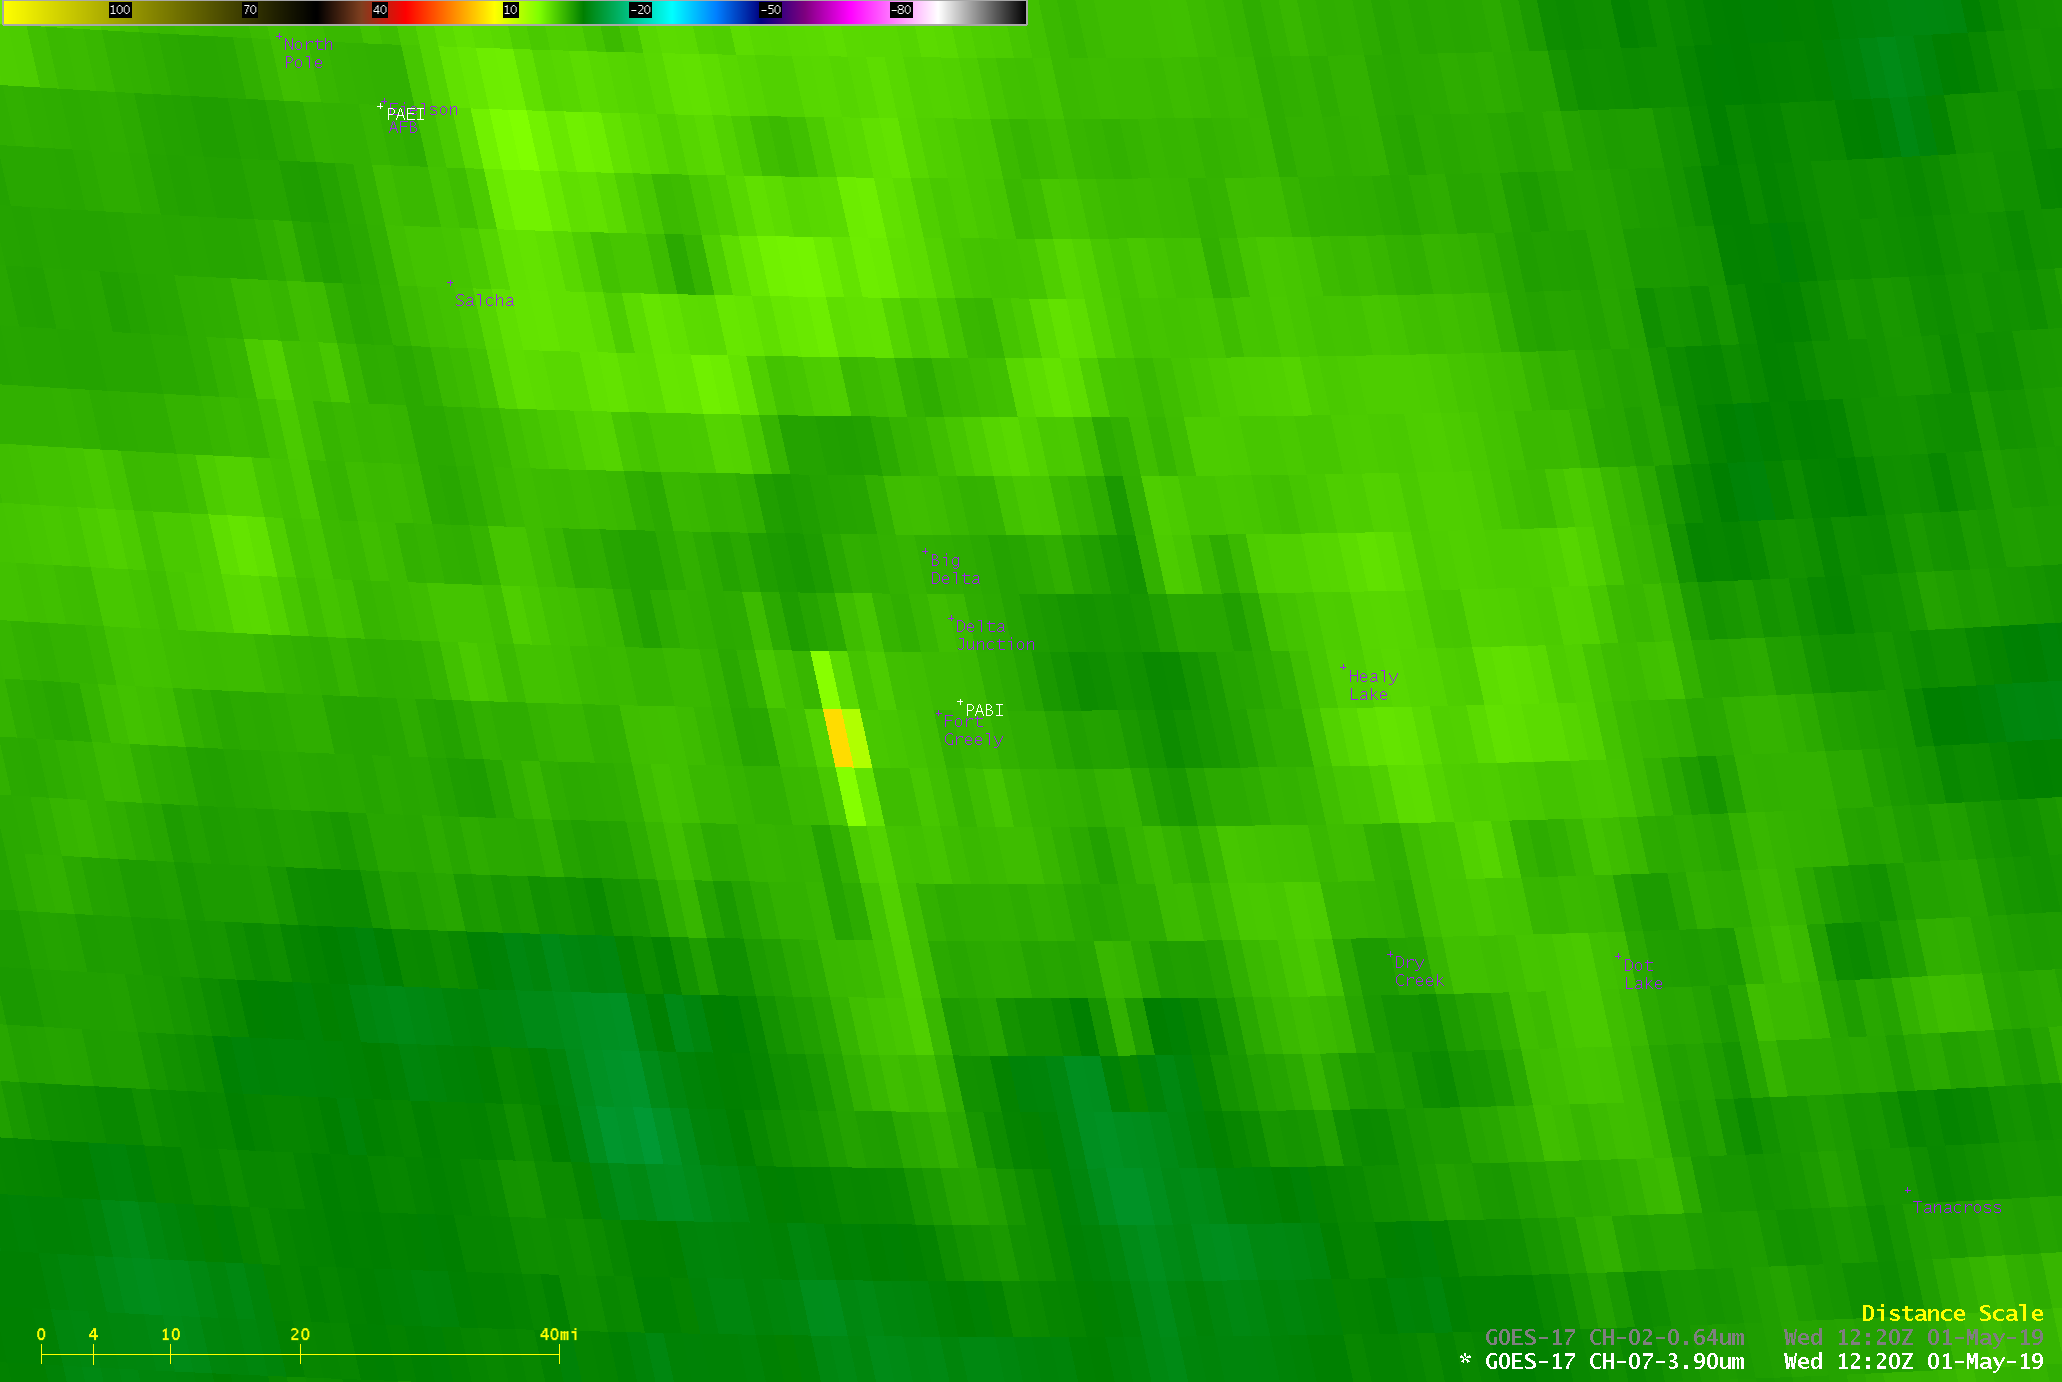
GOES-17 Shortwave Infrared (3.9 µm) and “Red” Visible (0.64 µm) images [click to play animation | MP4]
On 01 May, GOES-17
(GOES-West) Shortwave Infrared (3.9 µm) and “Red” Visible (0.64 µm) images
(above) showed the thermal anomaly (or fire “hot spot”) and dispersion of smoke from the first moderate-size wildfire of 2019 in the Interior of Alaska — the
Oregon Lakes Impact Area Fire about 7 miles southwest of Fort Greely. This fire grew from 30 acres to 4000 acres in a 24-hour period, aided by warm daytime temperatures with low relative humidity values and southwest winds late in the day on 30 April (
surface data). The Oregon Lakes Impact Area Fire was burning in a remote area just west of the Delta River which was previously burned by the 2013 Mississippi Fire; that area also contained unexploded ordnance dropped by military aircraft during training exercises.
A toggle between Suomi NPP VIIRS Day/Night Band (0.7 µm) and Shortwave Infrared (3.74 µm) images at 1216 UTC or 4:16 am local time (below) revealed the nighttime glow of the fire, along with a more accurate depiction of the size and location of the thermal anomaly.
![Suomi NPP VIIRS Day/Night Band (0.7 µm) and Shortwave Infrared (3.74 µm) images [click to enlarge]](https://cimss.ssec.wisc.edu/satellite-blog/wp-content/uploads/sites/5/2019/05/190501_suomiNPP_dayNightBand_shortwaveInfrared_Fort_Greely_AK_fire_anim.gif)
Suomi NPP VIIRS Day/Night Band (0.7 µm) and Shortwave Infrared (3.74 µm) images [click to enlarge]
Although the color enhancements were different, a comparison of Shortwave Infrared images from Suomi NPP (3.74 µm) at 1216 UTC and GOES-17 (3.9 µm) at 1220 UTC
(below) demonstrated the advantage of imagery from polar-orbiting satellites at high latitudes. In this example, the 375-meter resolution VIIRS image showed 2 distinct fire hot spots that were not apparent in the lower spatial resolution — 2 km at nadir, decreasing to about 4 km over Alaska — GOES-17 image.
![Shortwave Infrared images from Suomi NPP (3.74 µm) and GOES-17 (3.9 µm) [click to enlarge]](https://cimss.ssec.wisc.edu/satellite-blog/wp-content/uploads/sites/5/2019/05/190501_1216utc_viirs_1220utc_goes17_shortwaveInfrared_Fort_Greely_AK_fire_anim.gif)
Shortwave Infrared images from Suomi NPP (3.74 µm) and GOES-17 (3.9 µm) [click to enlarge]
A larger-scale view of GOES-17 Shortwave Infrared and Visible images from 02-04 UTC on 02 May
(below) showed the fire as it exhibited its peak 3.9 µm infrared brightness temperature (51.3ºC or 324.5 K at
0210 UTC) and the smoke plume had drifted over 100 miles to the southeast, moving over Beaver Creek, Yukon (CYXQ). While most of the smoke was apparently lofted above the boundary layer, the surface visibility at Fort Greely
PABI was briefly reduced to 6 miles at 09 UTC or 1am local time on 02 May. Note the lack of “false cold pixels” adjacent to the warmest 3.9 µm pixels — this is due to a recent change to the GOES-R ABI Band 7 resampler, as detailed in
this blog post.
![GOES-17 Shortwave Infrared (3.9 µm) and "Red" Visible (0.64 µm) images [click to play animation | MP4]](https://cimss.ssec.wisc.edu/satellite-blog/wp-content/uploads/sites/5/2019/05/ak_swir-20190502_021033.png)
GOES-17 Shortwave Infrared (3.9 µm) and “Red” Visible (0.64 µm) images [click to play animation | MP4]
A comparison of Visible and Shortwave Infrared images from GOES-17 and GOES-15
(below) highlighted the improved fire detection and monitoring capability of the new
GOES-R series. The higher spatial resolution (0.5 km vs 1.0 km at nadir for Visible, and 2 km vs 4 km at nadir for Shortwave Infrared) and more frequent image scans (10 minutes for GOES-17 Full Disk vs 15-30 minutes for GOES-15 CONUS sector) along with better Image Navigation and Registration (INR) were especially valuable at the higher latitudes of Alaska. For example, the subtle behavior of the fire’s smoke column vertical jump at 2350 UTC was only apparent in the GOES-17 Visible imagery.
![GOES-17 Visible (0.64 µm, top left), GOES-15 Visible (0.63 µm, top right), GOES-17 Shortwave Infrared (3.9 µm, bottom left) and GOES-15 Shortwave Infrared (3.9 µm, bottom right) images [click to play animation | MP4]](https://cimss.ssec.wisc.edu/satellite-blog/wp-content/uploads/sites/5/2019/05/G17_G15_VIS_SWIR_AK_FIRE_01MAY2019_2019121_235033_GOES-15_0004PANELS.GIF)
GOES-17 Visible (0.64 µm, top left), GOES-15 Visible (0.63 µm, top right), GOES-17 Shortwave Infrared (3.9 µm, bottom left) and GOES-15 Shortwave Infrared (3.9 µm, bottom right) images [click to play animation | MP4]
Since the fire was also located within the
GOES-17 Mesoscale Domain Sector #2, 1-minute imagery provided an even better depiction of the fire’s smoke column vertical jump and downstream smoke transport
(below).
![GOES-17 Visible (0.64 µm, top left), GOES-15 Visible (0.63 µm, top right), GOES-17 Shortwave Infrared (3.9 µm, bottom left) and GOES-15 Shortwave Infrared (3.9 µm, bottom right) images [click to play animation | MP4]](https://cimss.ssec.wisc.edu/satellite-blog/wp-content/uploads/sites/5/2019/05/G17_M2_G15_VIS_SWIR_AK_FIRE_01MAY2019_2019121_234951_GOES-15_0004PANELS.GIF)
GOES-17 Visible (0.64 µm, top left), GOES-15 Visible (0.63 µm, top right), GOES-17 Shortwave Infrared (3.9 µm, bottom left) and GOES-15 Shortwave Infrared (3.9 µm, bottom right) images [click to play animation | MP4]
View only this post
Read Less
![EUMETSAT-8 Meteosat-8 Infrared Window (10.8 µm) umages [click to play animation | MP4]](https://cimss.ssec.wisc.edu/satellite-blog/wp-content/uploads/sites/5/2019/05/190502_190503_meteosat8_infrared_Fani_anim.gif)
![Time series plot of surface observations from Bhabaneswar, India [click to enlarge]](https://cimss.ssec.wisc.edu/satellite-blog/wp-content/uploads/sites/5/2019/05/190503_VEBS_SFCMG.GIF)
![Sequence of NOAA-20 and Suomi NPP VIIRS Infrared Window (11.45 µm) images [click to enlarge]](https://cimss.ssec.wisc.edu/satellite-blog/wp-content/uploads/sites/5/2019/05/190501_190503_noaa20_suomiNPP_viirs_infrared_Cyclone_Fani_anim.gif)
![VIIRS True Color RGB and Infrared Window (11.45 µm) images from NOAA-20 and Suomi NPP [click to enlarge]](https://cimss.ssec.wisc.edu/satellite-blog/wp-content/uploads/sites/5/2019/05/190502_noaa20_suomiNPP_viirs_infrared_truecolor_Cyclone_Fani_anim.gif)
![DMSP-17 SSMIS Microwave (85 GHz) image at 1230 UTC + Meteosat-8 Infrared Window (10.8 µm) image at 1300 UTC [click to enlarge]](https://cimss.ssec.wisc.edu/satellite-blog/wp-content/uploads/sites/5/2019/05/190502_1230utc_dmsp17_microwave_1300utc_meteosat8_infrared_Cyclone_Fani_anim.gif)
![MIMIC TC morphed microwave product, 01-02 May [click to enlarge]](https://cimss.ssec.wisc.edu/satellite-blog/wp-content/uploads/sites/5/2019/05/190501_190502_mimicTC_Fani_anim.gif)
![Suomi NPP VIIRS Day/Night Band (0.7 µm) and Infrared Window (11.45 µm) images at 1939 UTC on 30 April [click to enlarge]](https://cimss.ssec.wisc.edu/satellite-blog/wp-content/uploads/sites/5/2019/05/190430_1939utc_suomiNPP_viirs_dayNightBand_inraredWindow_Fani_anim.gif)
![NOAA-20 VIIRS Day/Night Band (0.7 µm) and Infrared Window (11.45 µm) images at 2029 UTC on 30 April [click to enlarge]](https://cimss.ssec.wisc.edu/satellite-blog/wp-content/uploads/sites/5/2019/05/190430_2029utc_noaa20_viirs_dayNightBand_inraredWindow_Fani_anim.gif)

![GOES-15 Infrared cloud-tracked Derived Motion Winds [click to enlarge]](https://cimss.ssec.wisc.edu/satellite-blog/wp-content/uploads/sites/5/2019/05/190502_goes15_infrared_winds_Pacific_anim.gif)
![GOES-17 Shortwave Infrared (3.9 µm) and "Red" Visible (0.64 µm) images [click to play animation | MP4]](https://cimss.ssec.wisc.edu/satellite-blog/wp-content/uploads/sites/5/2019/05/190501_goes17_shortwaveInfrared_visible_Fort_Greely_AK_fire_anim.gif)
![GOES-17 Shortwave Infrared (3.9 µm) and "Red" Visible (0.64 µm) images [click to play animation | MP4]](https://cimss.ssec.wisc.edu/satellite-blog/wp-content/uploads/sites/5/2019/05/190502_goes17_shortwaveInfrared_visible_AK_fire_2_anim.gif)
![GOES-17 Visible (0.64 µm, top left), GOES-15 Visible (0.63 µm, top right), GOES-17 Shortwave Infrared (3.9 µm, bottom left) and GOES-15 Shortwave Infrared (3.9 µm, bottom right) images [click to play animation | MP4]](https://cimss.ssec.wisc.edu/satellite-blog/wp-content/uploads/sites/5/2019/05/190501_goes17_goes15_visible_shortwaveInfrared_AK_fire_anim.gif)
![GOES-17 Visible (0.64 µm, top left), GOES-15 Visible (0.63 µm, top right), GOES-17 Shortwave Infrared (3.9 µm, bottom left) and GOES-15 Shortwave Infrared (3.9 µm, bottom right) images [click to play animation | MP4]](https://cimss.ssec.wisc.edu/satellite-blog/wp-content/uploads/sites/5/2019/05/190501_goes17_mesoscale_goes15_conus_visible_shortwaveInfrared_AK_fire_anim.gif)

