Several snowfall records have already been broken for the Duluth area. The table in the image shows a list of these records. Stay tuned as the Monthly snowfall total and daily snowfall for today (5/9) are likely to change. #mnwx #mnclimate pic.twitter.com/nYbGyV6kZt — NWS Duluth (@NWSduluth) May 9, 2019 GOES-16 (GOES-East)... Read More
GOES-16 “Red” Visible (0.64 µm) images, with plots of surface weather type (yellow) and GLM Groups (red) [click to play animation | MP4]
GOES-16
(GOES-East) “Red” Visible (
0.64 µm) images
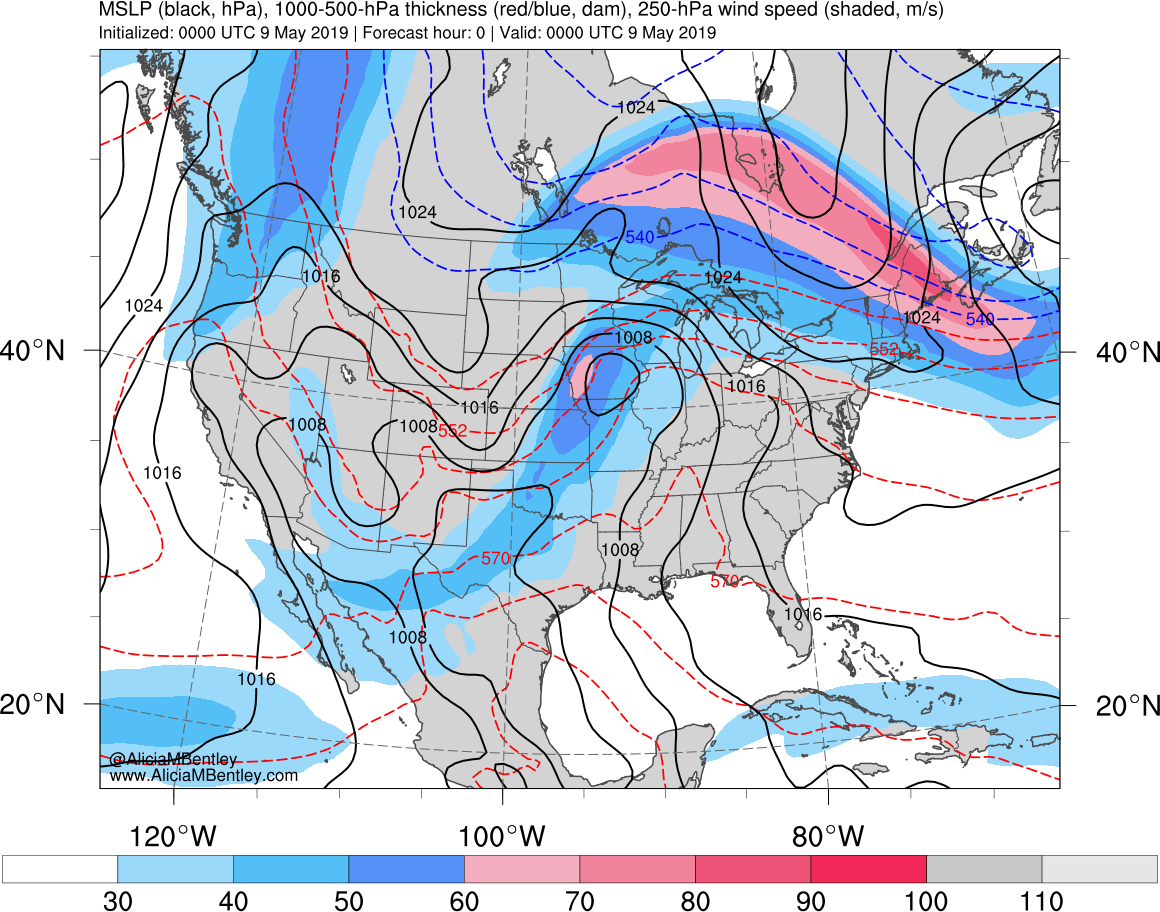
(above) showed the cloudiness associated with a midlatitude cyclone (
surface analyses) that moved across the Upper Midwest on
08 May –
09 May 2019. The system produced
accumulating snowfall from extreme eastern South Dakota to central/northeastern Minnesota, northwestern Wisconsin and Upper Michigan — storm total accumulations were as high as 10.6 inches at Duluth, Minnesota (
observations), 10.4 inches at Poplar, Wisconsin, 5.0 inches at Atlantic Mine, Michigan and 3.0 inches at Astoria, South Dakota (
NOHRSC maps of
snowfall/snowdepth). Note that the NW-SE oriented band of snowfall straddling the South Dakota/Minnesota border may have been enhanced by upslope flow as northeasterly surface winds encountered
rising terrain of the
Coteau des Prairies.
GOES-16 Mid-level Water Vapor (6.9 µm) images (below) showed the formation of a SW-NE oriented deformation zone across Minnesota — forcing for ascent was further aided by a stretched lobe of 500 hPa vorticity and 310 K potential vorticity that moved northeastward across the region during this period, along with a favorably-coupled 250 hPa jet streak configuration. Cloud features within the deformation zone across eastern South Dakota into southern/central Minnesota had an appearance resembling convective elements/bands in both the Visible and Water Vapor imagery.
GOES-16 Mid-level Water Vapor (6.9 µm) images, with plots of surface weather type (yellow) and GLM Groups (red) [click to play animation | MP4]
Although lightning was not widespread — and thunder was not explicitly reported in any first-order station observations — there were isolated small clusters of GOES-16
GLM Groups detected, first over northeastern, then central and finally over southwestern Minnesota between 2256 and 0036 UTC
(below), indicating the presence of
thundersnow.
GOES-16 “Red” Visible (0.64 µm) images, with plots of surface weather type (yellow) and GLM Groups (red) [click to enlarge]
GOES-16 Mid-level Water Vapor (6.9 µm) images, with plots of surface weather type (yellow) and GLM Groups (red) [click to enlarge]
Through occasional breaks in the clouds later in the day on 09 May, GOES-16
Day Cloud Phase Distinction Red-Green-Blue (RGB) images
(below) revealed the stationary signature of fresh snow cover
(darker green) across central to northeastern Minnesota and far northwestern Wisconsin (glaciating cloud tops also appear as shades of green).
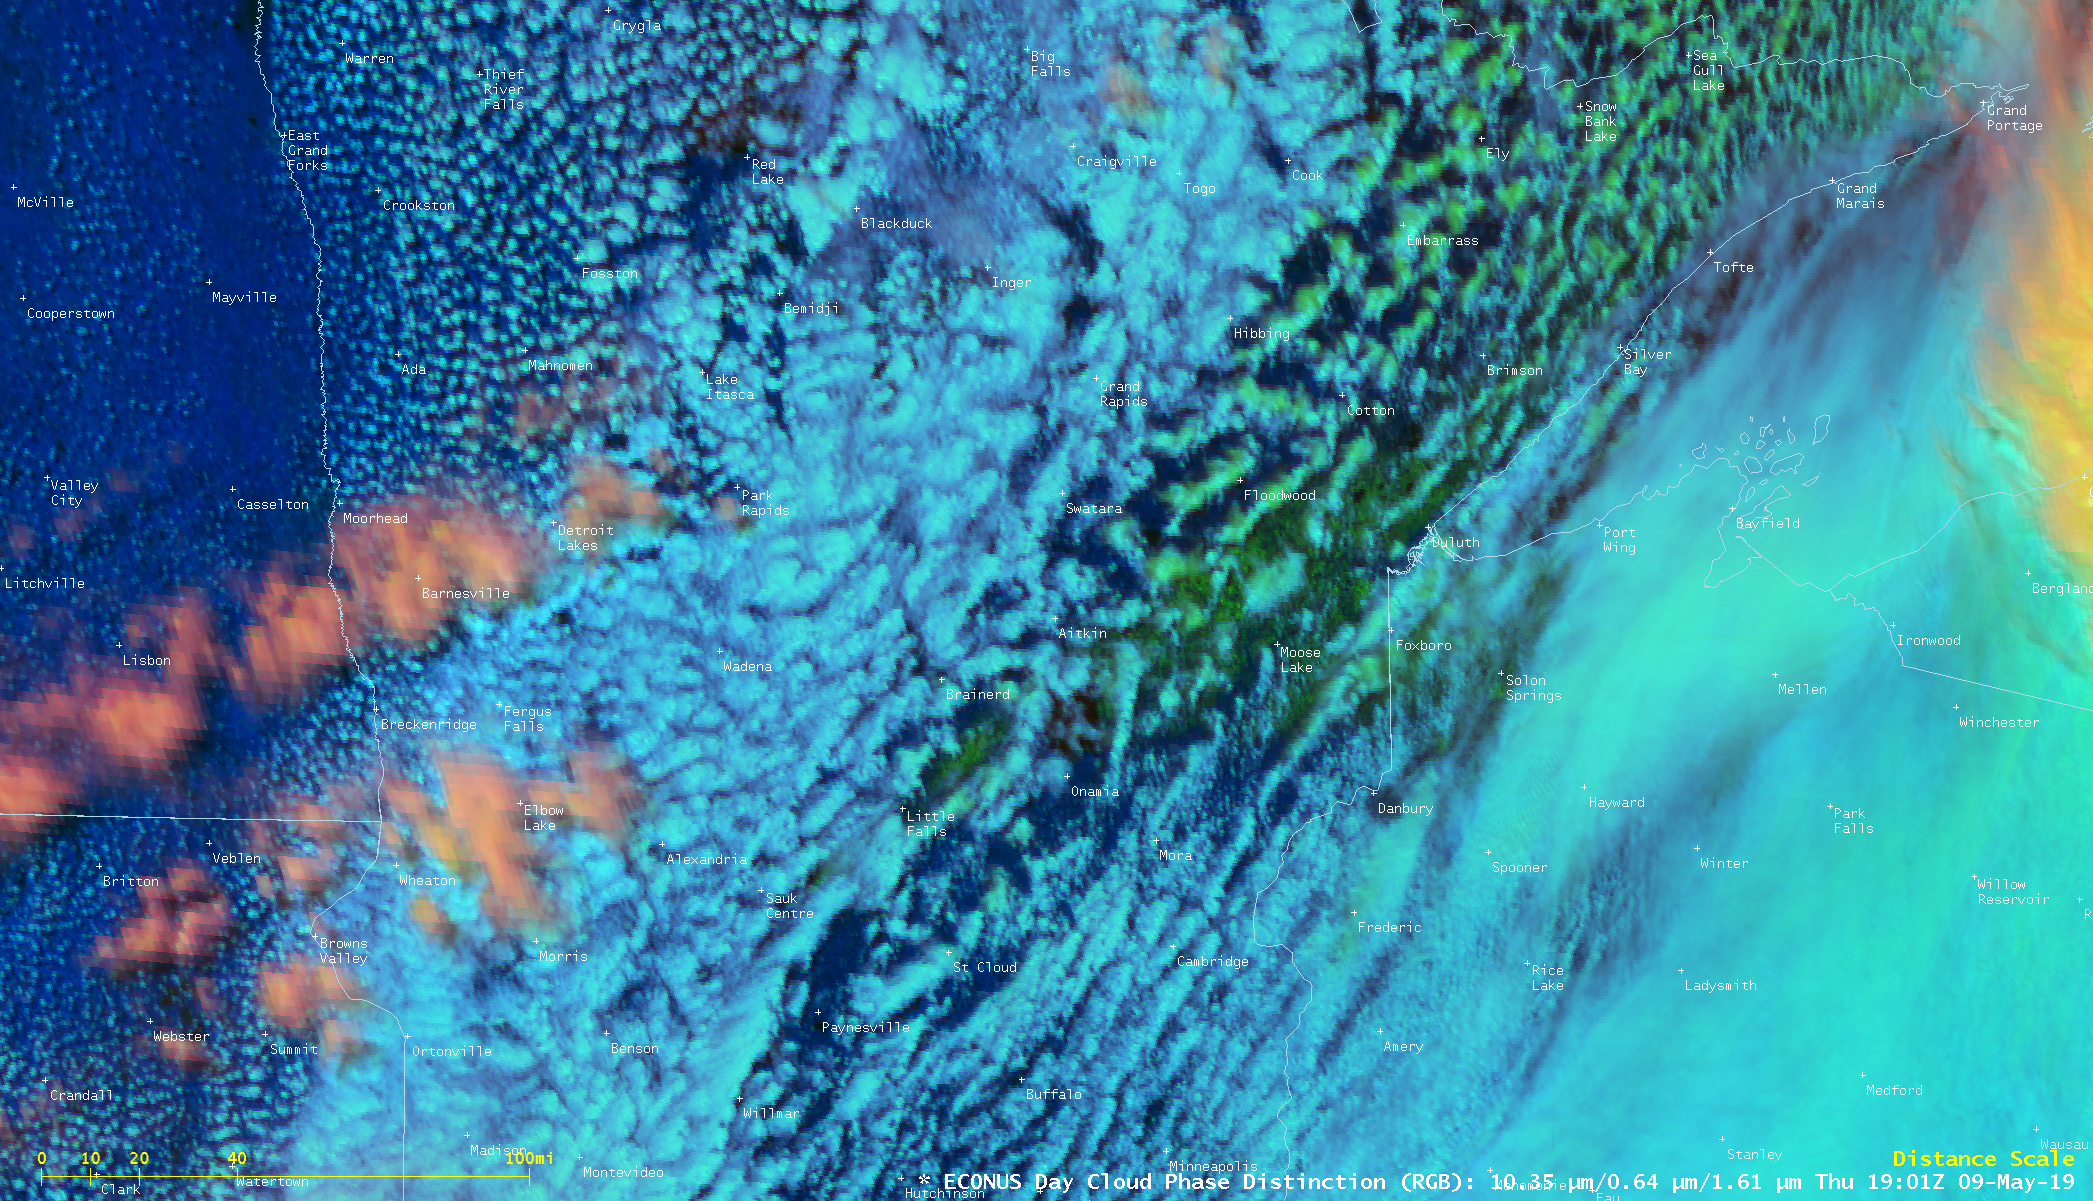
GOES-16 Day Cloud Phase Distinction RGB images [click to play animation | MP4]
===== 10 May Update =====

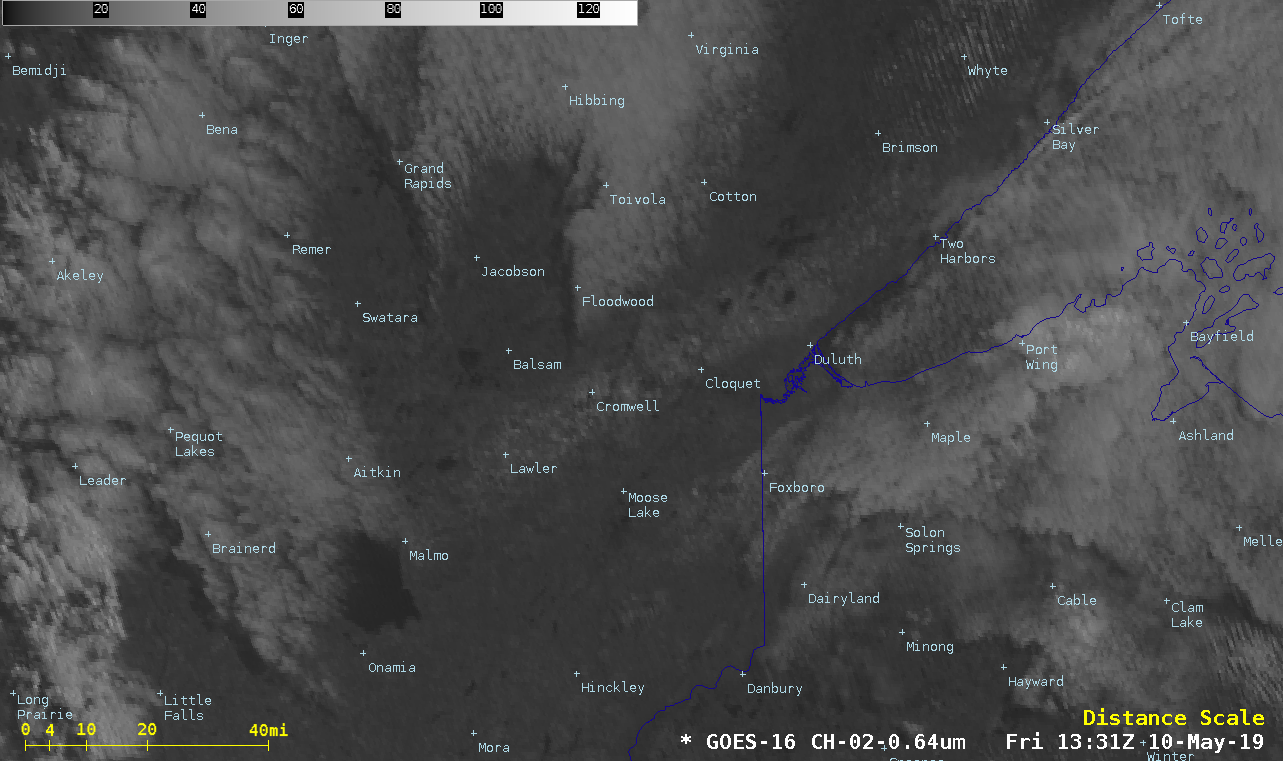
GOES-16 “Red” Visible (0.64 µm) images [click to play animation | MP4]
GOES-16 Visible images
(above) showed two swaths of snow cover remaining across northeastern Minnesota
(where reported snow depths were 1-2 inches) and northwestern Wisconsin
(where reported snow depths were 4-5 inches) on the morning of 10 May.
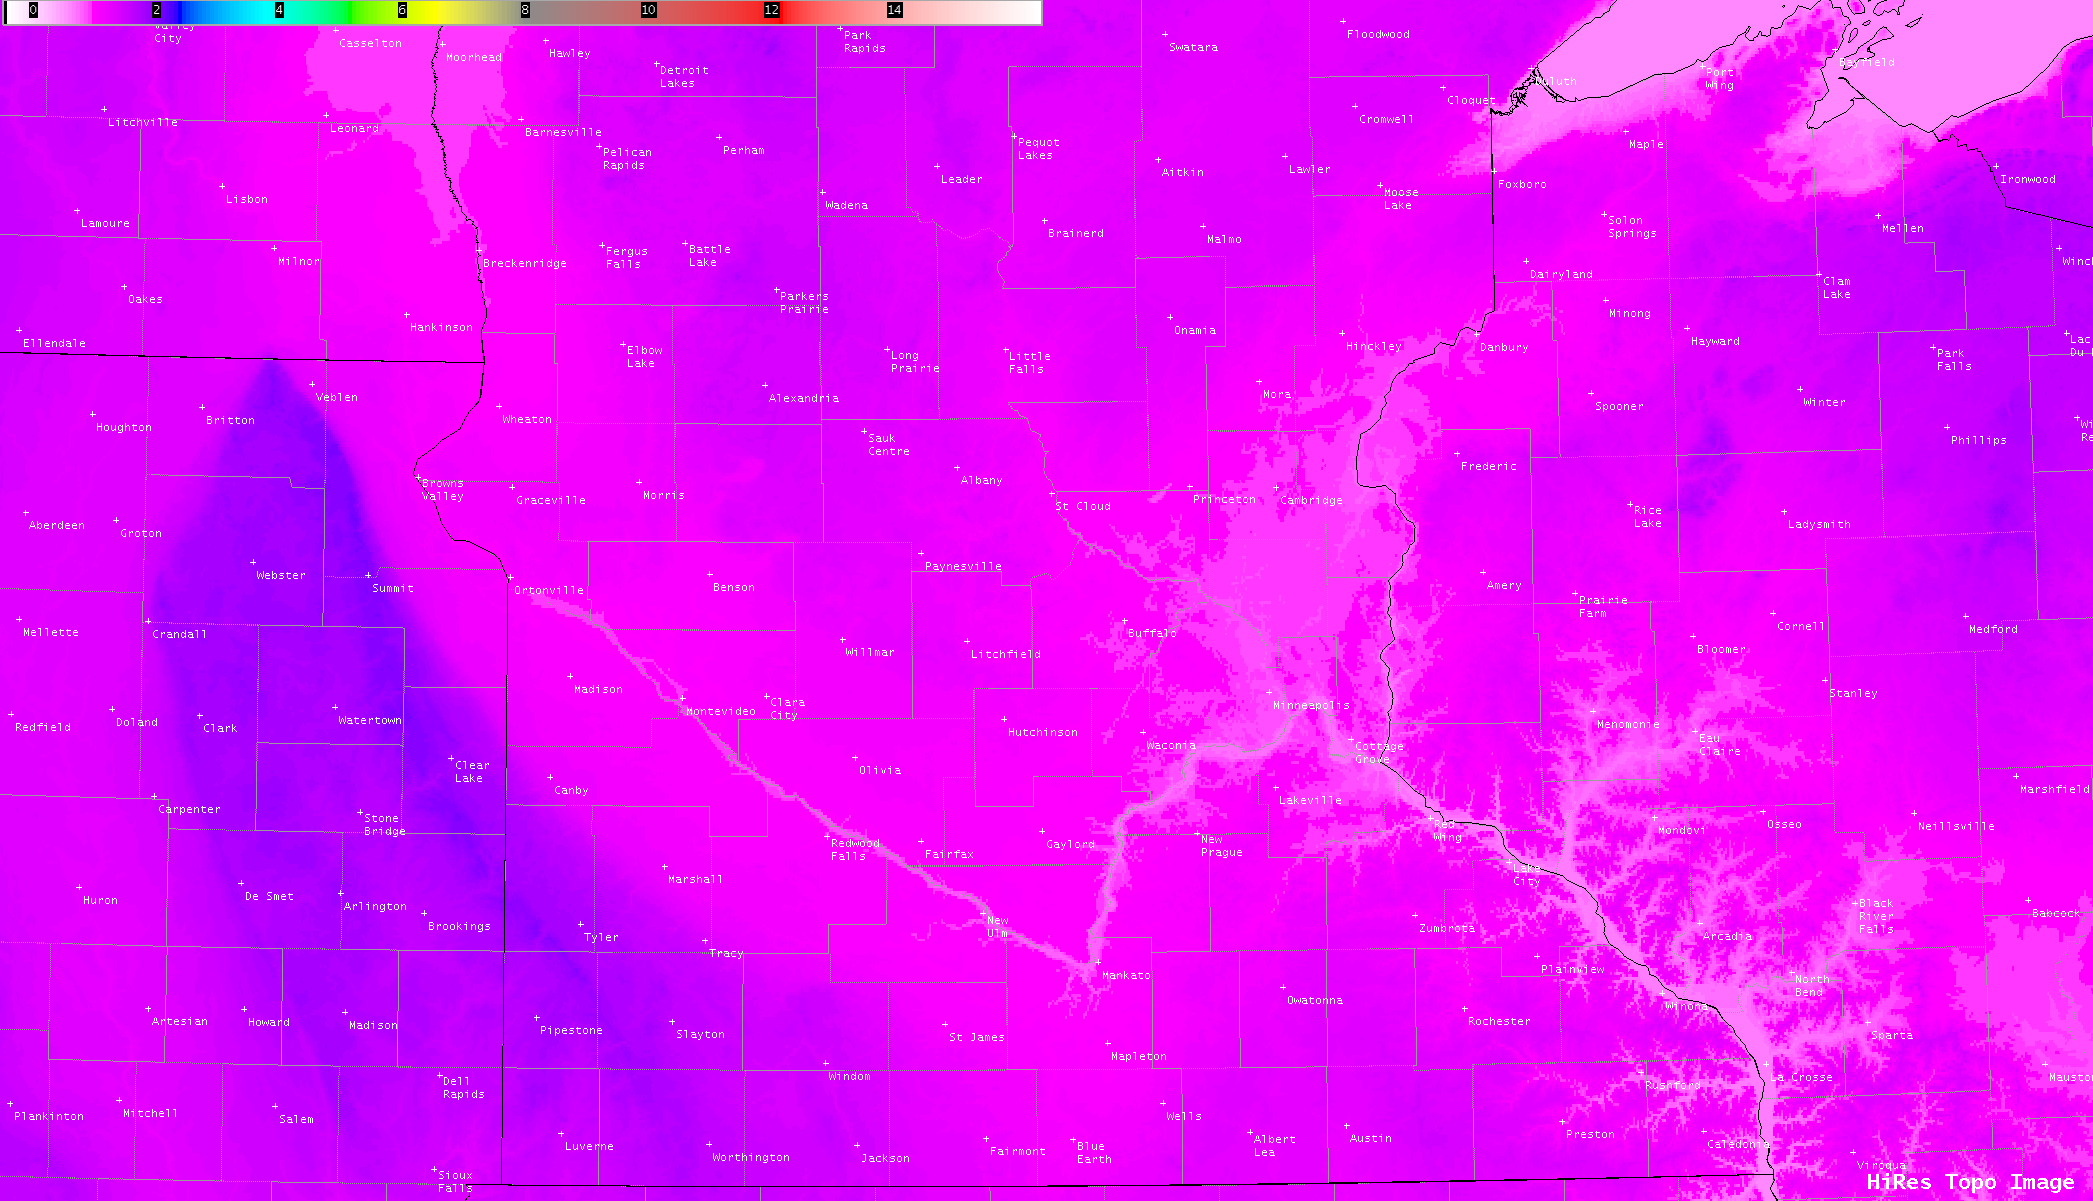
Comparisons of GOES-16 Land Surface Temperature (LST) and Visible images at 1401 UTC and 1501 UTC (below) indicated that LST values were as much as 10ºF colder within the areas of snow cover (brighter shades of cyan) compared to adjacent bare ground.
GOES-16 Land Surface Temperature and “Red” Visible (0.64 µm) images at 1401 UTC [click to enlarge]
GOES-16 Land Surface Temperature and “Red” Visible (0.64 µm) images at 1501 UTC [click to enlarge]
View only this post
Read Less
![True Color RGB images from MODIS (Terra) and VIIRS (NOAA-20 and Suomi NPP) [click to enlarge]](https://cimss.ssec.wisc.edu/satellite-blog/wp-content/uploads/sites/5/2019/05/190512_modis_viirs_truecolor_china_anim.gif)
![True Color RGB images from MODIS (Terra) and VIIRS (Suomi NPP) [click to enlarge]](https://cimss.ssec.wisc.edu/satellite-blog/wp-content/uploads/sites/5/2019/05/190510_190512_modis_viirs_truecolor_China_anim.gif)
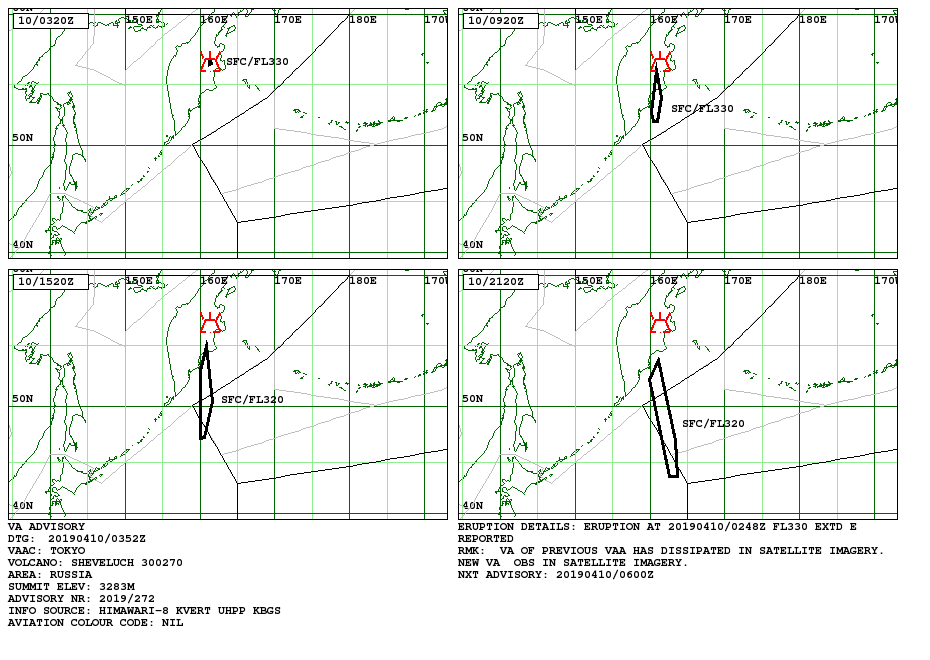
![Surface analyses at 3-hour intervals from 12 UTC on 11 May to 00 UTC on 13 May [click to enlarge]](https://cimss.ssec.wisc.edu/satellite-blog/wp-content/uploads/sites/5/2019/05/190511_190513_surface_analyses_asia_anim.gif)
![Himawari-8 Split Window Difference (10.4-12.3 µm) iimages [click to play animation |MP4]](https://cimss.ssec.wisc.edu/satellite-blog/wp-content/uploads/sites/5/2019/05/190511_190512_himawari8_splitWindowDifference_China_blowing_dust_anim.gif)
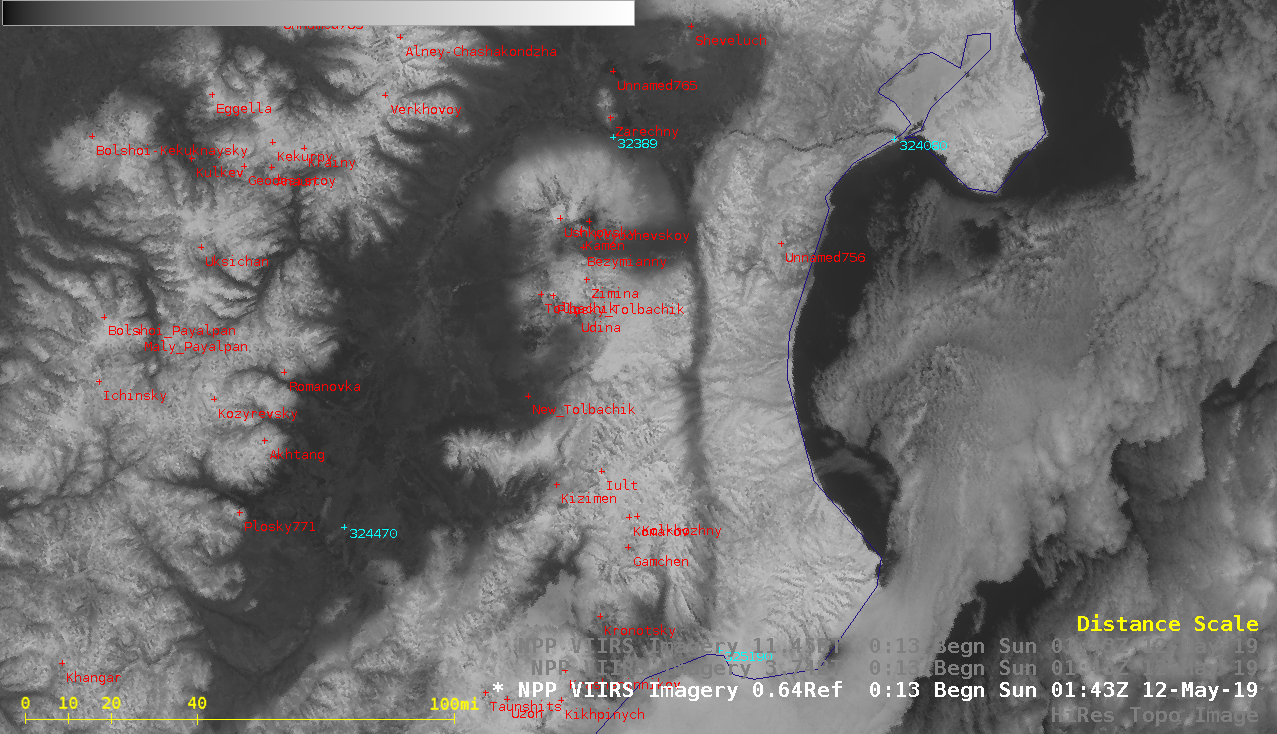
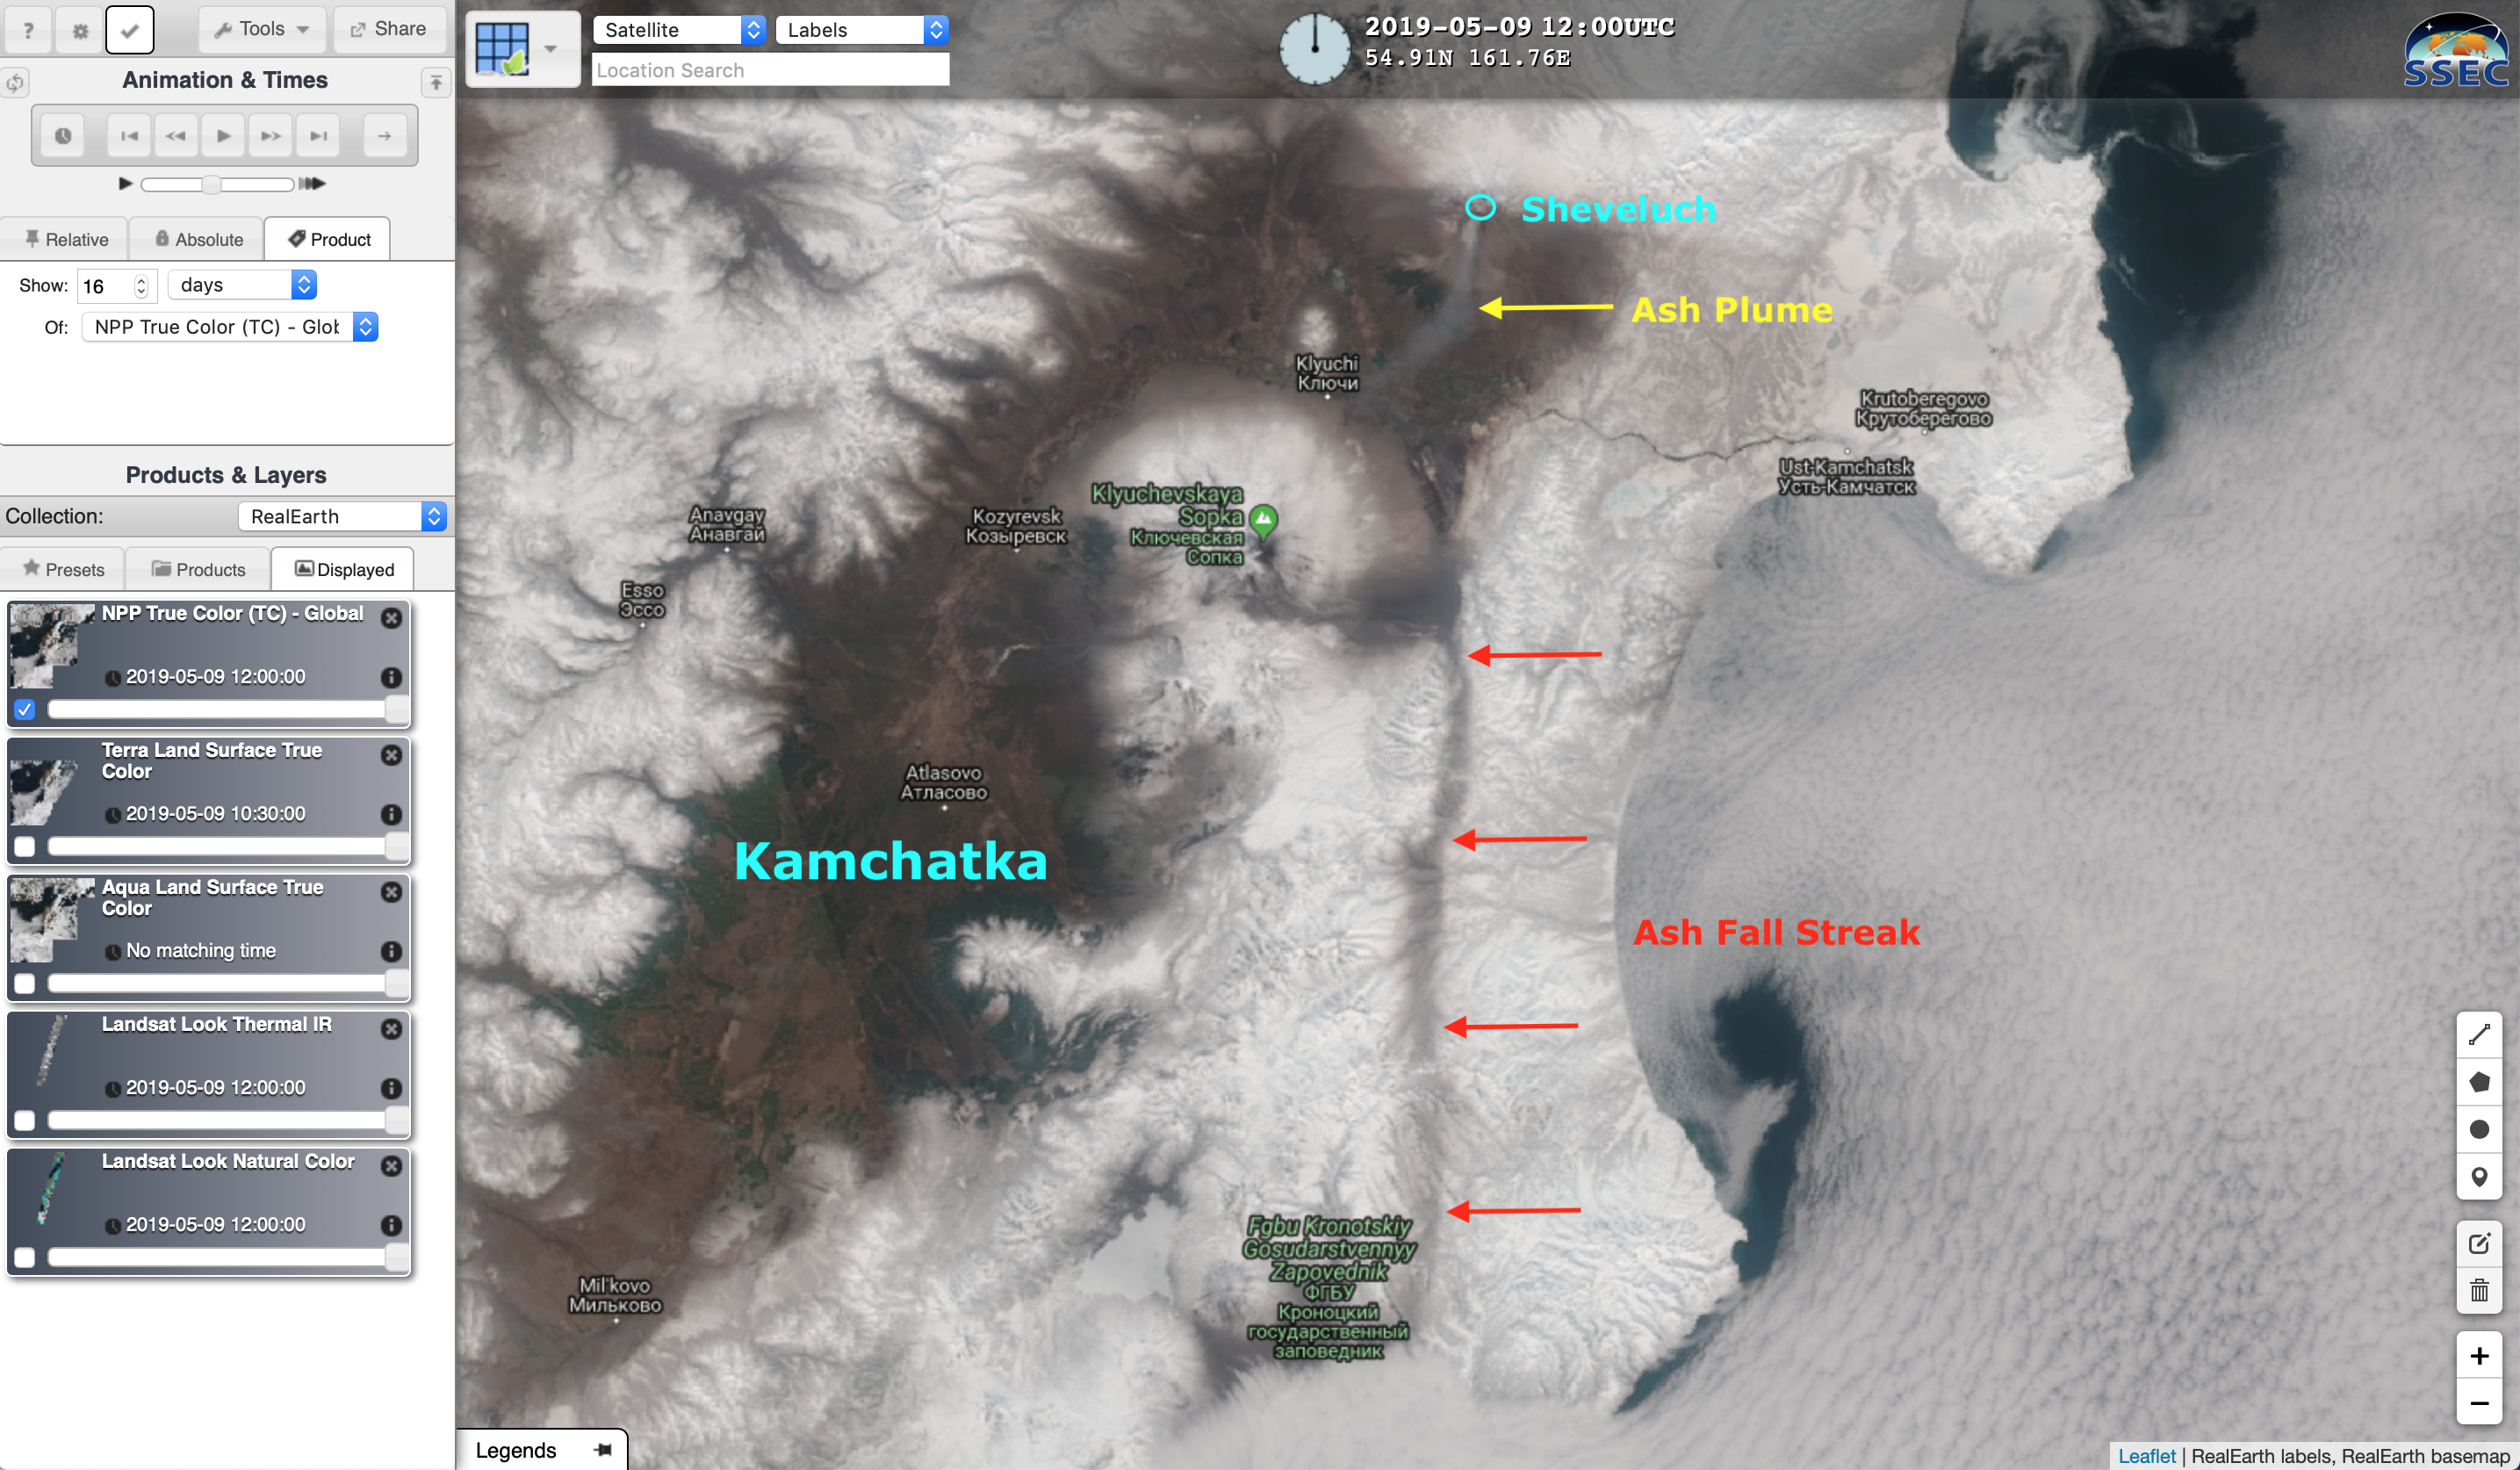
![Suomi NPP VIIRS Visible (0.64 µm), Shortwave Infrared (3.74 µm) and Infrared Window (11.45 µm) images, with topography [click to enlarge]](https://cimss.ssec.wisc.edu/satellite-blog/wp-content/uploads/sites/5/2019/05/190512_0143utc_suomiNPP_viirs_visible_shortwaveInfrared_infraredWindow_Kamchatka_ash_fall_plume_anim.gif)
![Suomi NPP VIIRS True Color RGB images, 06-12 May 2019 [click to play animation | MP4]](https://cimss.ssec.wisc.edu/satellite-blog/wp-content/uploads/sites/5/2019/05/190506_190512_suomiNPP_viirs_truecolor_Kamchatka_ash_fall_plume_anim.gif)
![Suomi NPP False Color, Ash Probability, Height, Loading and Effective Radius [click to enlarge]](https://cimss.ssec.wisc.edu/satellite-blog/wp-content/uploads/sites/5/2019/05/190509_0100utc_suomiNPP_falsecolor_ash_probability_height_loading_radius_Shiveluch_anim.gif)

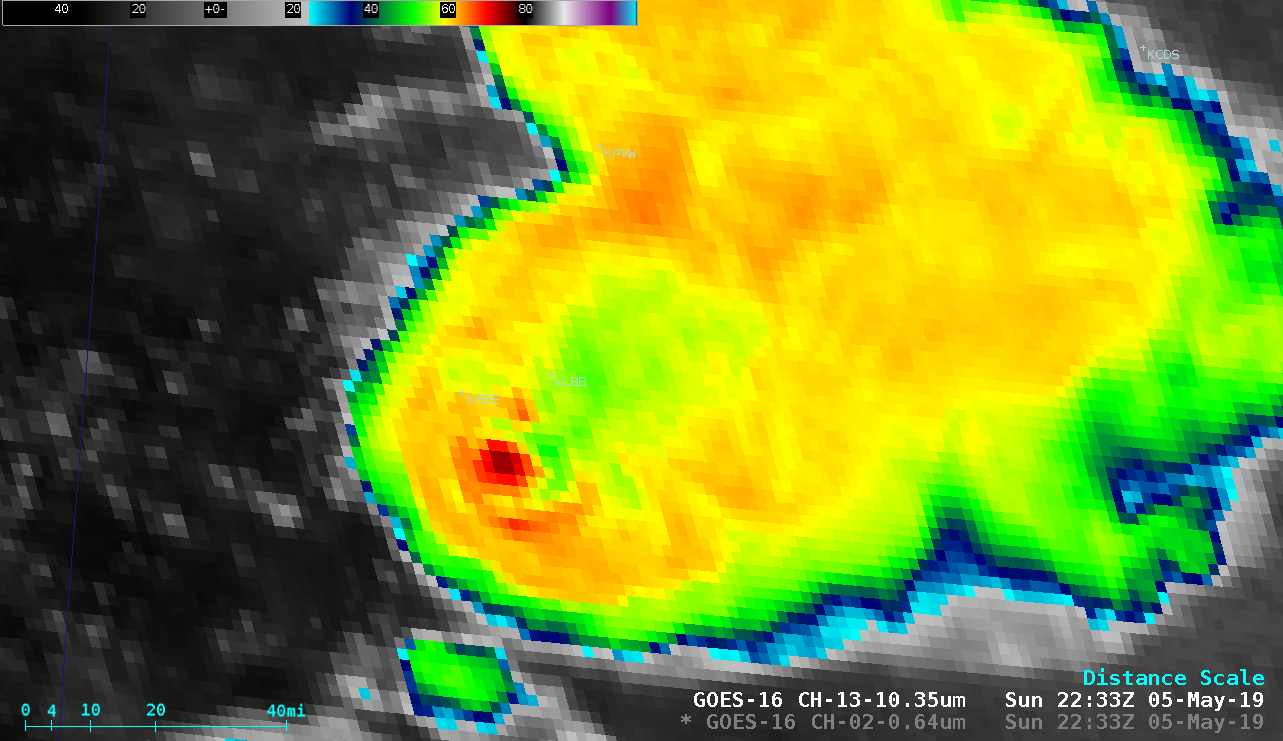

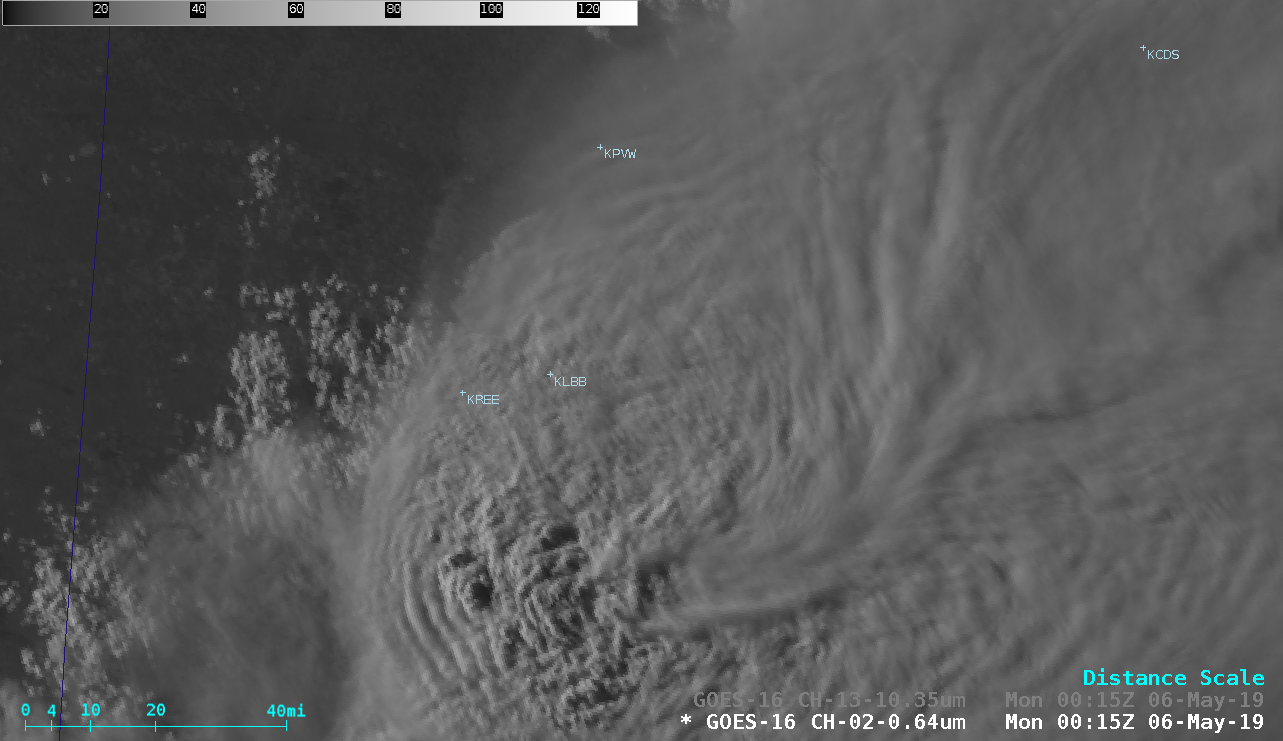
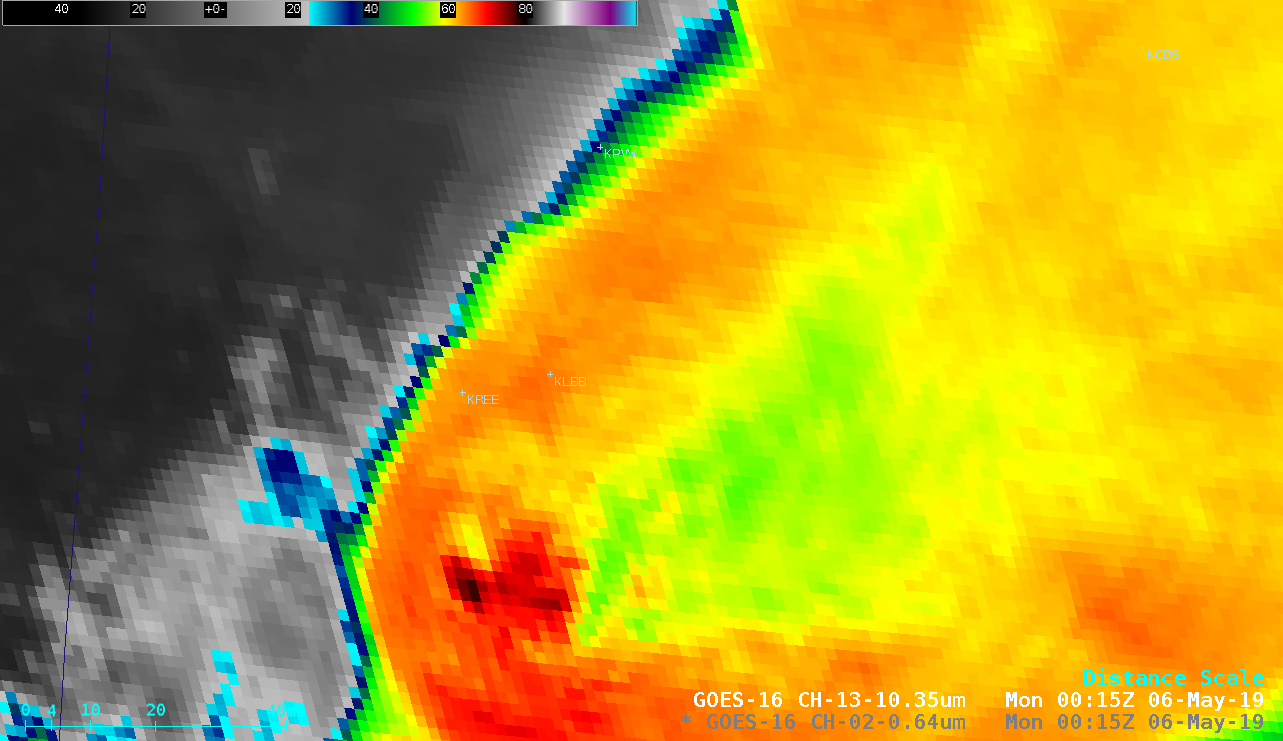
![GOES-16 "Red" Visible (0.64 µm) and "Clean" Infrared Window (10.3 µm) images at 0015 UTC on 06 May [click to enlarge]](https://cimss.ssec.wisc.edu/satellite-blog/wp-content/uploads/sites/5/2019/05/190506_0015utc_goes16_visible_infrared_TX_anim.gif)
![GOES-16 "Red" Visible (0.64 µm, left) and "Clean" Infrared Window (10.3 µm, right) images, with plots of SPC storm reports [click to play animation | MP4]](https://cimss.ssec.wisc.edu/satellite-blog/wp-content/uploads/sites/5/2019/05/190505_goes16_visible_infrared_spcStormReports_LBB_TX_anim.gif)

![GOES-16 "Red" Visible (0.64 µm, left) and "Clean" Infrared Window (10.3 µm, right) images with plots of SPC storm reports [click to play animation | MP4]](https://cimss.ssec.wisc.edu/satellite-blog/wp-content/uploads/sites/5/2019/05/190507_goes16_visible_infrared_spcStormReports_KMAF_anim.gif)
