![Himawari-8 False Color RGB images [click to play animation | MP4]](https://cimss.ssec.wisc.edu/satellite-blog/wp-content/uploads/sites/5/2019/06/haimage_80.png)
Himawari-8 False Color RGB images [click to play animation | MP4]
For the first time since 1924, a major eruption of the
Raikoke volcano occurred around 1800 UTC on 21 June 2019. Himawari-8 False Color Red-Green-Blue (RGB) images from the
NOAA/CIMSS Volcanic Cloud Monitoring site
(above) showed — via the brighter yellow areas — that a large portion of the volcanic plume was rich in both ash and sulfur dioxide (SO2). The
Tokyo VAAC estimated the maximum ash height to be
43,000 feet (~13 km) above ground level — and CALIPSO CALIOP data indicated a maximum ash height around 12 km
shortly after 02 UTC on 22 June (between 45-50º N latitude and 159-161º E longitude).
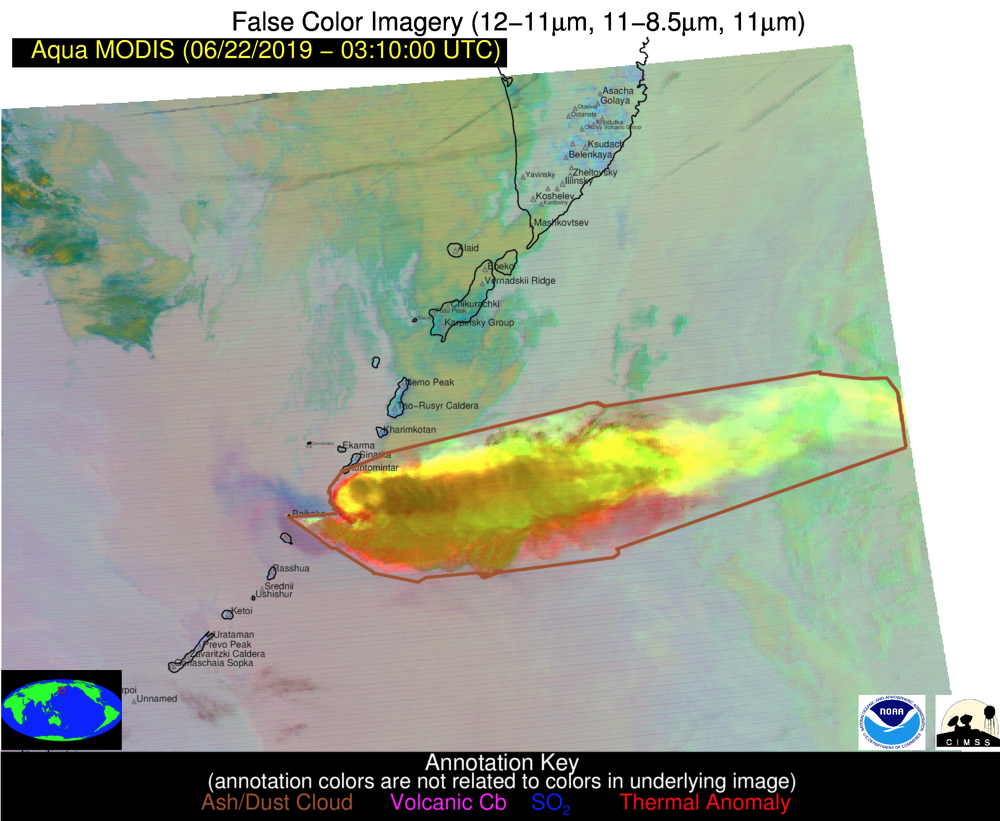
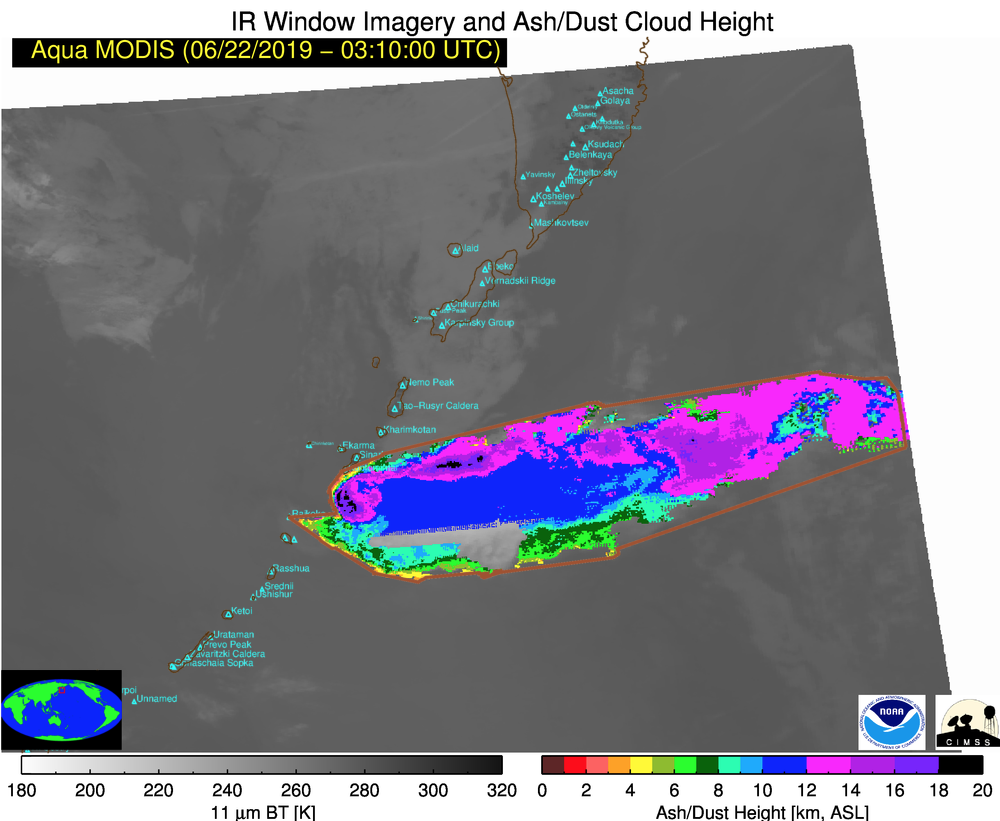
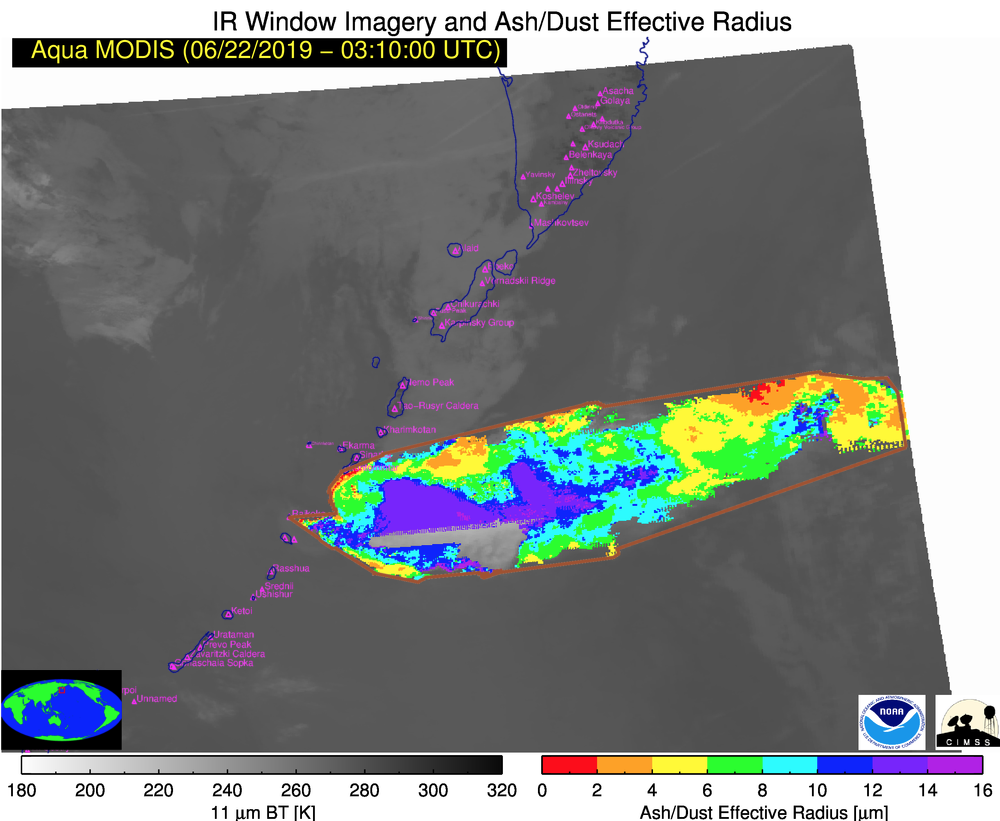
A comparison of an Aqua MODIS False Color RGB image with the corresponding Ash Height, Ash Loading and Ash Effective Radius retrieved products at 0310 UTC on 22 June (below) indicated maximum ash height values of 18-20 km (black pixels) immediately downwind of the eruption site. Maximum Himawari-8 Ash Height values were in the 16-18 km range.
![Aqua MODIS False Color RGB, Ash Height, Ash Loading and Ash Effective Radius at 0310 UTC on 22 June [click to enlarge]](https://cimss.ssec.wisc.edu/satellite-blog/wp-content/uploads/sites/5/2019/06/190622_0310utc_aqua_modis_falseColor_ashHeight_ashLoading_ashRadius_Raikoke_anim.gif)
Aqua MODIS False Color RGB image with Ash Height, Ash Loading and Ash Effective Radius retrieved products [click to enlarge]
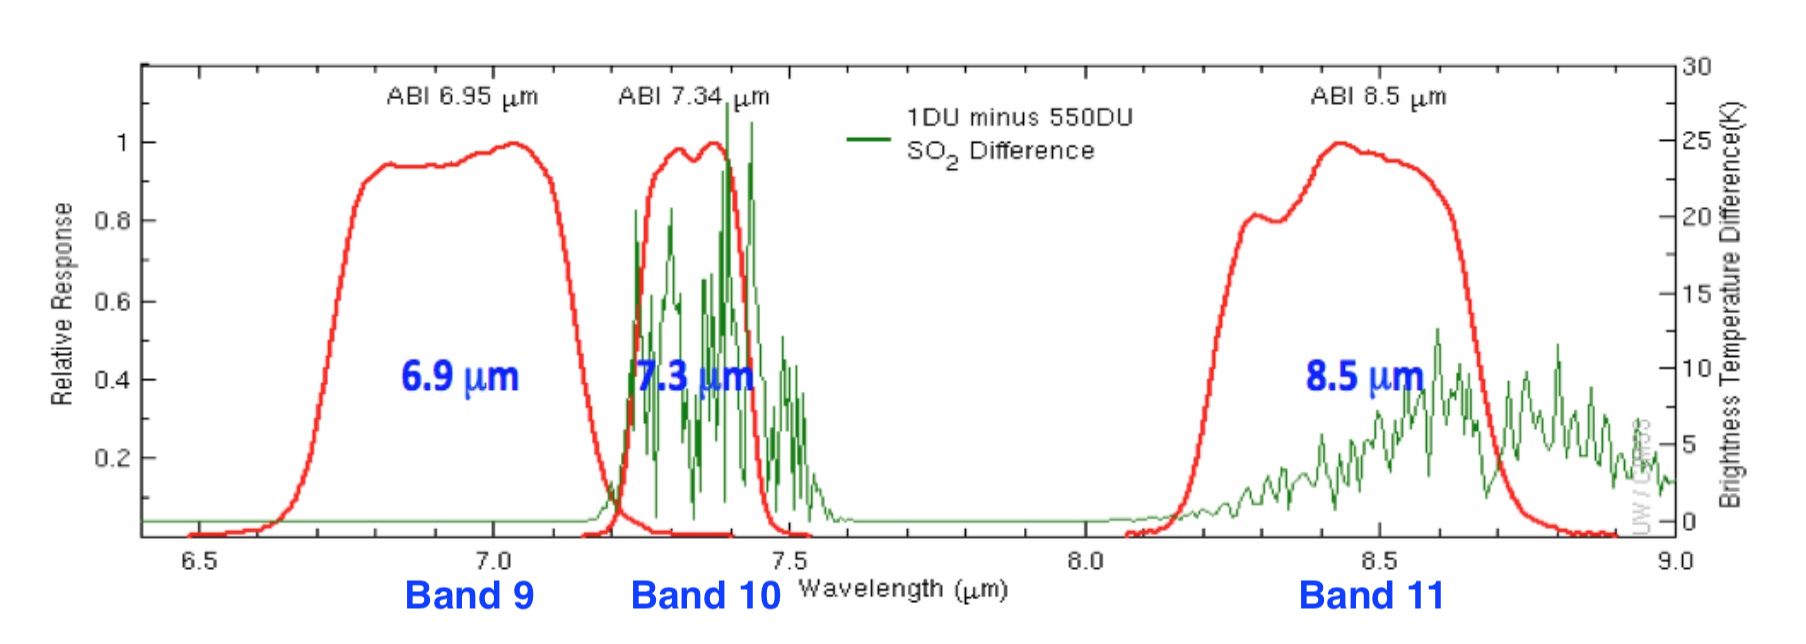
In a comparison of Himawari-8 Upper-level (6.2 µm), Mid-level (6.9 µm) and Low-level (7.3 µm) Water Vapor images
(below), since the 7.3 µm spectral band is also sensitive to
SO2 absorption, those images showed a good signature of the leading filament of volcanic SO2 as it was transported east-southeastward over the North Pacific Ocean.
![Water Vapor images from Himawari-8: Upper-level (6.2 µm, top), Mid-level (6.9 µm, middle) and Low-level (7.3 µm, bottom) [click to play animation | MP4]](https://cimss.ssec.wisc.edu/satellite-blog/wp-content/uploads/sites/5/2019/06/HIM08_WATER_VAPOR_RAIKOKE_21JUN2019_2019173_033000_HIMAWARI-8_0003PANELS.GIF)
Water Vapor images from Himawari-8: Upper-level (6.2 µm, top), Mid-level (6.9 µm, middle) and Low-level (7.3 µm, bottom) [click to play animation | MP4]
Similarly, the GOES–17
(GOES-West) Low-level Water Vapor (
7.3 µm) images also showed the filament of volcanic SO2 that was being drawn into the circulation of a Gale Force Low south of the Aleutian Islands. As a result, the
Anchorage VAAC issued aviation
Volcanic Ash Advisories that covered large areas of the North Pacific Ocean and southern Bering Sea; they continued to estimate the maximum ash height to be
43,000 feet. Around
16 UTC on 22 June, CALPSO CALIOP data sampled a small portion of the ash at an altitude near 17 km (between 45-50º N latitude, 155-157º W longitude).
![Water Vapor images from GOES-17: Upper-level (6.2 µm, top), Mid-level (6.9 µm, middle) and Low-level (7.3 µm, bottom) [click to play animation | MP4]](https://cimss.ssec.wisc.edu/satellite-blog/wp-content/uploads/sites/5/2019/06/G17_WATER_VAPOR_RAIKOKE_21JUN2019_2019173_082033_GOES-17_0003PANELS.GIF)
Water Vapor images from GOES-17: Upper-level (6.2 µm, top), Mid-level (6.9 µm, middle) and Low-level (7.3 µm, bottom) [click to play animation | MP4]
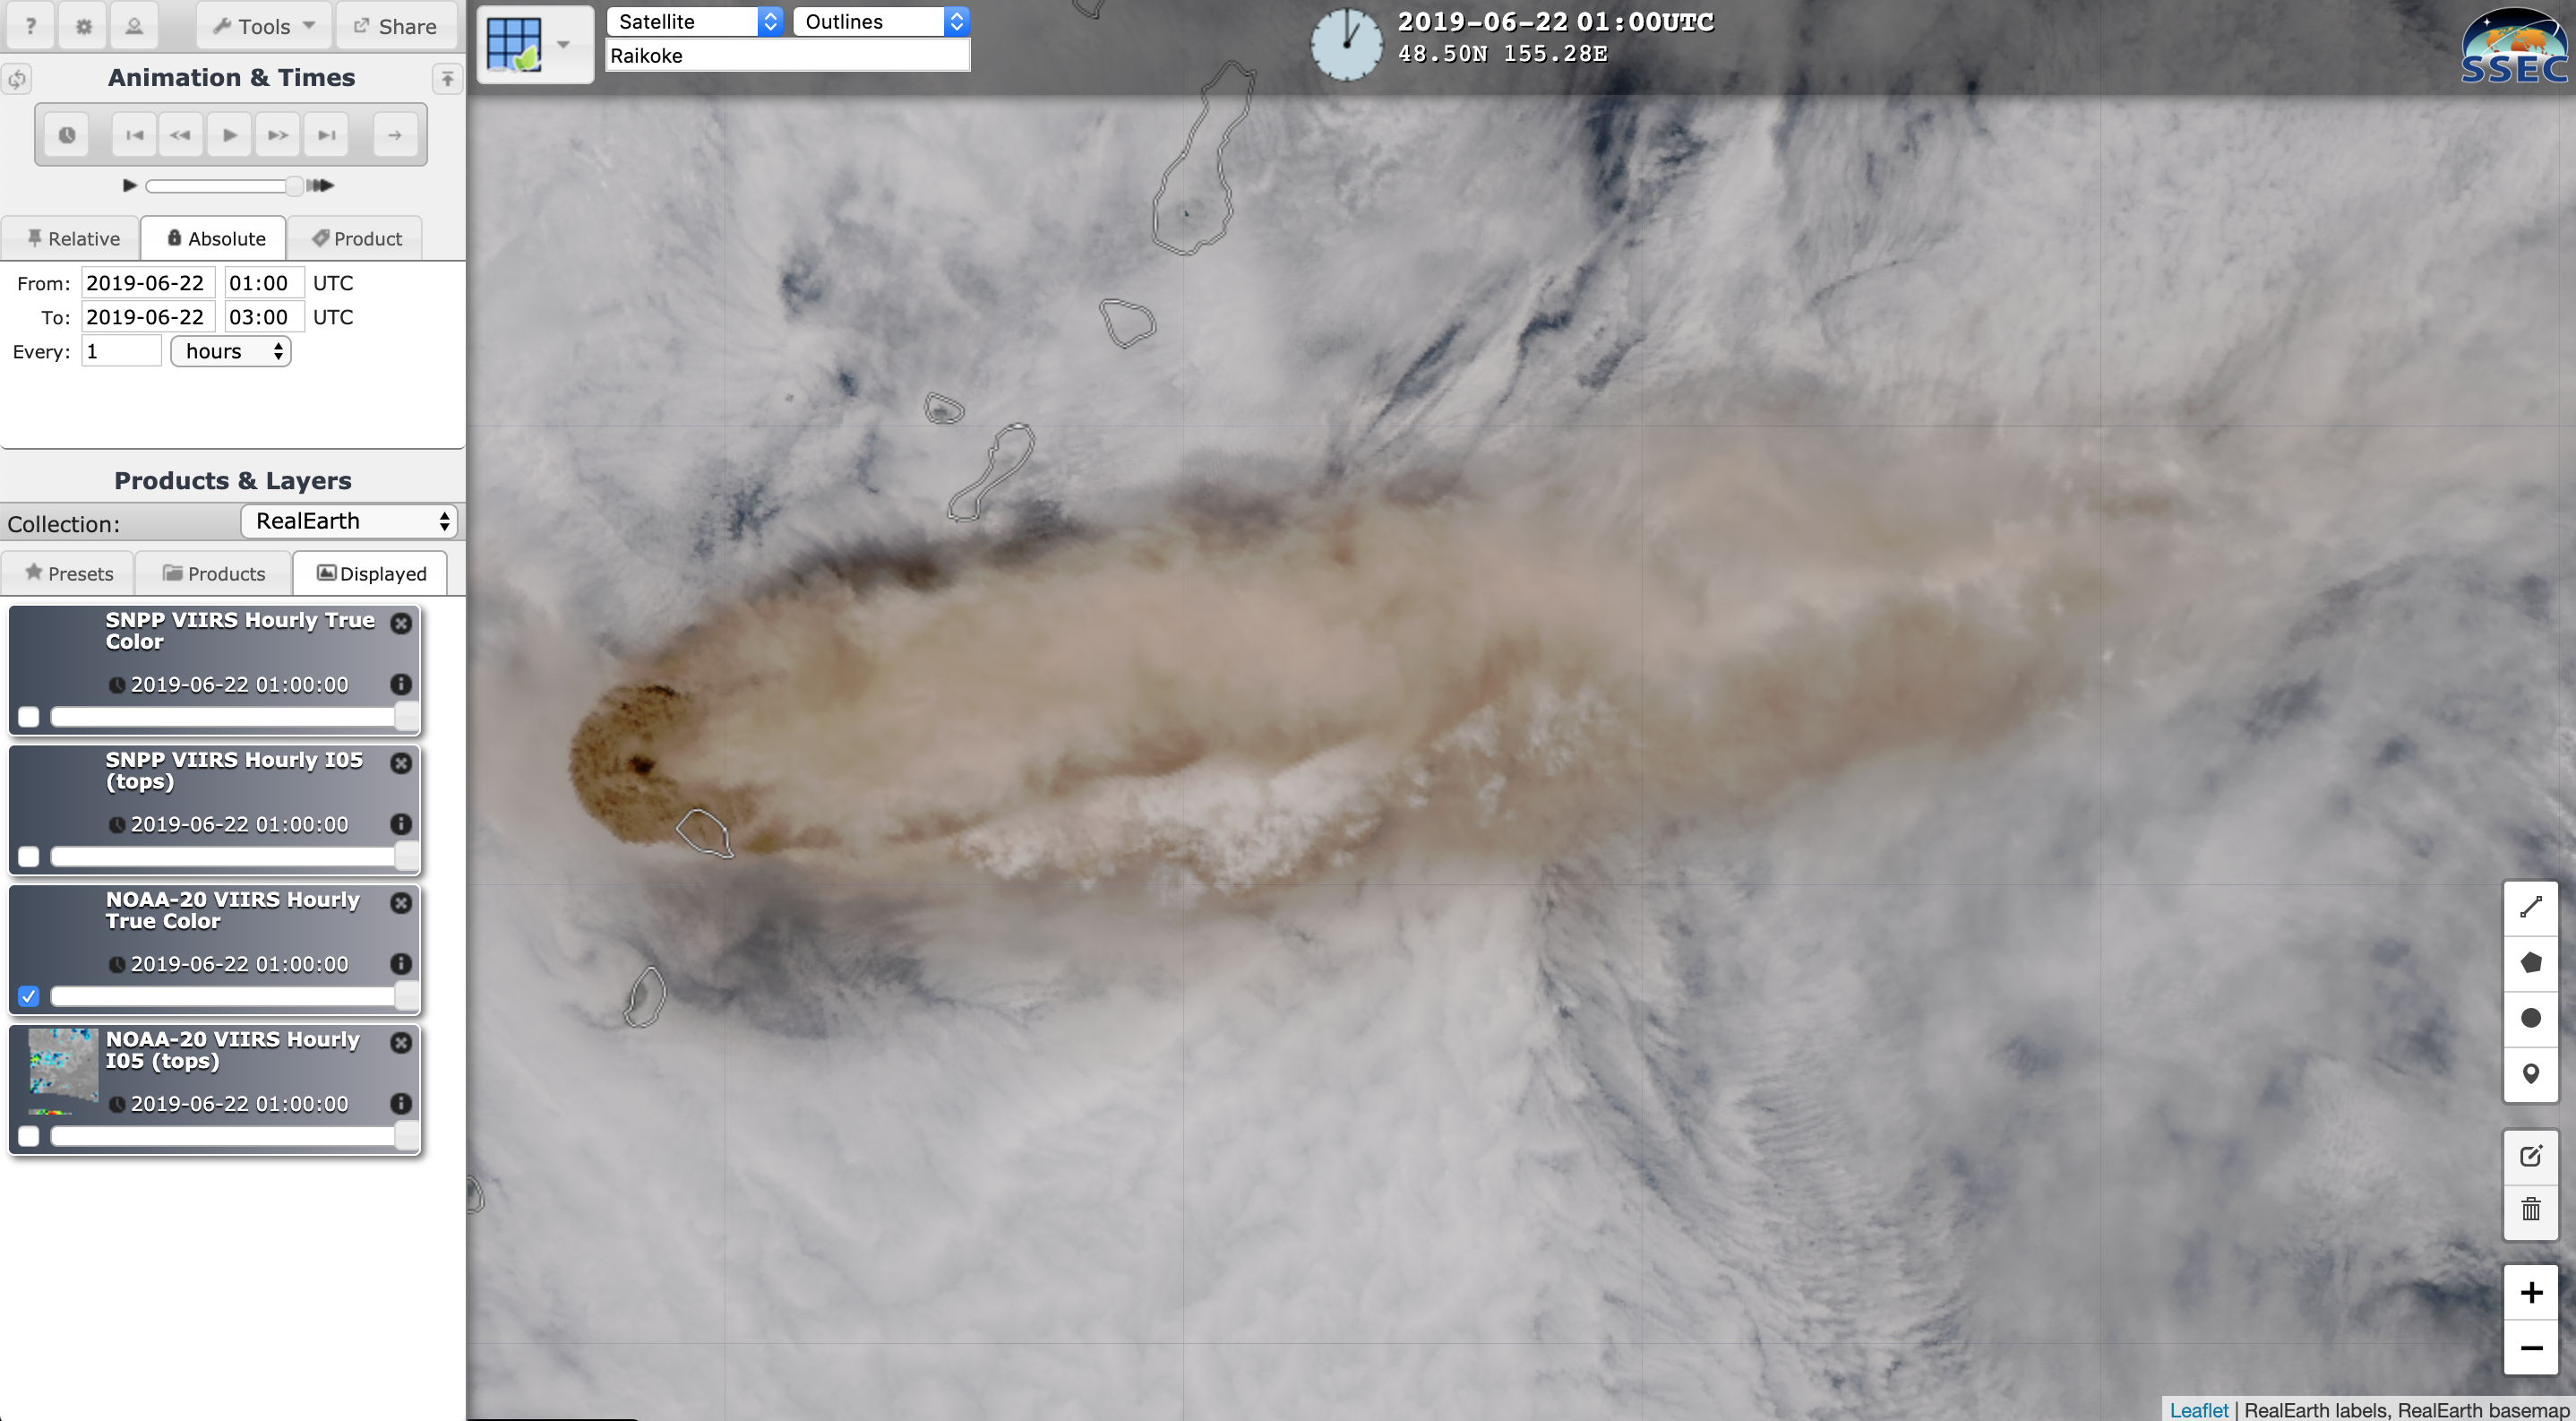
VIIRS True Color RGB and Infrared Window (11.45 µm) images from NOAA-20 and Suomi NPP as viewed using
RealEarth are shown below at approximately
01 UTC,
02 UTC and
03 UTC on 22 June. The combination of True Color and Infrared imagery indicated that volcanic ash was present a multiple altitudes.
![VIIRS True Color RGB and Infrared Window (11.45 µm) images from NOAA-20 and Suomi NPP [click to enlarge]](https://cimss.ssec.wisc.edu/satellite-blog/wp-content/uploads/sites/5/2019/06/190622_noaa20_suomiNPP_viirs_trueColor_infraredWindow_Raikoke_2_anim.gif)
VIIRS True Color RGB and Infrared Window (11.45 µm) images from NOAA-20 and Suomi NPP at 01, 02 and 03 UTC on 22 June [click to enlarge]
Due to the highly-oblique satellite viewing angle of GOES-17, multiple Raikoke eruption pulses of significant vertical extent were clearly evident in GOES-17 “Red” Visible (
0.64 µm) images
(below).
GOES-17 “Red” Visible (0.64 µm) images [click to play animation | MP4]
A somewhat less oblique view from the west was provided by the
NSMC FY-2G satellite
(below).
![NSMC FY-2G Visible (0.73 µm) images [click to play animation | MP4]](https://cimss.ssec.wisc.edu/satellite-blog/wp-content/uploads/sites/5/2019/06/FY2G_VIS_RAIKOKE_21JUN2019_2019172_220000_0001PANEL.GIF)
NSMC FY-2G Visible (0.73 µm) images [click to play animation | MP4]
Himawari-8 “Red” Visible (0.64 µm) images
(below) provided another interesting view of the multiple eruption pulses — and since the eruption began around 5 AM local time, long early morning shadows were cast by the initial bursts of tall volcanic clouds. A
faster animation revealed shock waves propagating radially outward from the eruption site.
Himawari-8 “Red” Visible (0.64 µm) images [click to play animation | MP4]
Incidentally, an astronaut aboard the International Space Station took a photo of the volcanic cloud at 2246 UTC on 21 June — and the two Visible images that bracket that time (2240 and 2250 UTC) from GOES-17 and Himawari-8 are shown below.
![Photo taken by an astronaut on the International Space Station [click to enlarge]](https://eoimages.gsfc.nasa.gov/images/imagerecords/145000/145226/iss059e119250_lrg.jpg)
Photo taken by an astronaut on the International Space Station at 2246 UTC [click to enlarge]
![GOES-17 Visible (0.64 µm) images at 2240 and 2250 UTC {click to enlarge]](https://cimss.ssec.wisc.edu/satellite-blog/wp-content/uploads/sites/5/2019/06/190621_2240utc_2250utc_goes17_visible_Raikoke_anim.gif)
GOES-17 Visible (0.64 µm) images at 2240 and 2250 UTC {click to enlarge]
![Himawari-8 Visible (0.64 µm) images at 2240 and 2250 UTC {click to enlarge]](https://cimss.ssec.wisc.edu/satellite-blog/wp-content/uploads/sites/5/2019/06/190621_2240utc_2250utc_himawari8_visible_Raikoke_anim.gif)
Himawari-8 Visible (0.64 µm) images at 2240 and 2250 UTC {click to enlarge]
===== 23 June Update =====
![Himawari-8 False Color RGB images [click to play MP4 animation]](https://cimss.ssec.wisc.edu/satellite-blog/wp-content/uploads/sites/5/2019/06/190623_18z_himawari8_falsecolor.png)
Himawari-8 False Color RGB images [click to play MP4 animation]
A 2-day animation of 10-minute Himawari-8 False Color images
(above) showed the ash- and SO2-rich volcanic plume
(brighter shades of yellow) eventually being transported northeastward across the western Aleutian Islands and circulating cyclonically over the Bering Sea. Similarly, this volcanic cloud transport was also seen in the corresponding
GOES-17 False Color imagery.
===== 24 June Update =====
![GOES-17 SO2 RGB images [click to play animation | MP4]](https://cimss.ssec.wisc.edu/satellite-blog/wp-content/uploads/sites/5/2019/06/ak_so2-20190624_140034.png)
GOES-17 SO2 RGB images [click to play animation | MP4]
GOES-17 SO2 RGB imagery
(above) continued to show a signature of the volcanic cloud
(brighter shades of yellow) from the Raikoke eruption over a large portion of the Bering Sea on 24 June.
Volcanic ash advisories were issued for flight altitudes as high as 40,000 feet — and a pilot report of SO2 over the Bering Sea at 47,000 feet was received at 1822 UTC
(below).
![GOES-17 SO2 RGB, Split Clout Top Phase (11.2-8.4 µm) and Dust RGB images, with a pilot report of SO2 [click to enlarge]](https://cimss.ssec.wisc.edu/satellite-blog/wp-content/uploads/sites/5/2019/06/190624_goes17_so2RGB_splitCloudTopPhase_dustRGB_pirep_Raikoke_anim.gif)
GOES-17 SO2 RGB, Split Clout Top Phase (11.2-8.4 µm) and Dust RGB images, with a pilot report of SO2 [click to enlarge]
===== 25 June Update =====
![GOES-17 SO2 RGB images [click to play animation | MP4]](https://cimss.ssec.wisc.edu/satellite-blog/wp-content/uploads/sites/5/2019/06/ak_so2_v2-20190625_140034.png)
GOES-17 SO2 RGB images [click to play animation | MP4]
GOES-17 SO2 RGB images
(above) showed the persistent signature of the SO2-rich volcanic cloud as much of it remained within the circulation of a quasi-stationary low pressure system in the Bering Sea.
An interesting Pilot Report north of the Aleutians at 36,000 feet (below) noted thin grey-colored layers below the altitude of the aircraft. GOES-17 Air Mass RGB images showed a subtle brown/tan plume — could this have been a thin filament of ash from the Raikoke eruption that was drawn into the circulation of the Bering Sea low?
![GOES-17 SO2 RGB, Air Mass RGB, Dust RGB and Split Cloud Top Phase (11.2-8.4 µm) images, with a 2008 UTC Pilot Report [click to enlarge]](https://cimss.ssec.wisc.edu/satellite-blog/wp-content/uploads/sites/5/2019/06/190625_2010utc_goes17_so2_airmass_dust_splitCloudTopPhase_pirep_AK_anim.gif)
GOES-17 SO2 RGB, Air Mass RGB, Dust RGB and Split Cloud Top Phase (11.2-8.4 µm) images, with a 2008 UTC Pilot Report [click to enlarge]
Another Pilot Report farther to the west at 2119 UTC
(below) was close to the southern edge of the GOES-17 SO2 signatures, but no sulphur odor was reported; however, they did note the presence of an apparent ash layer south of Shemya in the western Aleutian Islands.
![GOES-17 SO2 RGB and Split Cloud Top Phase (11.2-8.4 µm) images, with a 2119 UTC Pilot Report [click to enlarge]](https://cimss.ssec.wisc.edu/satellite-blog/wp-content/uploads/sites/5/2019/06/190625_2120utc_goes17_so2_splitCloudTopPhase_pirep_anim.gif)
GOES-17 SO2 RGB and Split Cloud Top Phase (11.2-8.4 µm) images, with a 2119 UTC Pilot Report [click to enlarge]
View only this post
Read Less
![Himawari-8 Visible (0.64 µm, left), Shortwave Infrared (3.9 µm, center) and Infrared Window (10.4 µm, right) images [click to play animation | MP4]](https://cimss.ssec.wisc.edu/satellite-blog/wp-content/uploads/sites/5/2019/06/190616_himawari8_visible_shortwaveInfrared_infraredWindow_Ulawun_volcano_anim.gif)
![Himawari-8 Infrared Window (10.4 µm) images [click to play animation | MP4]](https://cimss.ssec.wisc.edu/satellite-blog/wp-content/uploads/sites/5/2019/06/190626_himawari8_infraredWindow_Ulawun_volcano_anim.gif)
![Himawari-8 Shortwave Infrared (3.9 um) images [click to play animation | MP4]](https://cimss.ssec.wisc.edu/satellite-blog/wp-content/uploads/sites/5/2019/06/190626_himawari8_shortwaveInfrared_Ulawun_anim.gif)
![Plot of volcano radiative power (red) and volcanic cloud longwave infrared brightness temperature (green), courtesy of Mike Pavolonis (NOAA/NESDIS) [click to enlarge]](https://cimss.ssec.wisc.edu/satellite-blog/wp-content/uploads/sites/5/2019/06/190626_VOLCAT_thermal_time_series_new_Ulawun.png)
![False Color RGB (top left), Ash Height (top right), Ash Effective Radius (bottom left) and Ash Loading (bottom right) [click to play animation | MP4]](https://cimss.ssec.wisc.edu/satellite-blog/wp-content/uploads/sites/5/2019/06/190626_volcat_ash_retrievals_Ulawun.gif)
![GOES-17 "Red" Visible <em>(0.64 µm)</em> images [click to play animation | MP4]](https://cimss.ssec.wisc.edu/satellite-blog/wp-content/uploads/sites/5/2019/06/190626_goes17_visible_Ulawun_volcano_anim.gif)
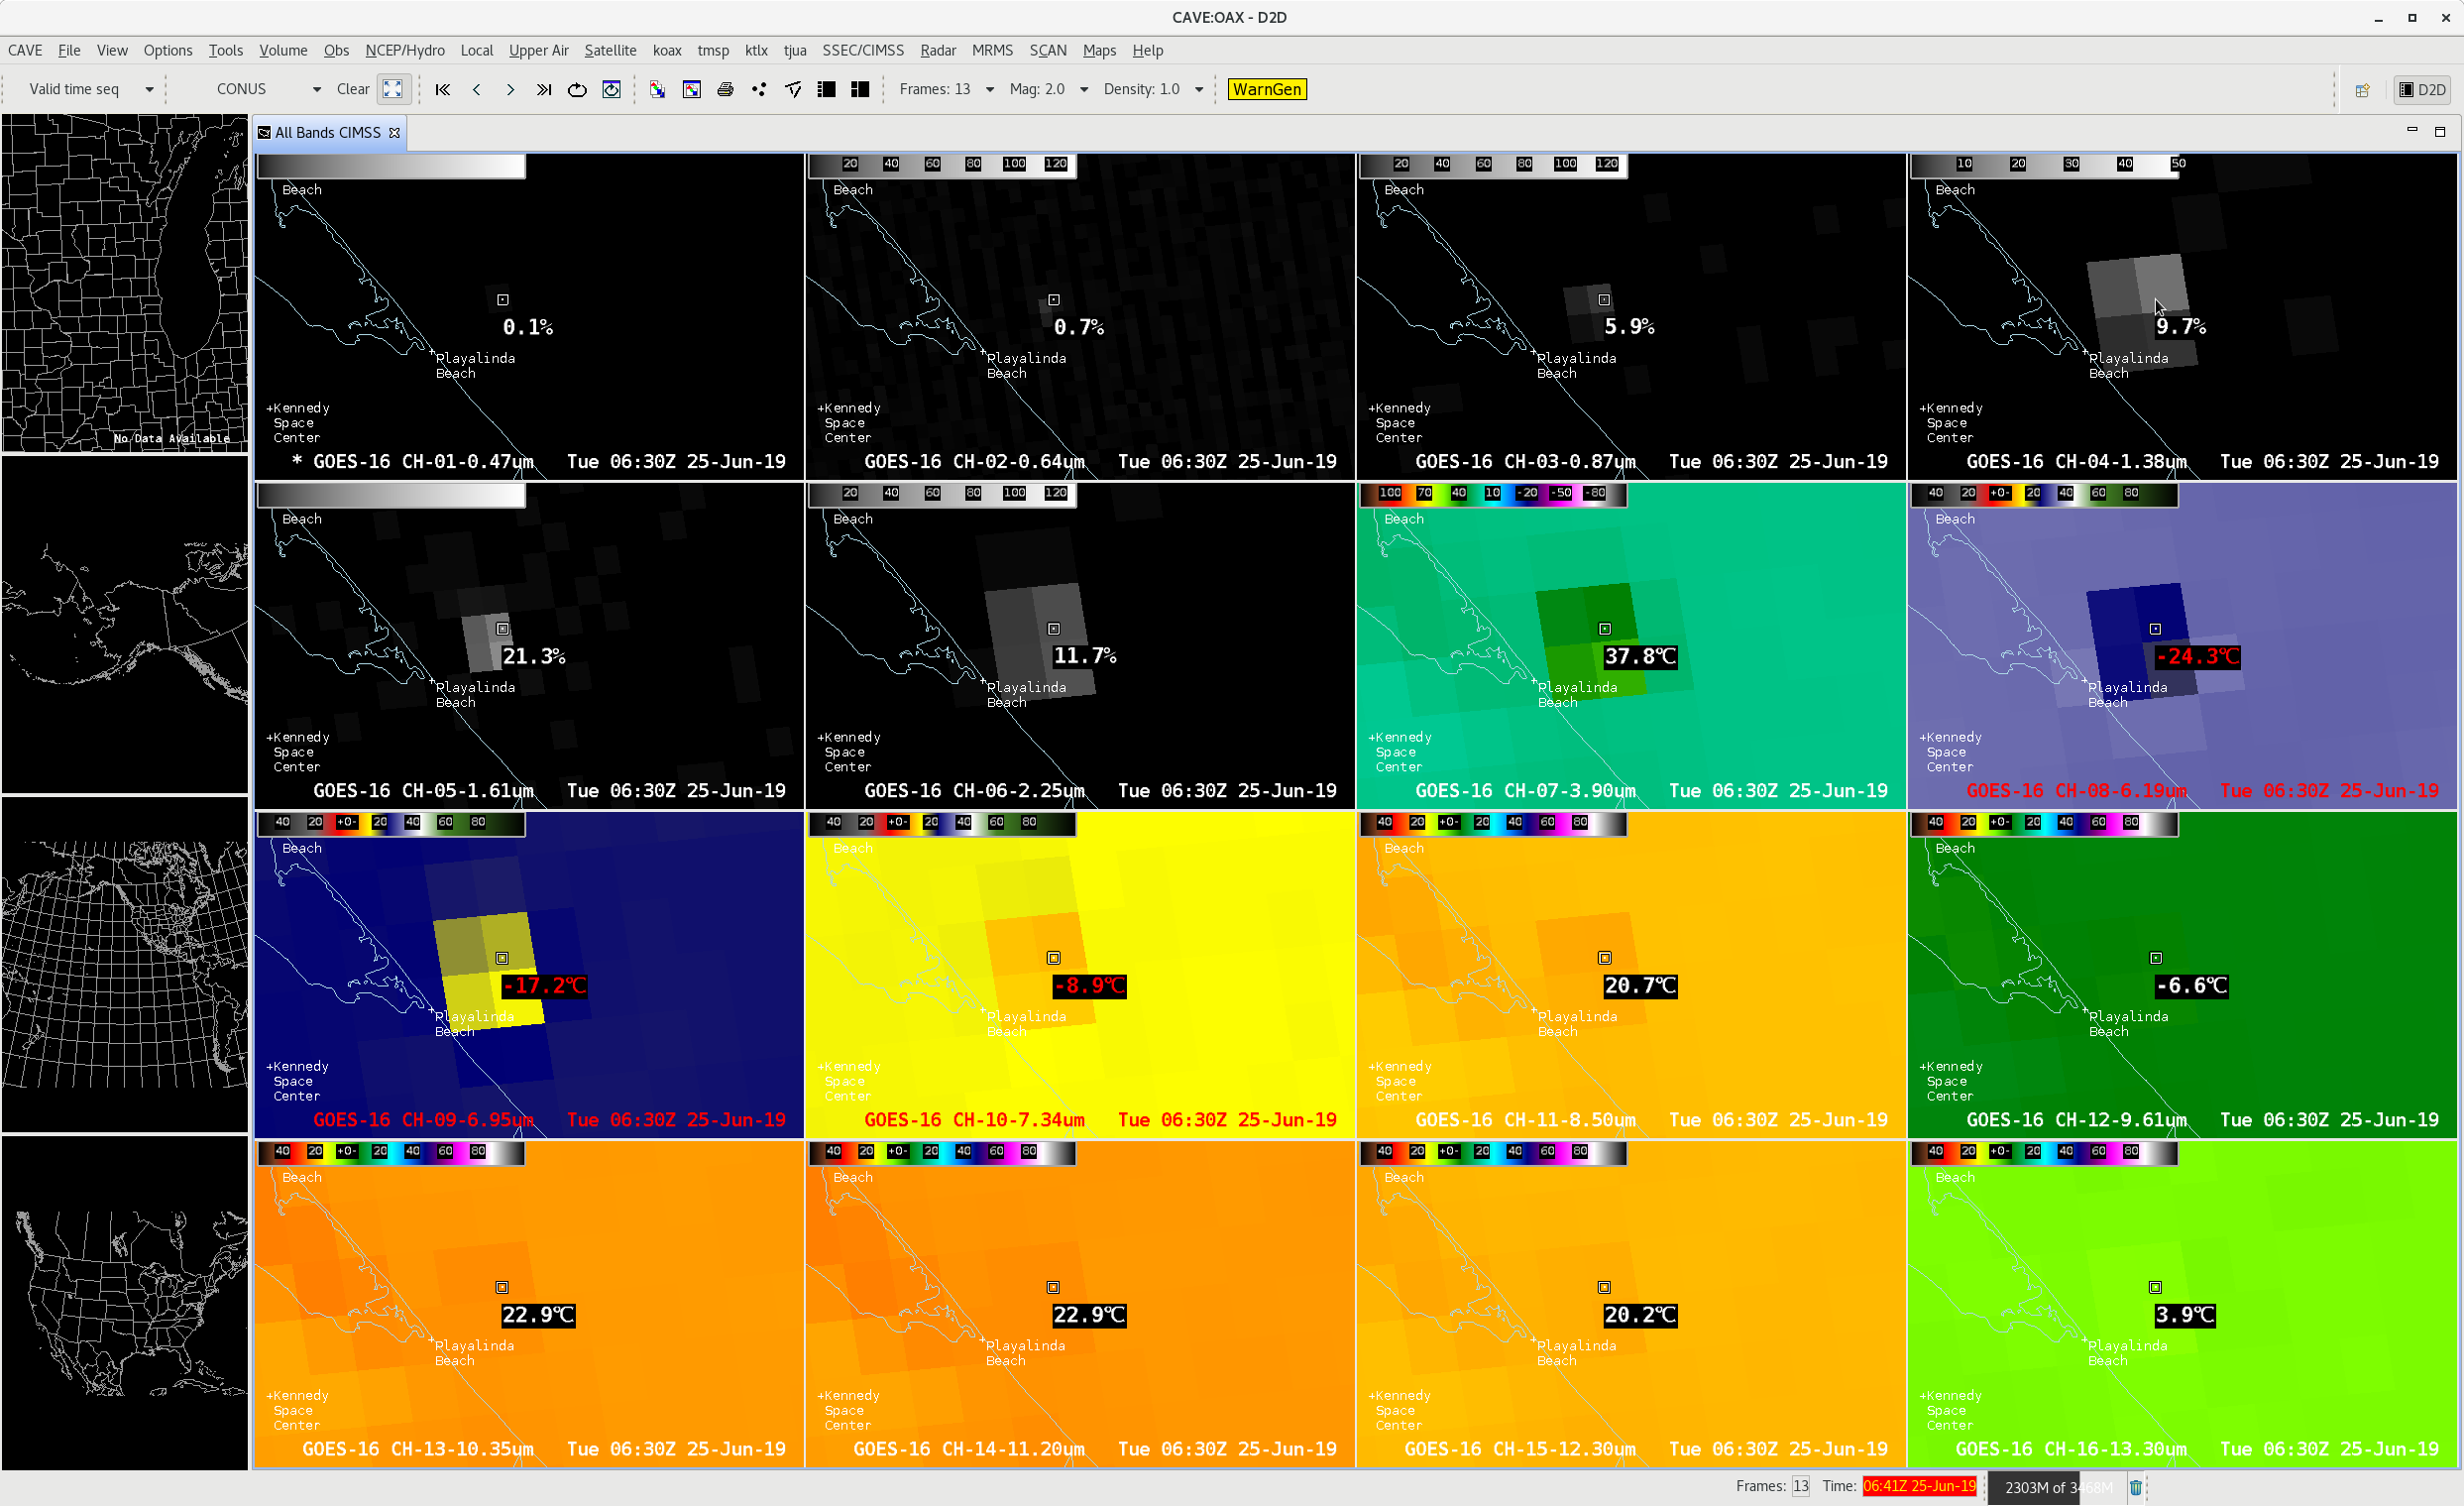
![16-panel images of all GOES-16 ABI spectral bands [click to enlarge]](https://cimss.ssec.wisc.edu/satellite-blog/wp-content/uploads/sites/5/2019/06/190625_goes16_spacex_launch_anim.gif)
![16-panel images of all GOES-16 ABI spectral bands at 0630 UTC [click to enlarge]](https://cimss.ssec.wisc.edu/satellite-blog/wp-content/uploads/sites/5/2019/06/190625_0630utc_goes16_spacex_launch.png)
![Himawari-8 False Color RGB images [click to play animation | MP4]](https://cimss.ssec.wisc.edu/satellite-blog/wp-content/uploads/sites/5/2019/06/190621_himawari8_so2_rgb_Raikoke_anim.gif)
![Water Vapor images from Himawari-8: Upper-level (6.2 µm, top), Mid-level (6.9 µm, middle) and Low-level (7.3 µm, bottom) [click to play animation | MP4]](https://cimss.ssec.wisc.edu/satellite-blog/wp-content/uploads/sites/5/2019/06/190621_himawari8_waterVapor_Raikoke_anim.gif)
![Water Vapor images from GOES-17: Upper-level (6.2 µm, top), Mid-level (6.9 µm, middle) and Low-level (7.3 µm, bottom) [click to play animation | MP4]](https://cimss.ssec.wisc.edu/satellite-blog/wp-content/uploads/sites/5/2019/06/190621_goes17_waterVapor_Raikoke_anim.gif)

![NSMC FY-2G Visible (0.73 µm) images [click to play animation | MP4]](https://cimss.ssec.wisc.edu/satellite-blog/wp-content/uploads/sites/5/2019/06/190621_fy2g_visible_Raikoke_anim.gif)

![GOES-17 SO2 RGB images [click to play animation | MP4]](https://cimss.ssec.wisc.edu/satellite-blog/wp-content/uploads/sites/5/2019/06/190624_goes17_so2_rgb_AK_anim.gif)
![GOES-17 SO2 RGB images [click to play animation | MP4]](https://cimss.ssec.wisc.edu/satellite-blog/wp-content/uploads/sites/5/2019/06/190625_goes17_so2_rgb_Raikoke_AK_anim.gif)
![GOES-13 Visible (0.63 µm) images [click to play animation | MP4]](https://cimss.ssec.wisc.edu/satellite-blog/wp-content/uploads/sites/5/2019/06/190621_goes13_visible_anim.gif)
![Images from all 5 spectral bands of the GOES-13 Imager [click to enlarge]](http://cimss.ssec.wisc.edu/goes/rt/jimn/testing/GOES13_6PL_2019173_121500_234500.gif)
![Water Vapor images from GOES-17, GOES-15, GOES-16 and GOES-13, all centered at Glasgow, Montana [click to play animation | MP4]](https://cimss.ssec.wisc.edu/satellite-blog/wp-content/uploads/sites/5/2019/06/190621_goes17_goes15_goes16_goes13_waterVapor_KGGW_anim.gif)
![All 5 spectral bands of the GOES-13 Imager [click to enlarge]](http://cimss.ssec.wisc.edu/goes/rt/jimn/testing/GOES13_6PL_2019176_001500_234500_1745BADNAV.gif)
![GOES-13 Visible (0.63 µm) images [click to play animation | MP4]](https://cimss.ssec.wisc.edu/satellite-blog/wp-content/uploads/sites/5/2019/06/VERDE_ISLANDS_POLI_loop_2019176_074500_2019176_191500.gif)
![GOES-13 Infrared Window (10.7 µm) and Visible (0.63 µm) images [click to play animation | MP4]](https://cimss.ssec.wisc.edu/satellite-blog/wp-content/uploads/sites/5/2019/06/190626_goes13_infrared_visible_rso_anim.gif)
