1-minute Mesoscale Domain Sector GOES-17 (GOES-West) “Red” Visible (0.64 µm) images (above) showed the development of thunderstorms over the far southern end of the Alaska Panhandle on 27 June 2019. These storms intensified as they moved southeastward toward the Misty Fjords area of Alaska (located east and southeast of Ketchikan PAKT) — and when... Read More
![GOES-17 “Red” Visible (0.64 µm) images [click to play animation | MP4]](https://cimss.ssec.wisc.edu/satellite-blog/wp-content/uploads/sites/5/2019/06/G17_VIS_PAKT_SVR_TSTM_27JUN2019_2019179_025033_GOES-17_0001PANEL.GIF)
GOES-17 “Red” Visible (0.64 µm) images [click to play animation | MP4]
1-minute
Mesoscale Domain Sector GOES-17
(GOES-West) “Red” Visible (
0.64 µm) images
(above) showed the development of thunderstorms over the far southern end of the Alaska Panhandle on 27 June 2019. These storms intensified as they moved southeastward toward the
Misty Fjords area of Alaska (located east and southeast of Ketchikan PAKT) — and when a significant lightning jump was noted with the strongest storm,
NWS Juneau issued their first-ever
Severe Thunderstorm Warning at 0249 UTC. A few thunderstorm overshooting tops could be seen in the visible images (for example, at
0230 UTC).
The Severe Thunderstorm Warning polygon is shown below.
![Severe Thunderstorm Warning polygon [click to enlarge]](https://cimss.ssec.wisc.edu/satellite-blog/wp-content/uploads/sites/5/2019/06/190627_pajk_severe_thunderstorm_warning.png)
Severe Thunderstorm Warning polygon [click to enlarge]
GOES-17 “Clean” Infrared Window (
10.35 µm) images
(below) revealed minimum cloud-top infrared brightness temperatures around -60ºC
(darker red enhancement).
GOES-17 “Clean” Infrared Window (10.35 µm) images [click to play animation | MP4]
A comparison of GOES-17 “Red” Visible (0.64 µm) images at 1-minute intervals with GOES-15 Visible (0.63 µm) images at 15-30-minute intervals
(below) helps to underscore the importance of 1-minute imagery for identifying and tracking the pulse-type of thunderstorms that developed on this day. Also evident is the brighter appearance of the GOES-17 Visible imagery — the
ABI instrument on the newer GOES-R Series benefits from on-orbit visible calibration, which mitigates the visible detector degradation that plagued the older GOES series.
GOES-17 “Red” Visible (0.64 µm, left) and GOES-15 Visible (0.63 µm, right) images [click to play animation | MP4]
Additional information about this severe thunderstorm event is available on a
FDTD GOES Applications Webinar.
On a side note, a larger-scale view of GOES-17 Visible imagery (below) showed a curious thin elongated feature moving southwestward from Yukon across the Alaska Panhandle to the Gulf of Alaska, which became more obvious later in the day as the lower sun angle increased forward scattering. This feature was casting a shadow onto the marine boundary layer stratus clouds over the Gulf of Alaska (0250 UTC image).
![GOES-17 “Red” Visible (0.64 µm) images [click to play animation | MP4]](https://cimss.ssec.wisc.edu/satellite-blog/wp-content/uploads/sites/5/2019/06/ak_vis-20190628_025033.png)
GOES-17 “Red” Visible (0.64 µm) images [click to play animation | MP4]
This feature was also apparent in GOES-17 Near-Infrared “Cirrus” (
1.38 µm) images
(below), since that spectral band excels at the detection of atmospheric particles that are efficient
scatterers of light
(such as cirrus ice crystals, dust, smoke and volcanic ash/sulfate). In fact, this was a streamer of high-altitude sulfate from the
Raikoke eruption on 21 June — and this thin volcanic filament could be unambiguously identified earlier in Cirrus imagery than in Visible imagery (for example, over Yukon at
1950 UTC, before forward scattering became large enough to aid identification at visible wavelengths).
![GOES-17 Near-Infrared “Cirrus” (1.38 µm) images [click to play animation | MP4]](https://cimss.ssec.wisc.edu/satellite-blog/wp-content/uploads/sites/5/2019/06/ak_cirrus-20190628_025033.png)
GOES-17 Near-Infrared “Cirrus” (1.38 µm) images [click to play animation | MP4]
View only this post
Read Less
![GOES-17 True Color RGB images [click to play animation | MP4]](https://cimss.ssec.wisc.edu/satellite-blog/wp-content/uploads/sites/5/2019/07/190702_goes17_truecolor_SH_eclipse_anim.gif)
![GOES-16 True Color RGB images [click to play animation | MP4]](https://cimss.ssec.wisc.edu/satellite-blog/wp-content/uploads/sites/5/2019/07/190702_goes16_truecolor_SH_eclipse_anim.gif)
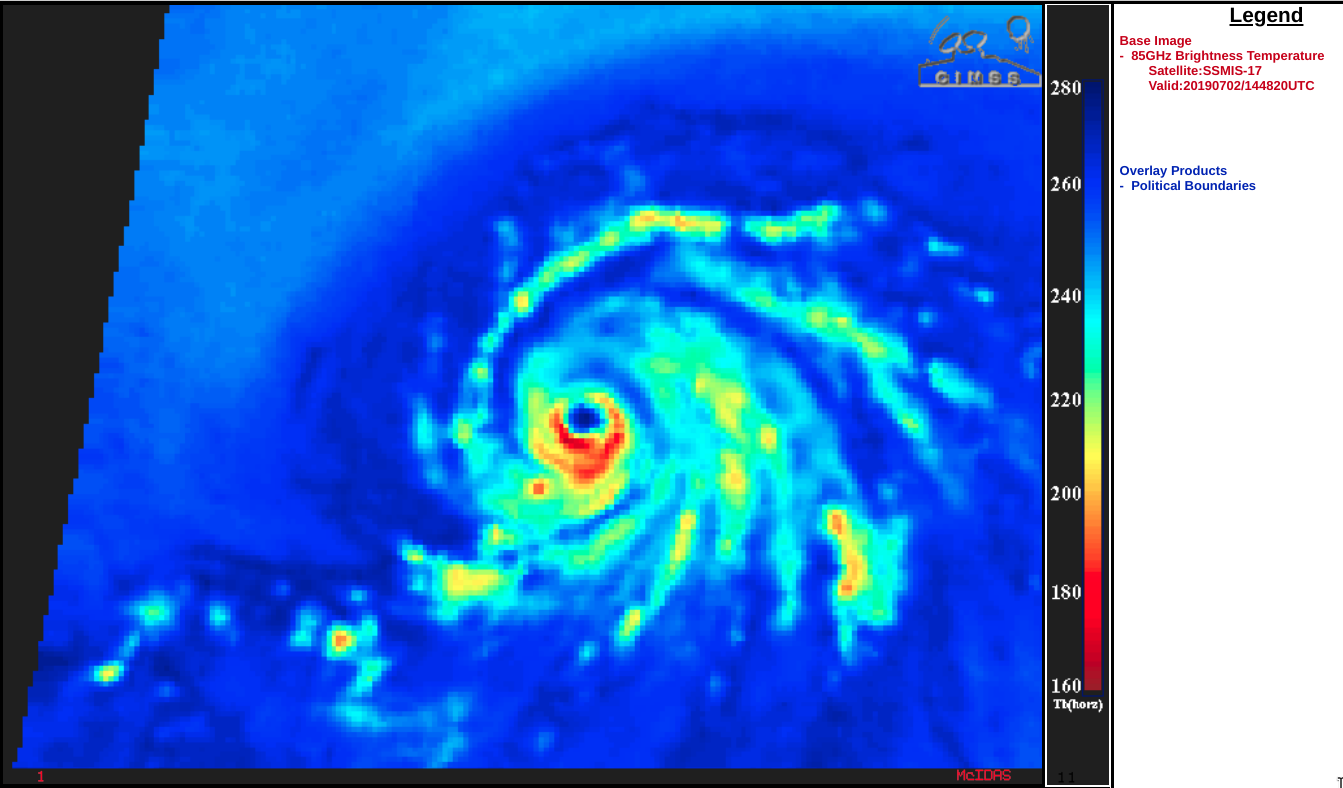

![DMSP-17 SSMIS Microwave (85 GHz) image [click to enlarge]](https://cimss.ssec.wisc.edu/satellite-blog/wp-content/uploads/sites/5/2019/07/190702_1448utc_dmsp17_ssmis_Barbara.png)
![GOES-17 "Red" Visible (0.64 µm, top) and "Clean" Infrared Window (10.3 µm, bottom) images [click to play animation | MP4]](https://cimss.ssec.wisc.edu/satellite-blog/wp-content/uploads/sites/5/2019/07/190703_goes17_visible_infrared_Hurricane_Barbara_anim.gif)

![GOES-17 “Red” Visible (0.64 µm) images [click to play animation | MP4]](https://cimss.ssec.wisc.edu/satellite-blog/wp-content/uploads/sites/5/2019/06/190627_goes17_visible_Juneau_AK_anim.gif)


![GOES-17 “Red” Visible (0.64 µm) images [click to play animation | MP4]](https://cimss.ssec.wisc.edu/satellite-blog/wp-content/uploads/sites/5/2019/06/190627_goes17_visible_AK_anim.gif)
![GOES-17 Near-Infrared “Cirrus” (1.38 µm) images [click to play animation | MP4]](https://cimss.ssec.wisc.edu/satellite-blog/wp-content/uploads/sites/5/2019/06/190627_goes17_cirrus_AK_anim.gif)
