![GOES-17 "Red Visible (0.64 µm) images [click to play animation | MP4]](https://cimss.ssec.wisc.edu/satellite-blog/wp-content/uploads/sites/5/2019/07/190710_goes17_visible_Baja_HBT_Flush_anim.gif)
GOES-17 “Red Visible (0.64 µm) images [click to play animation | MP4]
![GOES-17 Shortwave Infrared (3.9 µm) images [click to play animation | MP4]](https://cimss.ssec.wisc.edu/satellite-blog/wp-content/uploads/sites/5/2019/07/190710_goes17_shortwaveInfrared_AK_HBT_Flush_anim.gif)
GOES-17 Shortwave Infrared (3.9 µm) images [click to play animation | MP4]
View only this post Read Less
Approximately once every 239 days, a HBT (Hydrazine Bipropellant Thruster) Flush is performed on GOES-R series satellites — this flushing burn limits the build-up of ferric nitrate in the HBT valves. Following a GOES-17 (GOES-West) HBT Flush that was conducted on 10 July 2019, a navigation offset of about 145... Read More
GOES-17 “Red Visible (0.64 µm) images [click to play animation | MP4]
GOES-17 Shortwave Infrared (3.9 µm) images [click to play animation | MP4]
View only this post Read Less
GOES-16 (GOES-East) “Red” Visible (0.64 µm) images (above) showed narrow ribbons of fog over the northwestern portion of Lake Superior on 08 July 2019. A person attempting to navigate from Grand Portage, Minnesota — located northeast of Grand Marais Airport, identifier KCKC — to Isle Royale became lost in the fog and eventually... Read More
GOES-16 “Red” Visible (0.64 µm) images [click to play animation | MP4]
Possibly compounding the fog-related visibility problem, GOES-16 Natural Color Red-Green-Blue (RGB) images (below) revealed that dense smoke from Canadian wildfires was lingering and also recirculating slowly northward across Lake Superior; this smoke occasionally reduced the surface visibility to 4 miles at Houghton, Michigan (identifier KCMX).
![GOES-16 Natural Color RGB images [click to play animation | MP4]](https://cimss.ssec.wisc.edu/satellite-blog/wp-content/uploads/sites/5/2019/07/190708_goes16_naturalcolor_Lake_Superior_anim.gif)
GOES-16 Natural Color RGB images [click to play animation | MP4]
View only this post Read Less
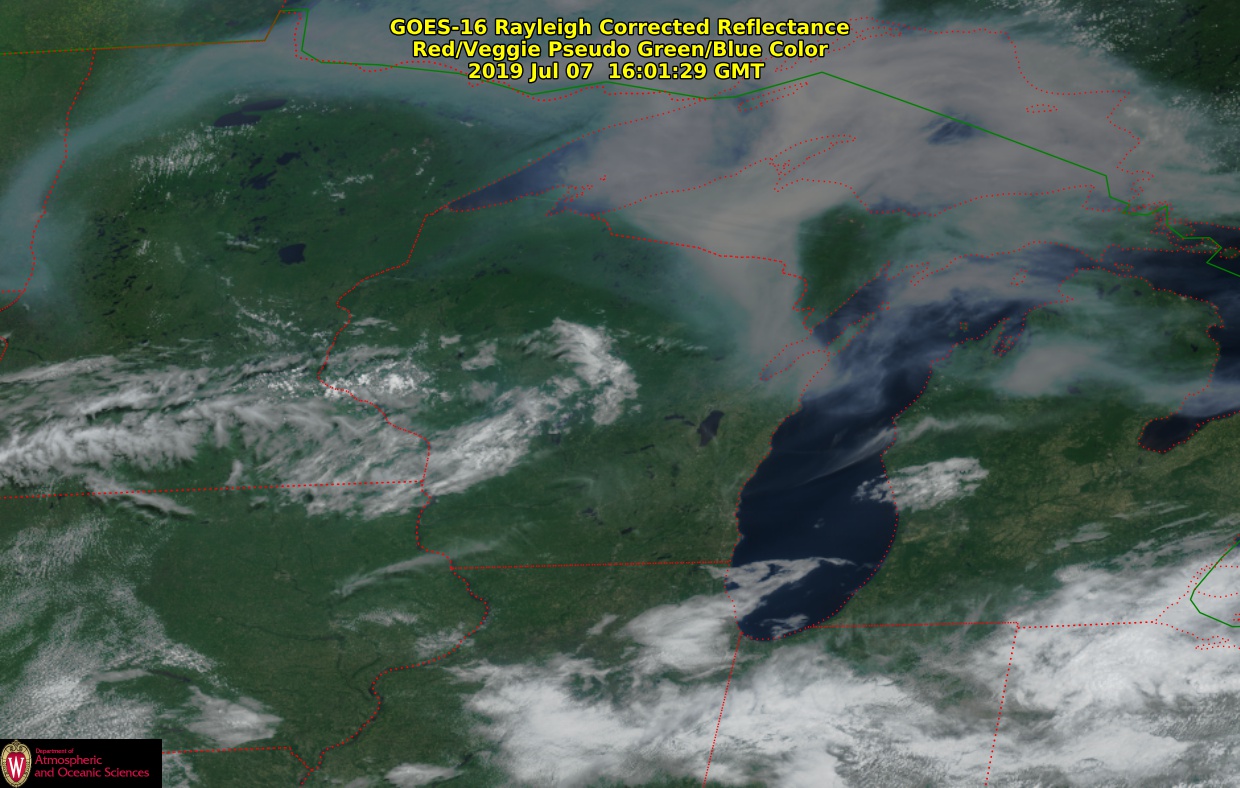
GOES-16 (GOES-East) True Color Red-Green-Blue (RGB) images from the AOS site (above) showed the signature of dense smoke from Canadian wildfires that was being transported southward across parts of the Upper Midwest on 06 July 2019. While much of the smoke remained aloft, some of it was reaching the surface... Read More
![GOES-16 True Color RGB images [click to play animation | MP4]](https://cimss.ssec.wisc.edu/satellite-blog/wp-content/uploads/sites/5/2019/07/190706_goes16_truecolor_Upper_Midwest_anim.gif)
GOES-16 True Color RGB images [click to play animation | MP4]
On the following day, the smoke settled farther southward over Wisconsin and Michigan (below). Much of the smoke again remained aloft, but continued to persist within the boundary layer at Baudette and International Falls — and it did briefly restrict the surface visibility at Green Bay in northeastern Wisconsin.
![GOES-16 True Color RGB images [click to play animation | MP4]](https://cimss.ssec.wisc.edu/satellite-blog/wp-content/uploads/sites/5/2019/07/190707_goes16_truecolor_Upper_Midwest_smoke_anim.gif)
GOES-16 True Color RGB images [click to play animation | MP4]
===== 08 July Update =====
![GOES-16 True Color RGB images [click to play animation | MP4]](https://cimss.ssec.wisc.edu/satellite-blog/wp-content/uploads/sites/5/2019/07/190708_goes16_truecolor_Great_Lakes_smoke_anim.gif)
GOES-16 True Color RGB images [click to play animation | MP4]
===== 09 July Update =====
![GOES-16 True Color RGB images [click to play animation | MP4]](https://cimss.ssec.wisc.edu/satellite-blog/wp-content/uploads/sites/5/2019/07/190709_goes16_truecolor_Great_Lakes_anim.gif)
GOES-16 True Color RGB images [click to play animation | MP4]
![Suomi NPP VIIRS True Color RGB image [click to enlarge]](https://cimss.ssec.wisc.edu/satellite-blog/wp-content/uploads/sites/5/2019/07/190709_suomiNPP_viirs_truecolor_Mid-Atlantic_smoke.png)
Suomi NPP VIIRS True Color RGB image [click to enlarge]
View only this post Read Less
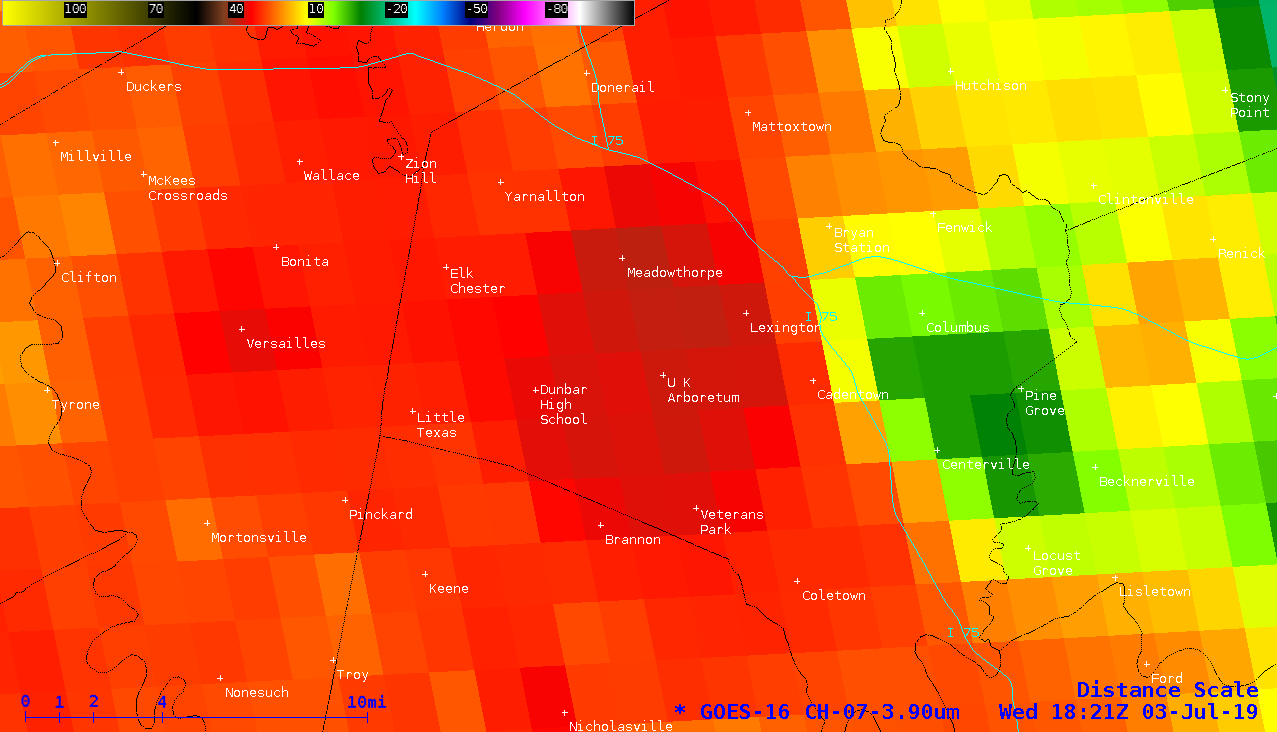
GOES-16 (GOES-East) Near-Infrared “Snow/Ice” (1.61 µm), Near-Infrared “Cloud Particle Size” (2.24 µm) and Shortwave Infrared (3.9 µm) images (above) revealed nighttime thermal signatures of a fire at a Jim Beam bourbon warehouse in Versailles, Kentucky on 03 July 2019. The fire reportedly began to burn around 0330 UTC (11:30 PM... Read More

GOES-16 Near-Infrared “Snow/Ice” (1.61 µm, left), Near-Infrared “Cloud Particle Size” (2.24 µm, center) and Shortwave Infrared (3.9 µm, right) images – GLM Groups are plotted in red on the 3.9 µm images [click to play animation | MP4]
The nighttime thermal signatures seen on near-infrared 1.61 µm and 2.24 µm images (brighter white pixels) result from the fact that those two ABI spectral bands are located close to the peak emitted radiance of very hot features such as volcanic eruptions or large fires (below).
![Plots of Spectral Response Functions for ABI Bands 5, 6 and 7 [click to enlarge]](https://cimss.ssec.wisc.edu/satellite-blog/wp-content/uploads/sites/5/2018/08/ABI_Band_5_6_7_Spectral_Response_Functions_Fires.png)
Plots of Spectral Response Functions for ABI Bands 5, 6 and 7 [click to enlarge]
![GOES-16 Shortwave Infrared (3.9 µm) images [click to play animation]](https://cimss.ssec.wisc.edu/satellite-blog/wp-content/uploads/sites/5/2019/07/190703_goes16_shortwaveInfrared_KY_anim.gif)
GOES-16 Shortwave Infrared (3.9 µm) images [click to play animation]
View only this post Read Less
