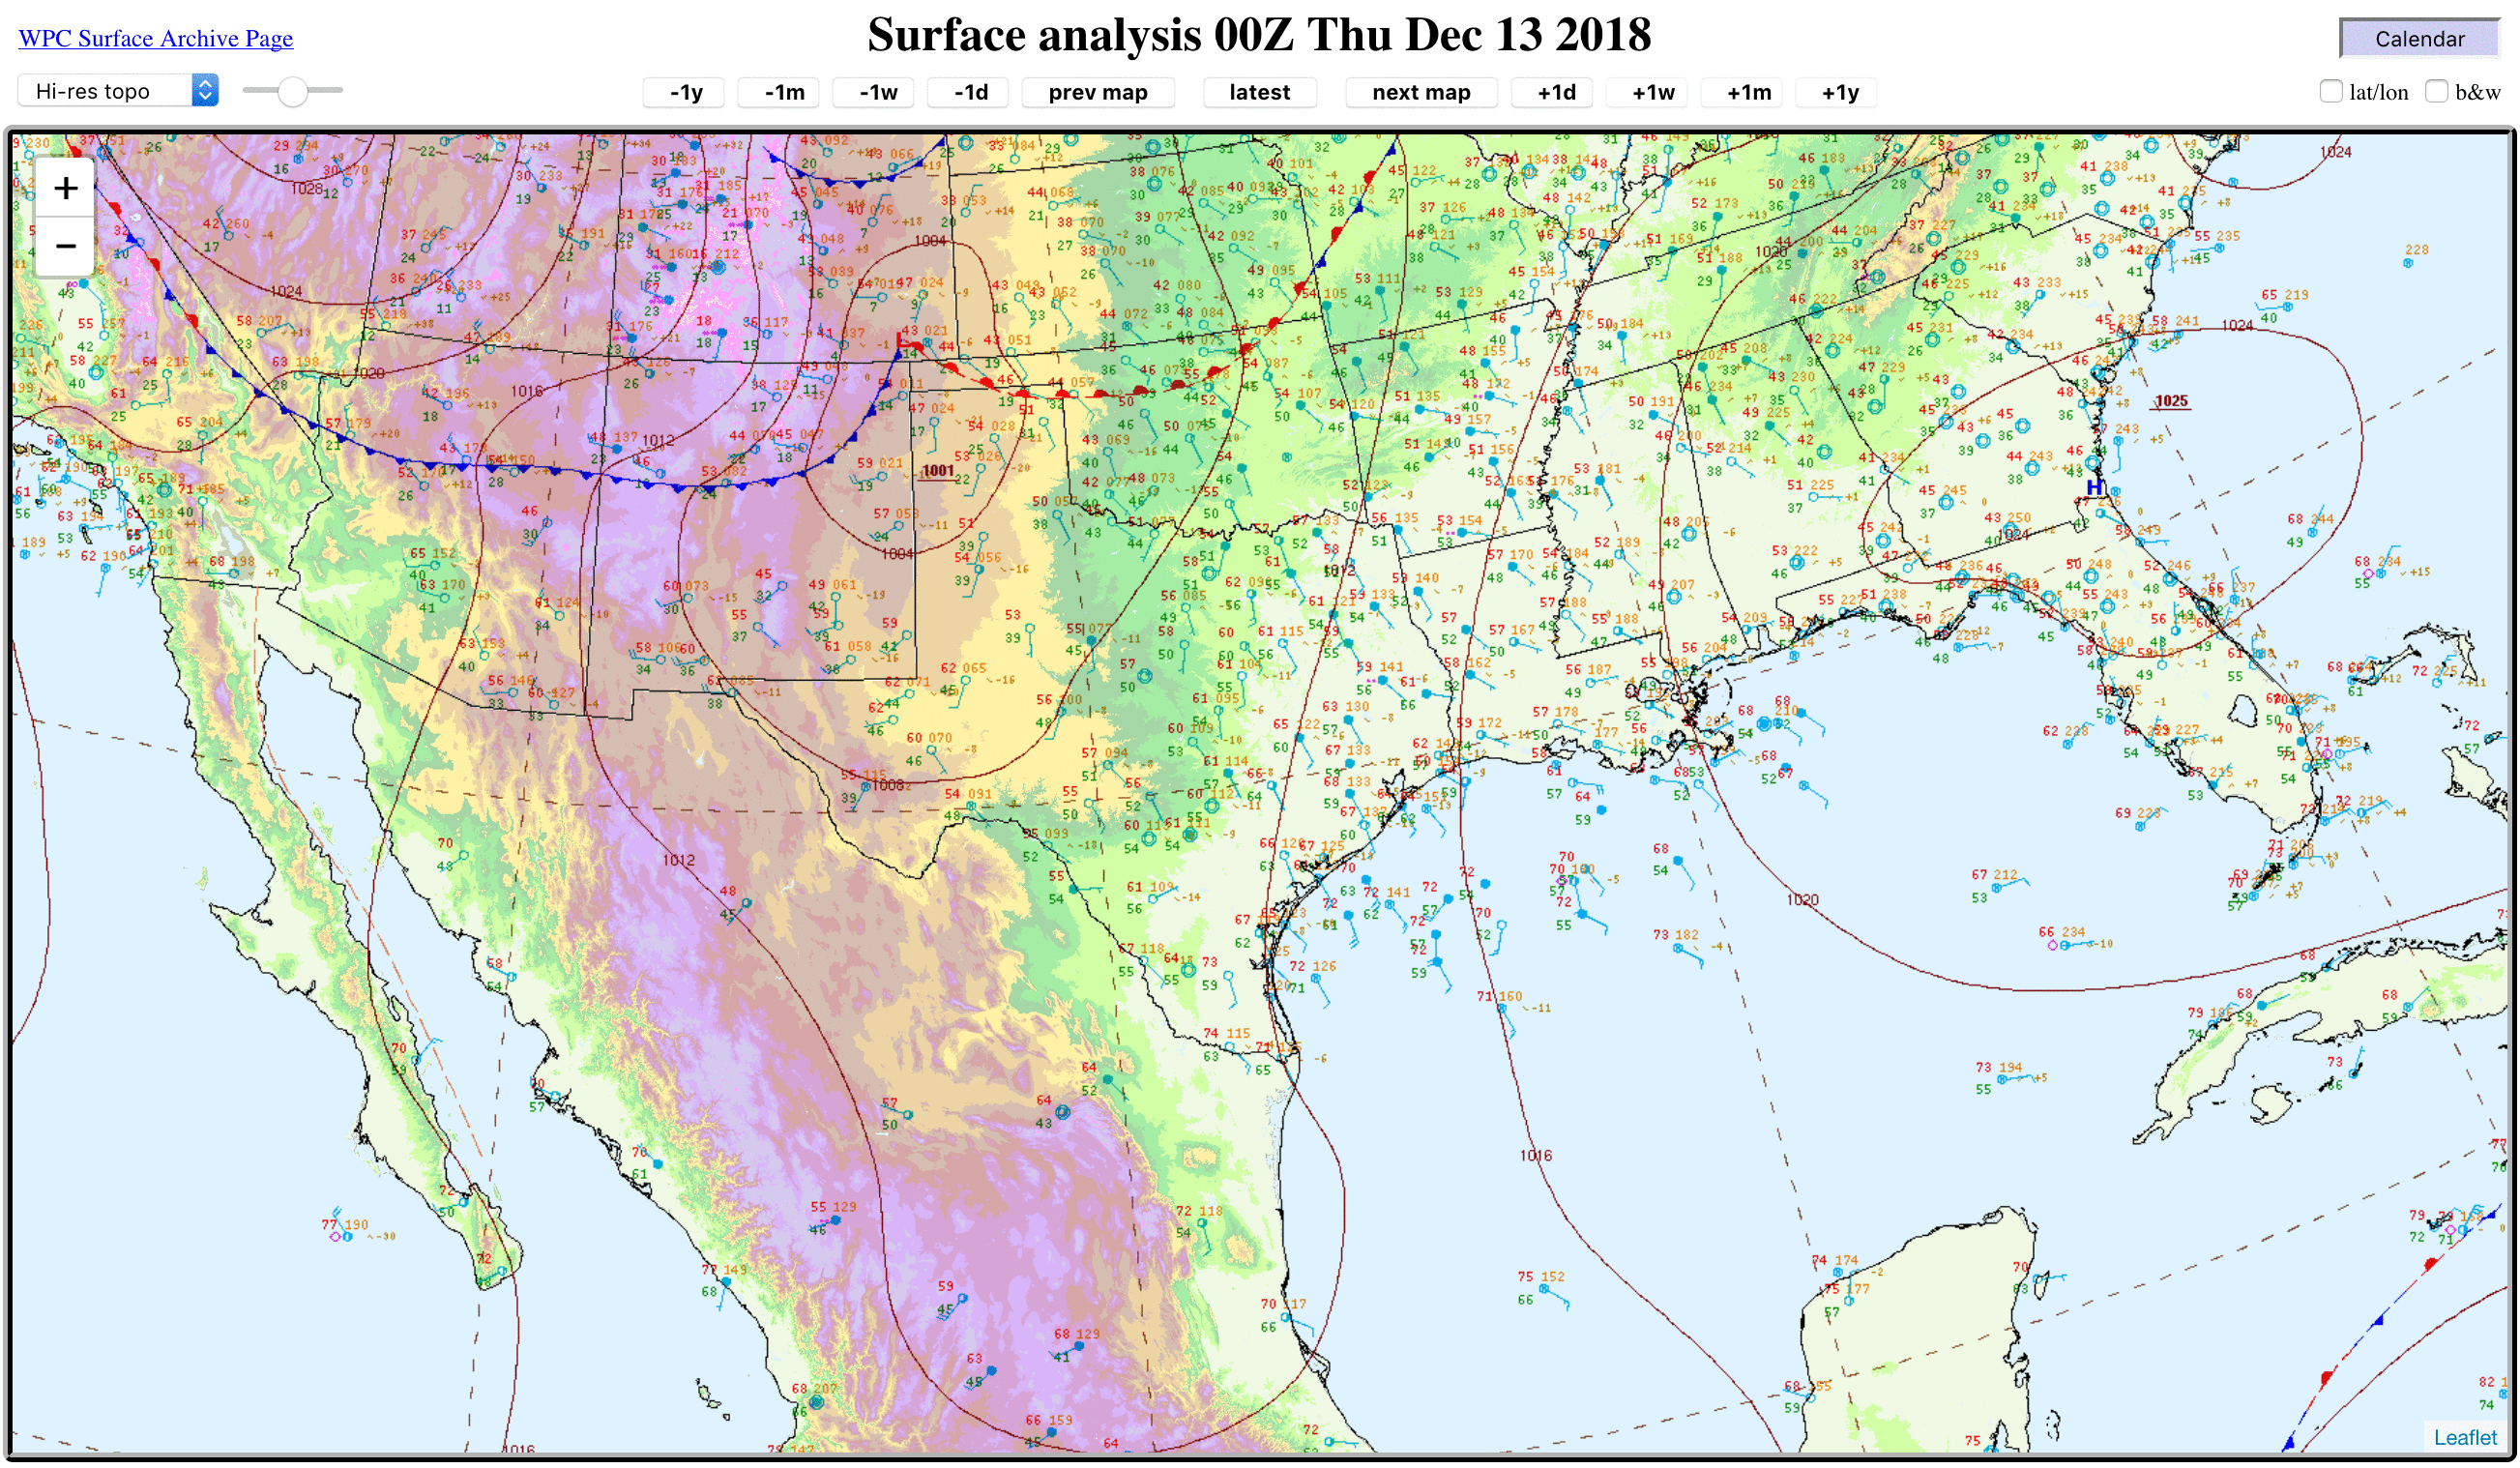
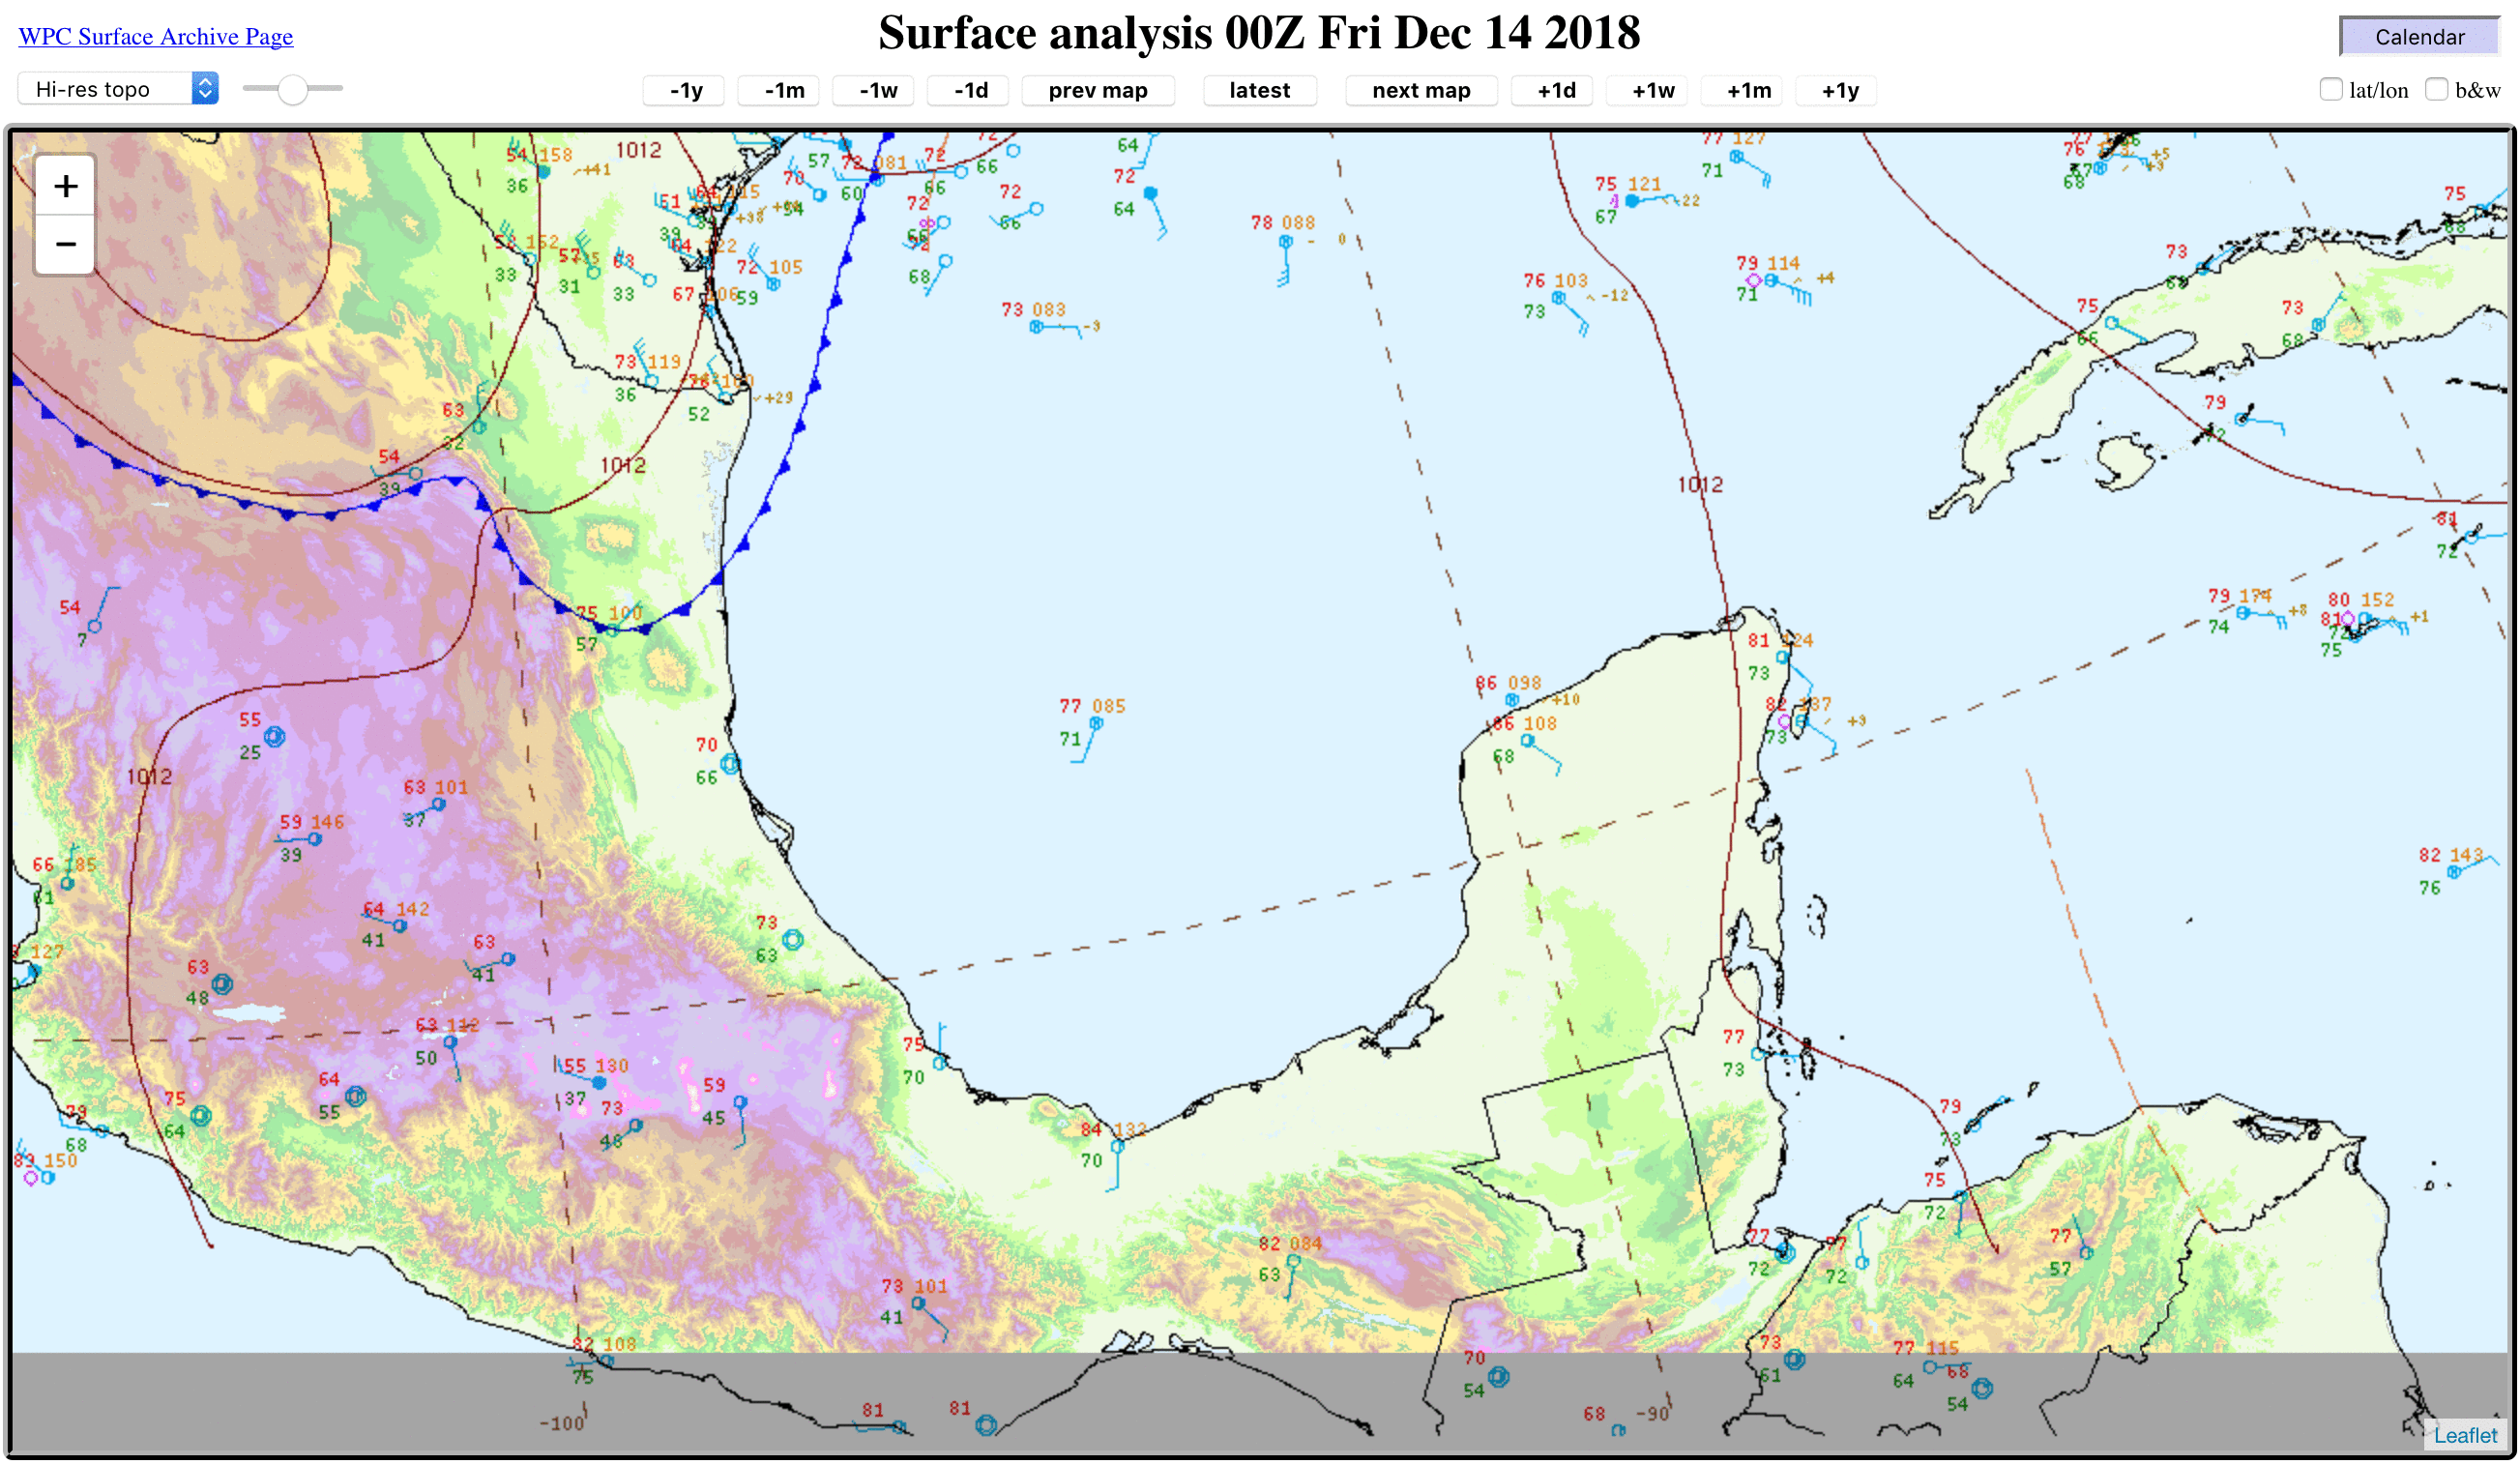
Southern US storm, and a Tehuano wind event
![GOES-16 Low-level Water Vapor (7.3 µm) images, 13-15 December [click to play MP4 animation]](https://cimss.ssec.wisc.edu/satellite-blog/wp-content/uploads/sites/5/2018/12/G16_WV_SOUTHERN_US_STORM_13_15DEC2018_2018348_150217_GOES-16_0001PANEL.GIF)
GOES-16 Low-level Water Vapor (7.3 µm) images, 13-15 December [click to play MP4 animation]
The corresponding GOES-16 Water Vapor images with plots of hourly surface wind gusts are shown below; peak wind gusts exceeding 50 knots occurred in parts of Colorado, New Mexico and Texas on 13 December.
![GOES-16 Low-level Water Vapor (7.3 µm) images with hourly plots of surface wind gusts, 13-15 December [click to play MP4 animation]](https://cimss.ssec.wisc.edu/satellite-blog/wp-content/uploads/sites/5/2018/12/G16_WV_GUSTS_SOUTHERN_US_STORM_13_15DEC2018_2018348_150217_GOES-16_0001PANEL.GIF)
GOES-16 Low-level Water Vapor (7.3 µm) images with hourly plots of surface wind gusts in knots, 13-15 December [click to play MP4 animation]
Fun fact: Our office has only issued 4 ‘High Wind Warnings’ over the past 30 years, including today’s. Our last ‘High Wind Warning’ was issued February 25, 2013 for Zapata, Jim Hogg, Starr, and Brooks Counties. #funfact #txwx #NWSBrownsville
— NWS Brownsville (@NWSBrownsville) December 13, 2018
Another notable aspect of this storm was a very localized area of heavy snowfall just south of Sweetwater, Texas:
Here are the observed snow totals from Thursday afternoon through Friday morning. Highest snow amounts occurred in #NolanCounty, where generally 3-8 inches fell. #Blackwell #txwx #sjtwx pic.twitter.com/2EBzbtCgnz
— NWS San Angelo (@NWSSanAngelo) December 14, 2018
The remnant patch of snow cover was evident in VIIRS Visible (0.64 µm) and Near-Infrared “Snow/Ice” (1.61 µm) imagery on 14 and 15 December (below). The heaviest snowfall occurred over an isolated ridge along the eastern edge of the Edwards Plateau, where elevations of 2500-2600 feet were about 500 feet higher than the adjacent rolling plains. Since snow is a very effective absorber of energy at the 1.61 µm wavelength, it appeared dark on the Snow/Ice imagery.
![Topography, Suomi NPP VIIRS Visible (0.64 µm) and Near-Infrared "Snow/Ice" (1.61 µm) images on 14 December [click to enlarge]](https://cimss.ssec.wisc.edu/satellite-blog/wp-content/uploads/sites/5/2018/12/181214_1917utc_suomiNPP_viirs_visible_snowIce_topography_TX_snowcover_anim.gif)
Topography plus Suomi NPP VIIRS Visible (0.64 µm) and Near-Infrared “Snow/Ice” (1.61 µm) images on 14 December [click to enlarge]
![Topography plus NOAA-20 VIIRS Visible (0.64 µm) and Near-Infrared "Snow/Ice" (1.61 µm) images on 15 December [click to enlarge]](https://cimss.ssec.wisc.edu/satellite-blog/wp-content/uploads/sites/5/2018/12/181215_1858utc_noaa20_viirs_visible_snowIce_topography_TX_snowcover_anim.gif)
Topography plus NOAA-20 VIIRS Visible (0.64 µm) and Near-Infrared “Snow/Ice” (1.61 µm) images on 15 December [click to enlarge]
![Terra/Aqua MODIS True Color and False Color images on 14 December [click to enlarge]](https://cimss.ssec.wisc.edu/satellite-blog/wp-content/uploads/sites/5/2018/12/181214_terra_aqua_modis_truecolor_falsecolor_TX_snowcover_anim.gif)
Terra/Aqua MODIS True Color and False Color images on 14 December [click to enlarge]
![Terra MODIS True Color RGB images on 14 and 15 December [click to enlarge]](https://cimss.ssec.wisc.edu/satellite-blog/wp-content/uploads/sites/5/2018/12/181214_181215_terra_modis_truecolor_TX_snowcover_anim.gif)
Terra MODIS True Color RGB images on 14 and 15 December [click to enlarge]
* GOES-17 images shown here are preliminary and non-operational *
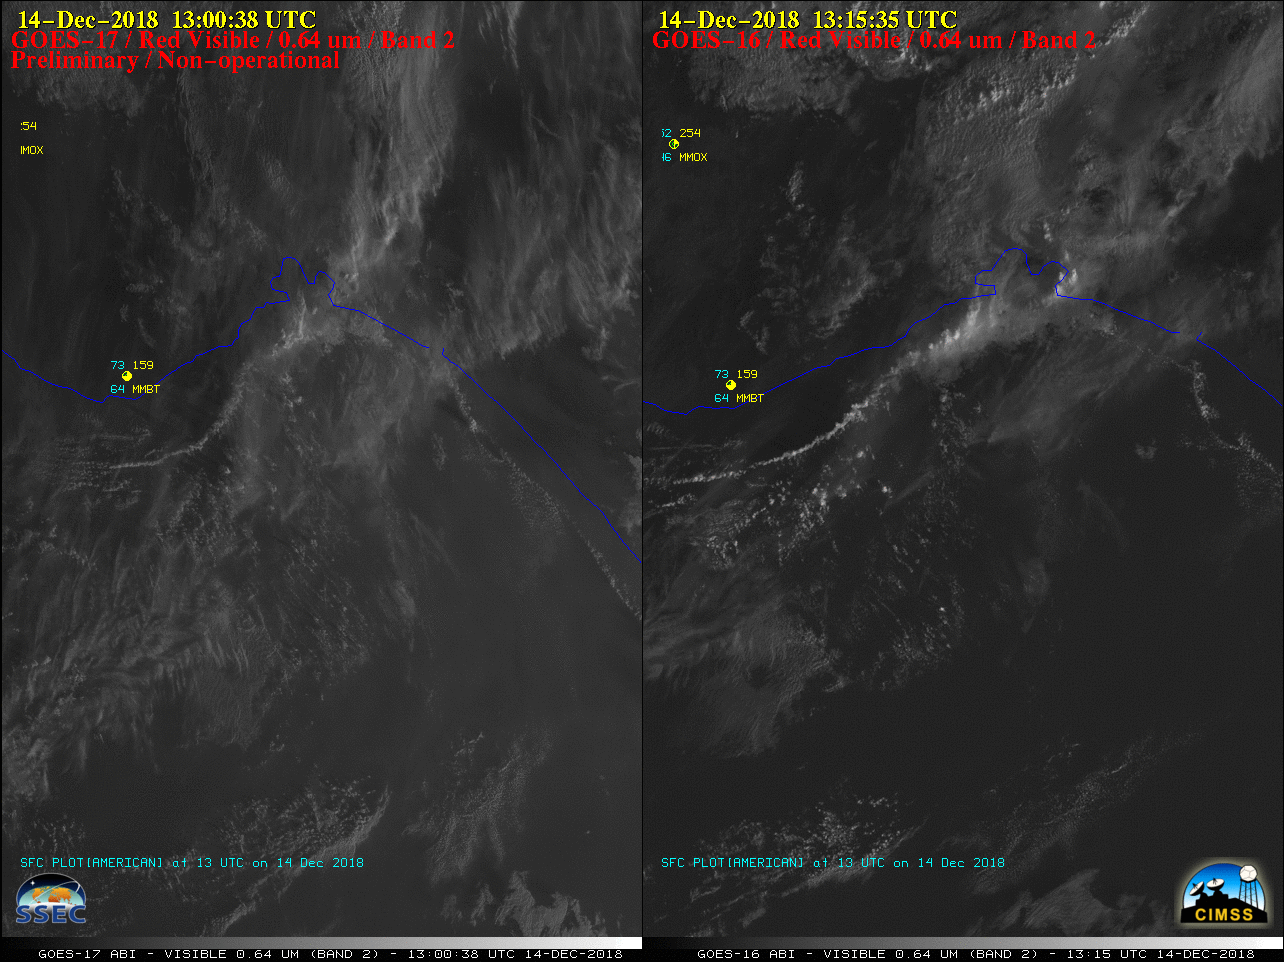
GOES-17 (left) and GOES-16 (right) “Red” Visible (0.64 µm) images [click to play animation | MP4]
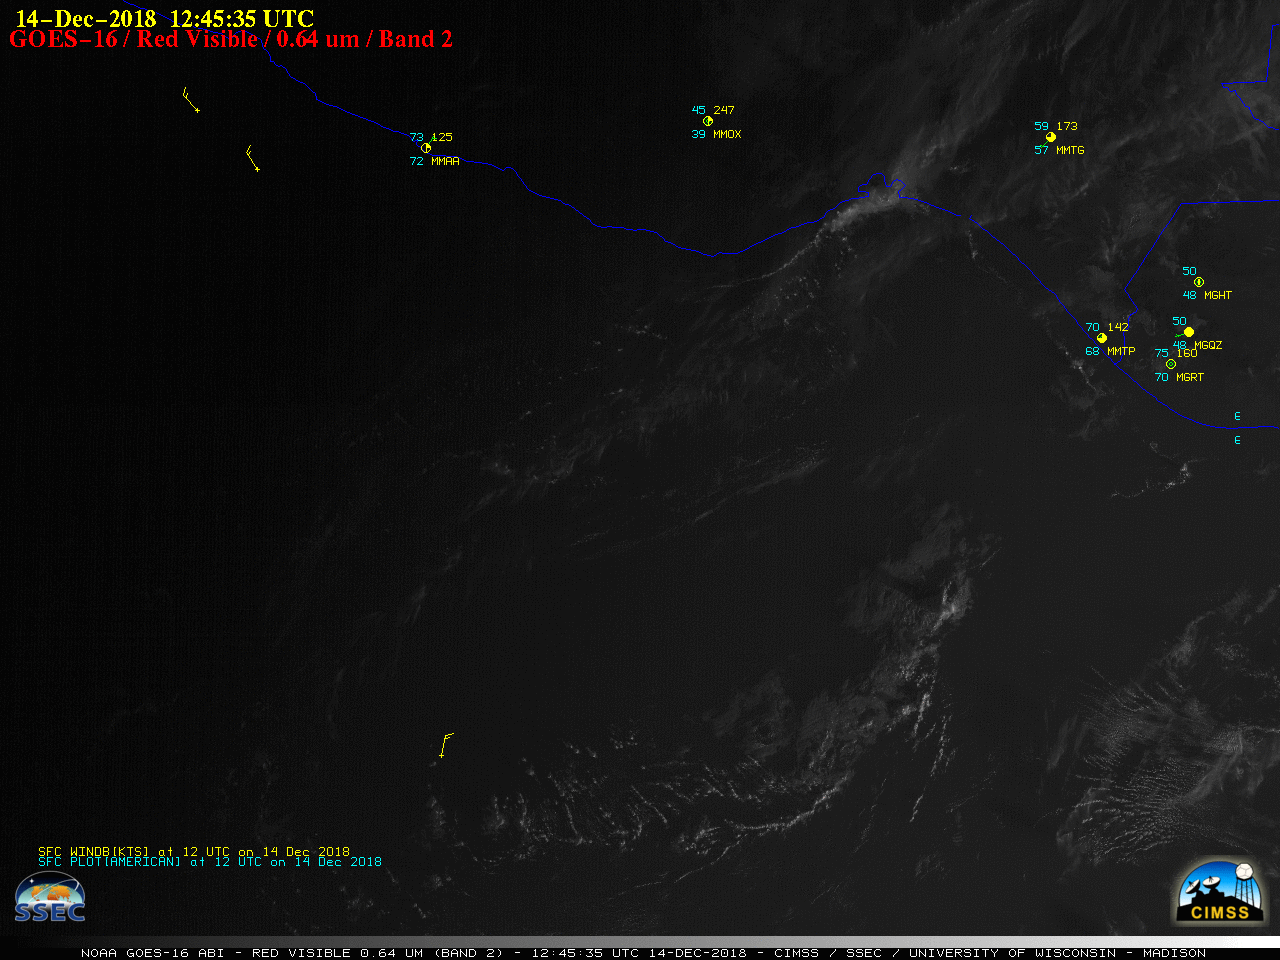
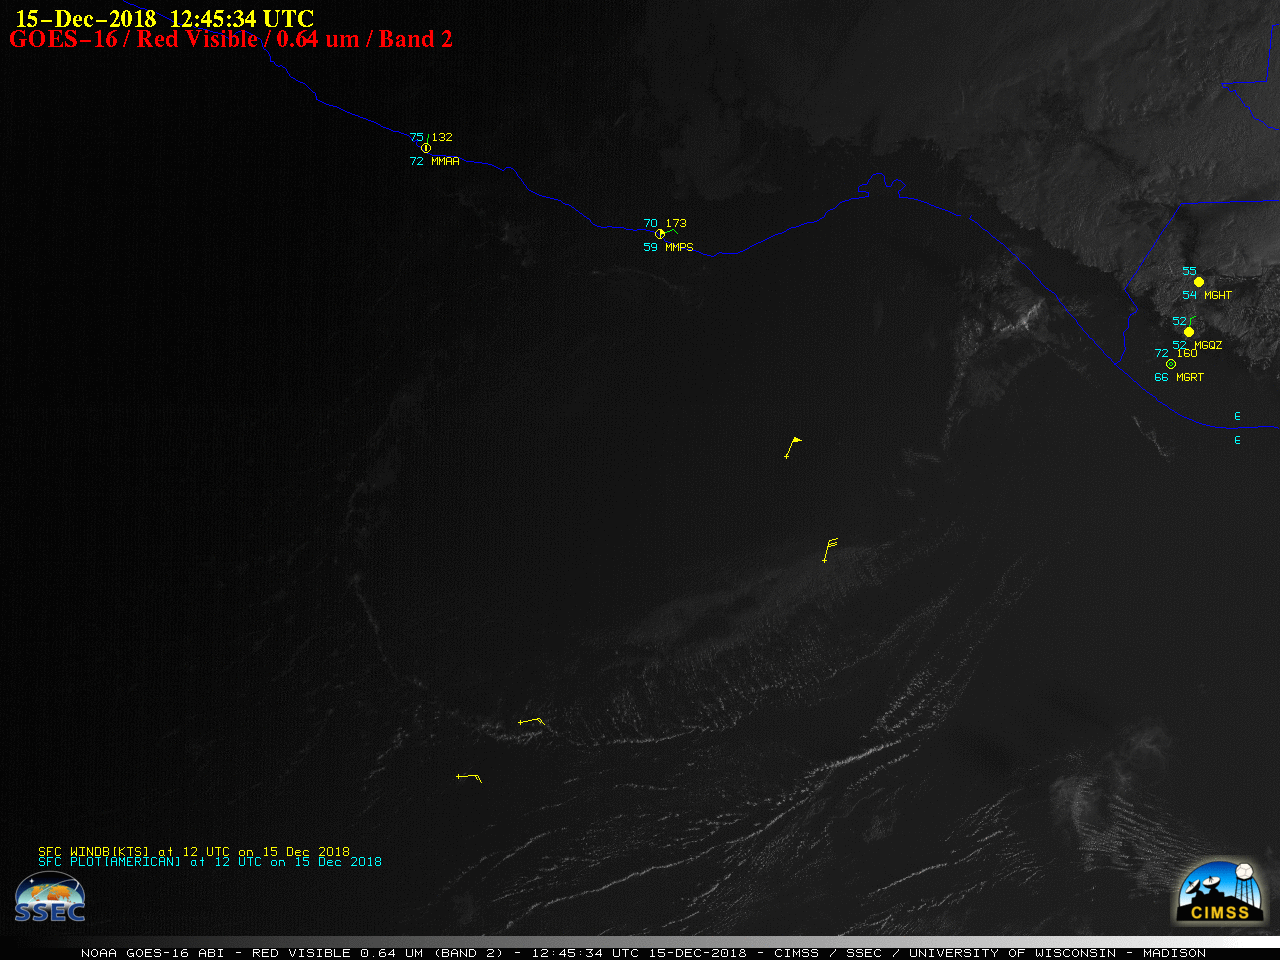
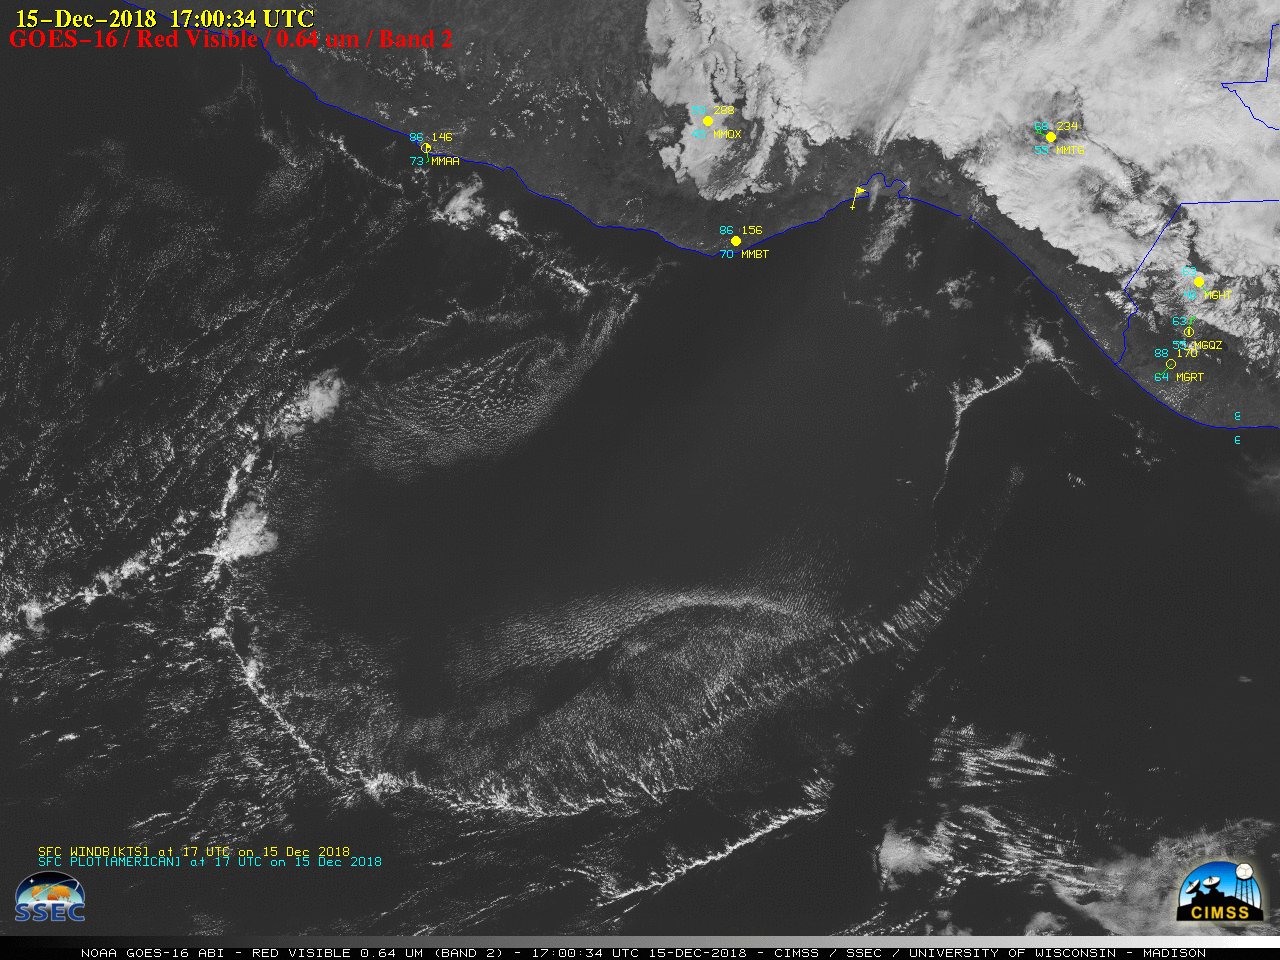
GOES-16 “Red” Visible (0.64 µm) images with surface and ship reports, 14-15 December [click to play animation | MP4]
![NOAA-20 VIIRS True Color and Infrared Window (11.45 µm) images on 14 and 15 December [click to enlarge]](https://cimss.ssec.wisc.edu/satellite-blog/wp-content/uploads/sites/5/2018/12/181214_181215_noaa20_viirs_truecolor_infrared_Tehuano_anim.gif)
NOAA-20 VIIRS True Color RGB and Infrared Window (11.45 µm) images on 14 and 15 December [click to enlarge]
![Metop-A and Metop-B ASCAT surface scatterometer winds across the western Gulf of Mexico [click to enlarge]](https://cimss.ssec.wisc.edu/satellite-blog/wp-content/uploads/sites/5/2018/12/181214_metop_ascat_Gulf_of_Mexico_anim.gif)
Metop-A and Metop-B ASCAT surface scatterometer winds across the western Gulf of Mexico [click to enlarge]
![Metop-A and Metop-B ASCAT surface scatterometer winds across the southern Gulf of Mexico and the Gulf of Tehuantepec [click to enlarge]](https://cimss.ssec.wisc.edu/satellite-blog/wp-content/uploads/sites/5/2018/12/181214_metop_ascat_Tehuano_anim.gif)
Metop-A and Metop-B ASCAT surface scatterometer winds across the far southern Gulf of Mexico and the Gulf of Tehuantepec [click to enlarge]
![MIMIC Total Precipitable Water product (Total column, and Surface-850 hPa layer) [click to play animation]](https://cimss.ssec.wisc.edu/satellite-blog/wp-content/uploads/sites/5/2018/12/181214_181215_mtpw_sfc850_anim.gif)
MIMIC Total Precipitable Water product (Total column, and Surface-850 hPa layer) [click to play animation]