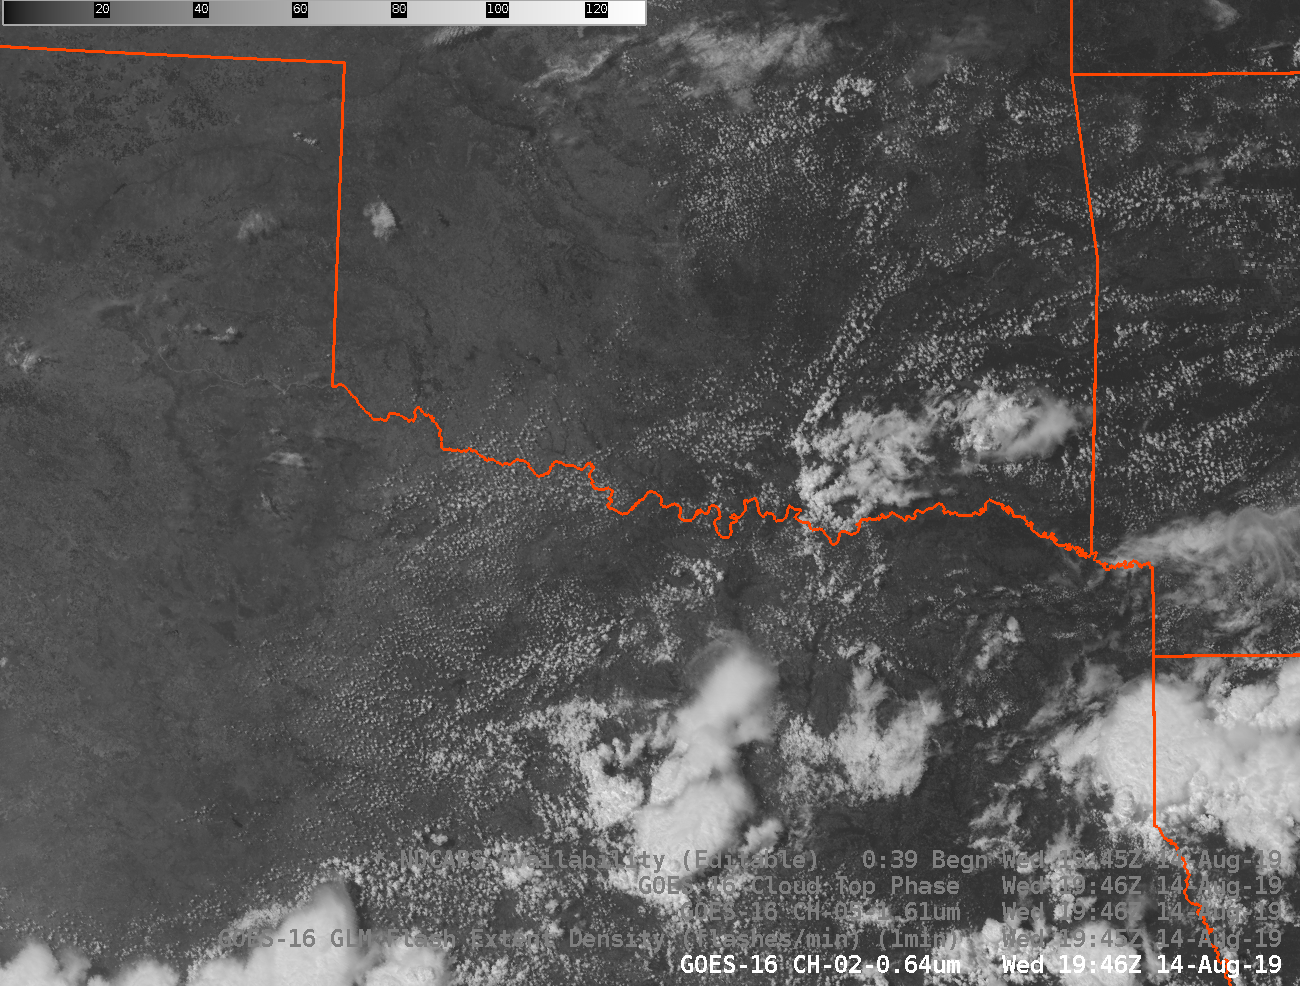
GOES-16 ABI Band 2 (0.64 µm) at 1946 UTC on 14 August 2019 (Click to enlarge)
The GOES-16 Visible (0.64 µm) image above shows a weak thunderstorm over southeastern Oklahoma surrounding an decaying outflow boundary. (Click here to see an animation of the visible imagery). The convection did not look particularly robust, but it did produce lightning that was detected by the Geostationary Lightning Mapper (GLM), as shown below.
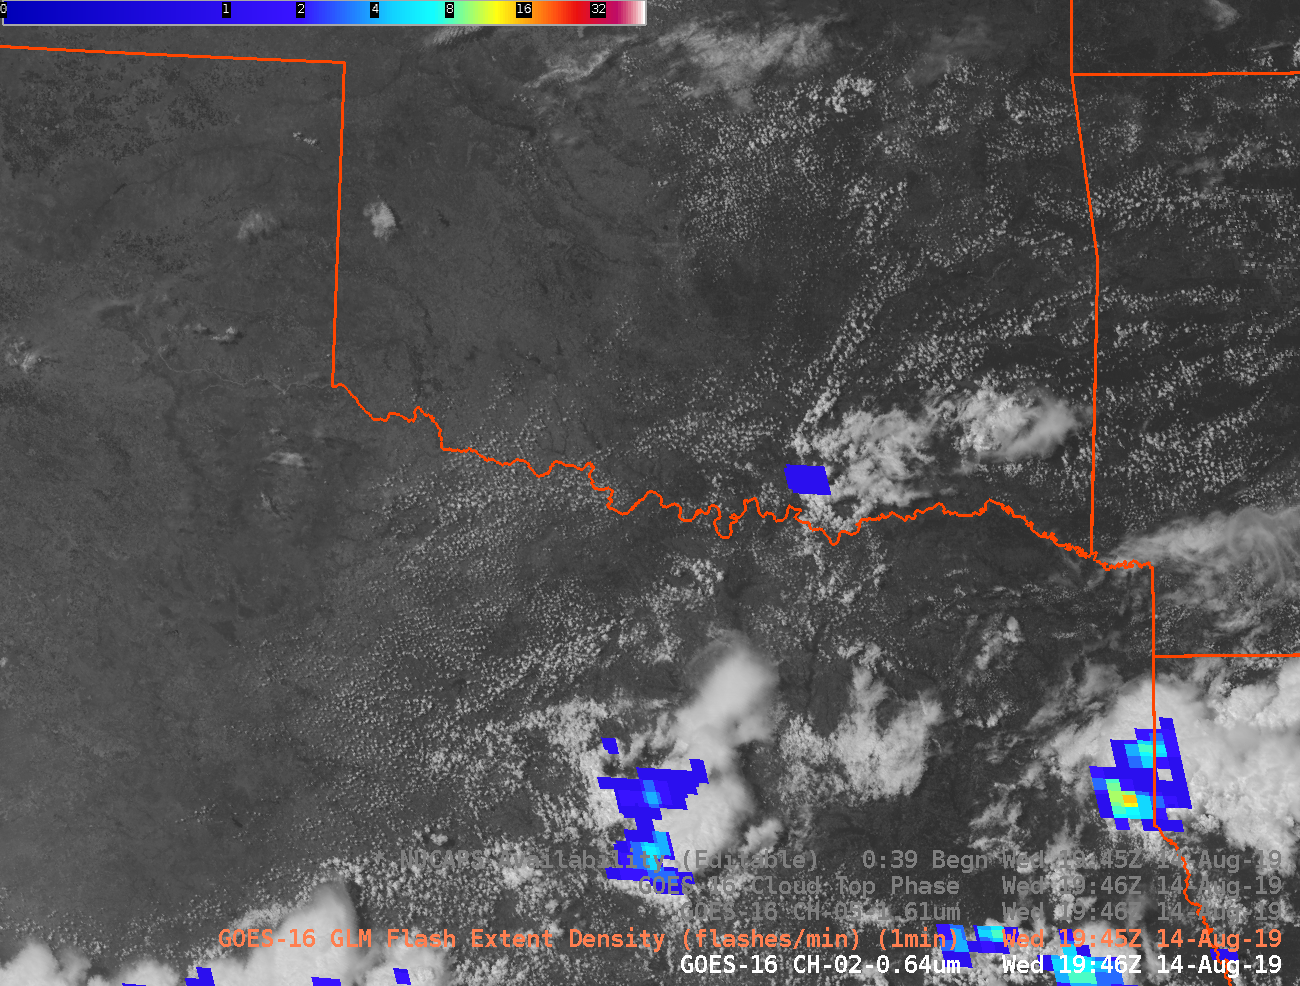
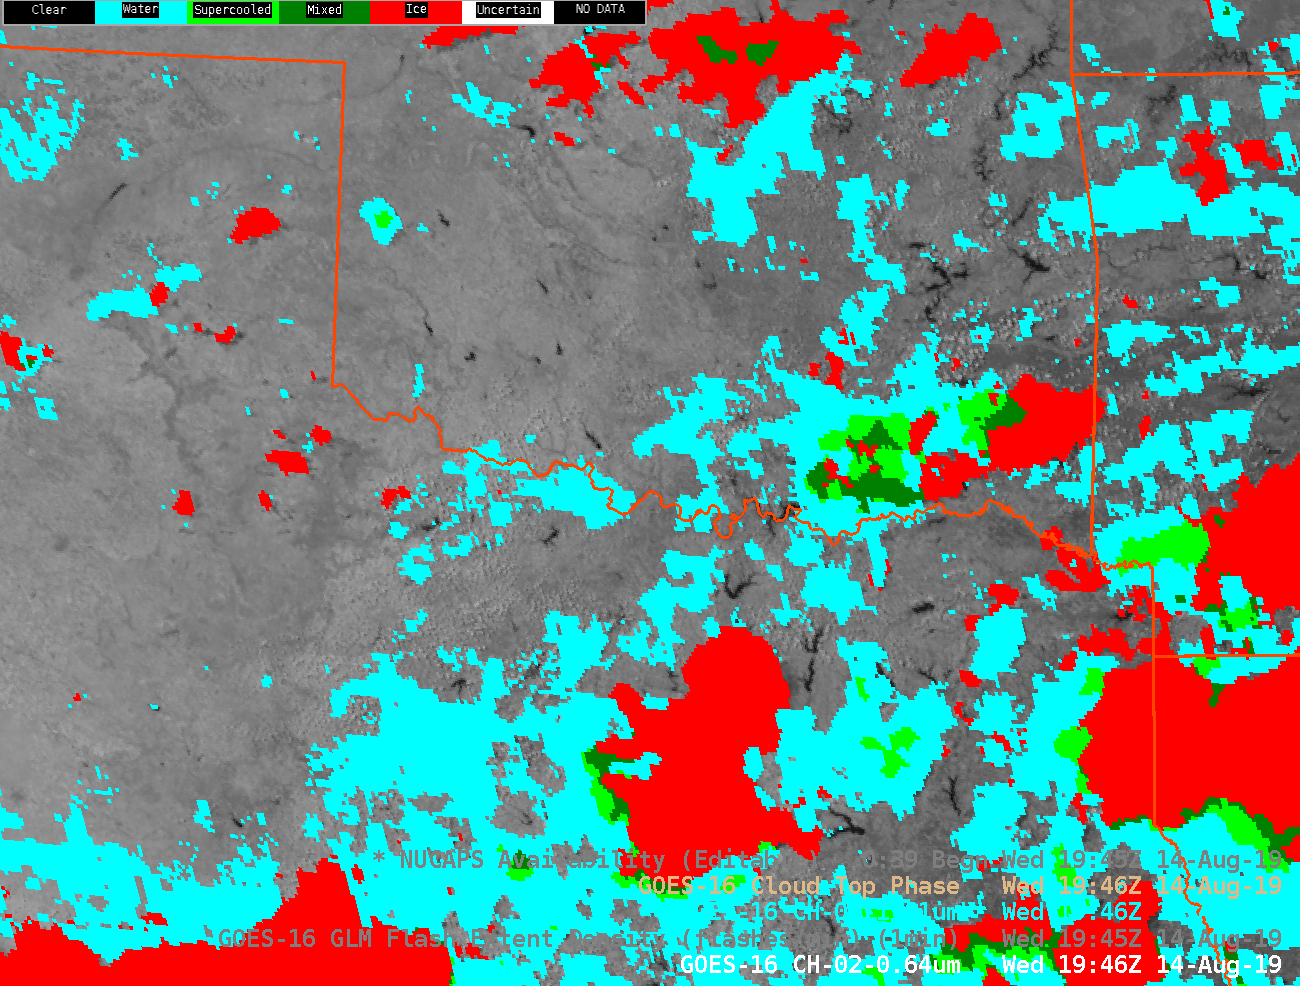
GOES-16 ABI Band 2 (0.64 µm) and GLM observations of Flash Extent Density at 1946 UTC on 14 August 2019
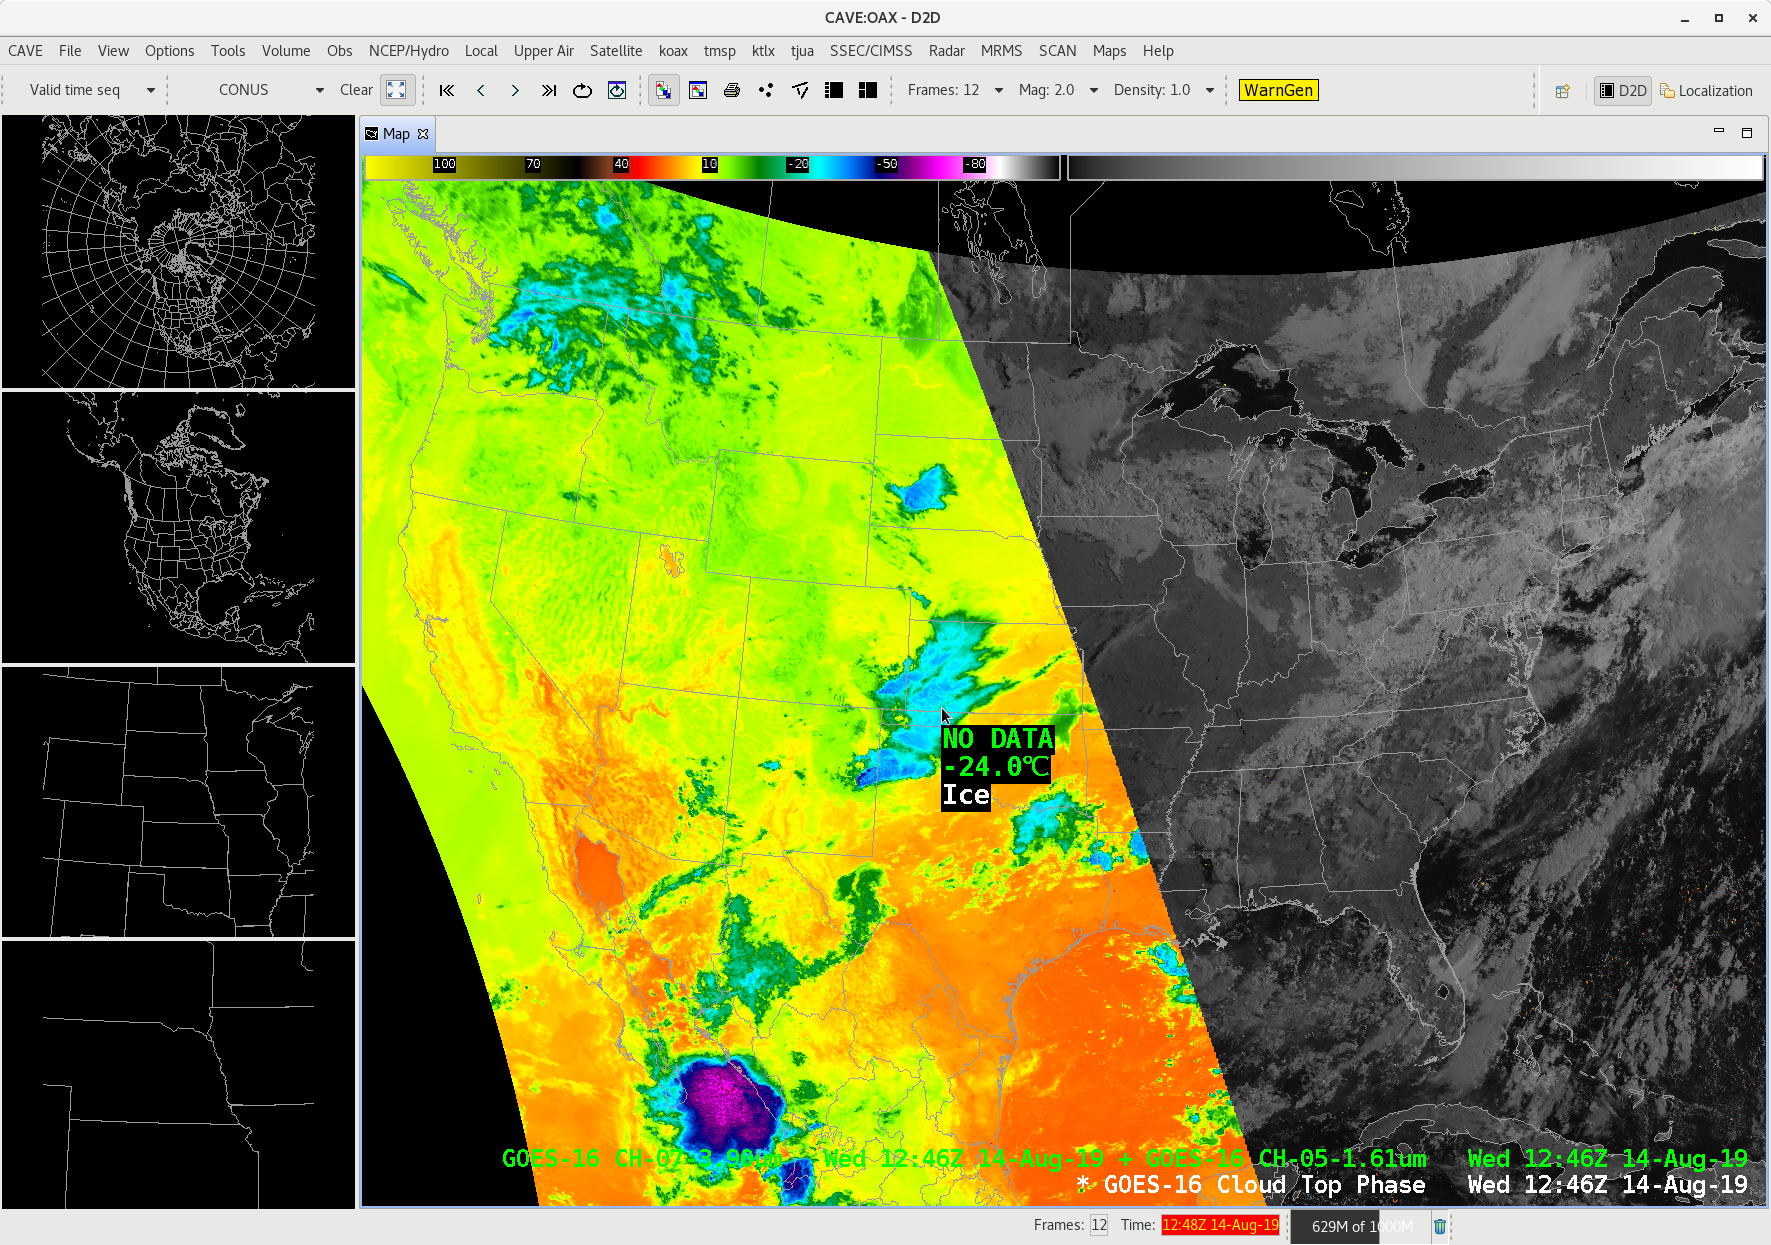
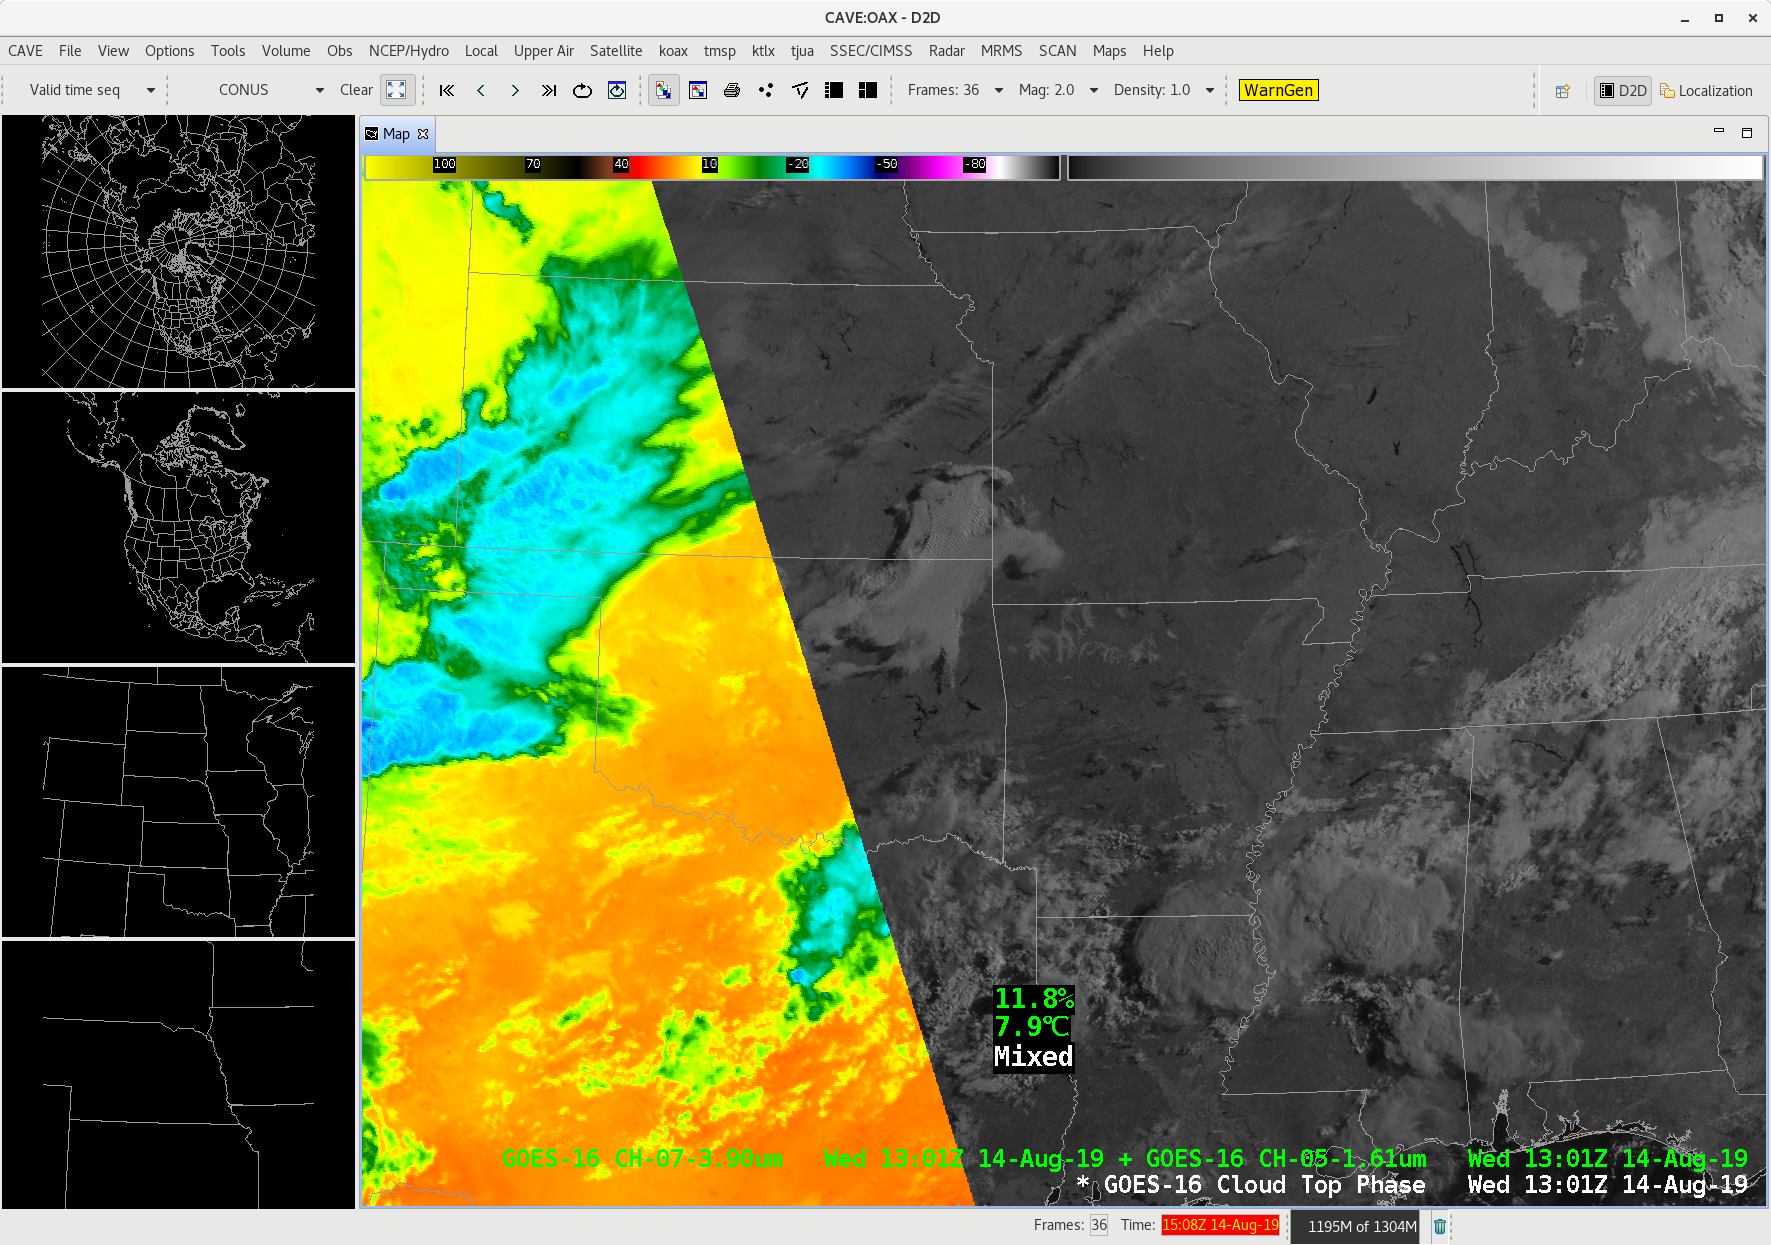
Lightning requires charge separation in a cloud; typically lightning occurs after the cloud top glaciates. During daytime, glaciation can be detected with ABI Band 5, at 1.61 µm, the so-called Snow/Ice band. The toggle below shows the visible, snow/ice band, and the Baseline Cloud Phase product. Glaciation is indicated.

GOES-16 ABI Band 2 (0.64 µm), Band 5 (1.61 µm) and Baseline Cloud Phase at 1946 UTC on 14 August 2019
This case is interesting because NOAA-20 overflew the convection, and soundings were produced around the convection, as shown below.
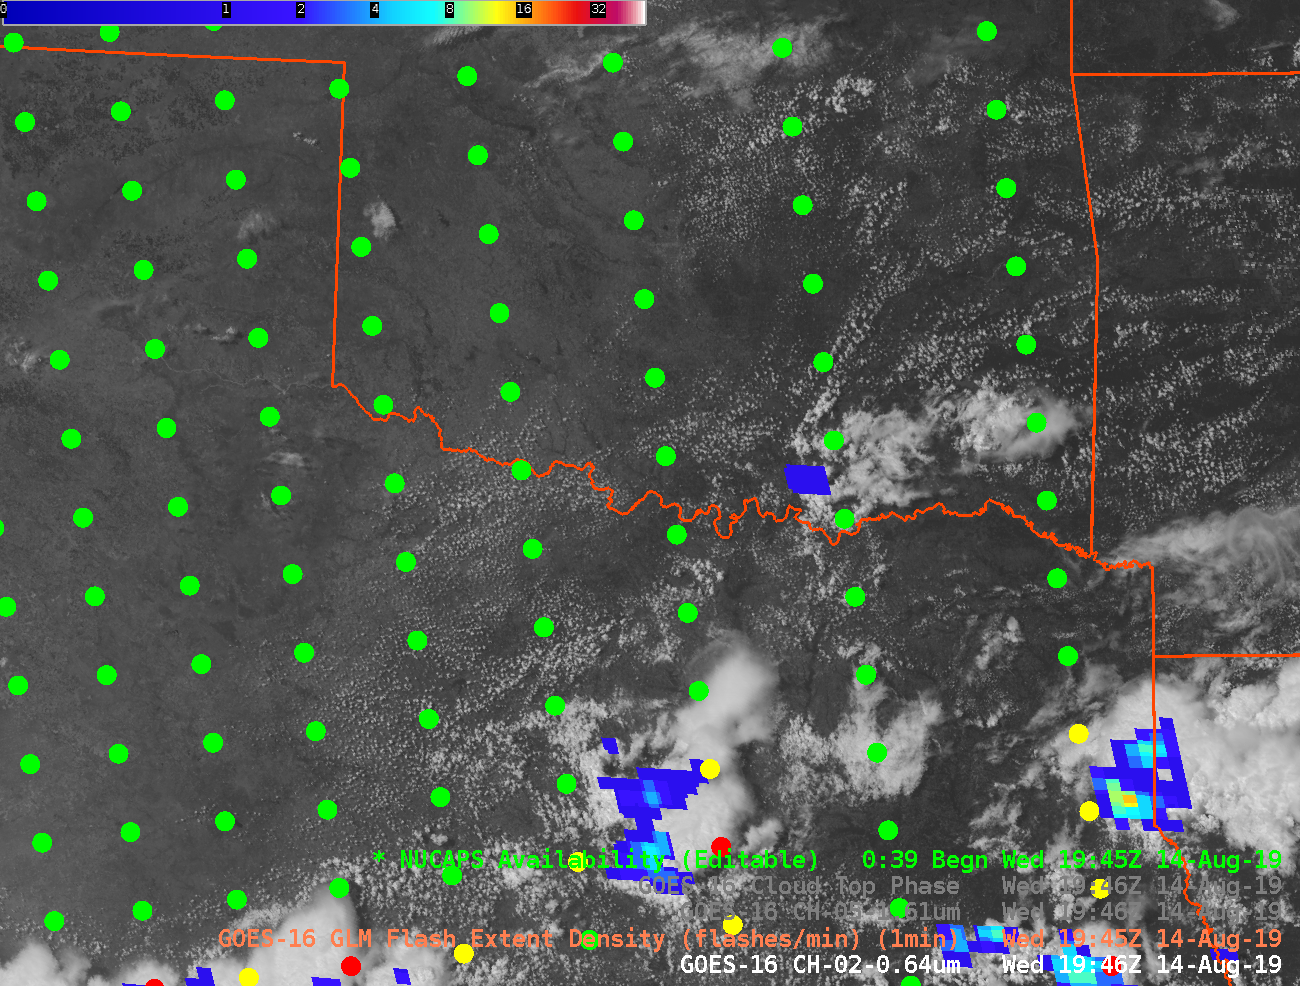
GOES-16 ABI Band 2 (0.64 µm) at 1946 UTC on 14 August 2019 along with NUCAPS Sounding Points at 1945 UTC
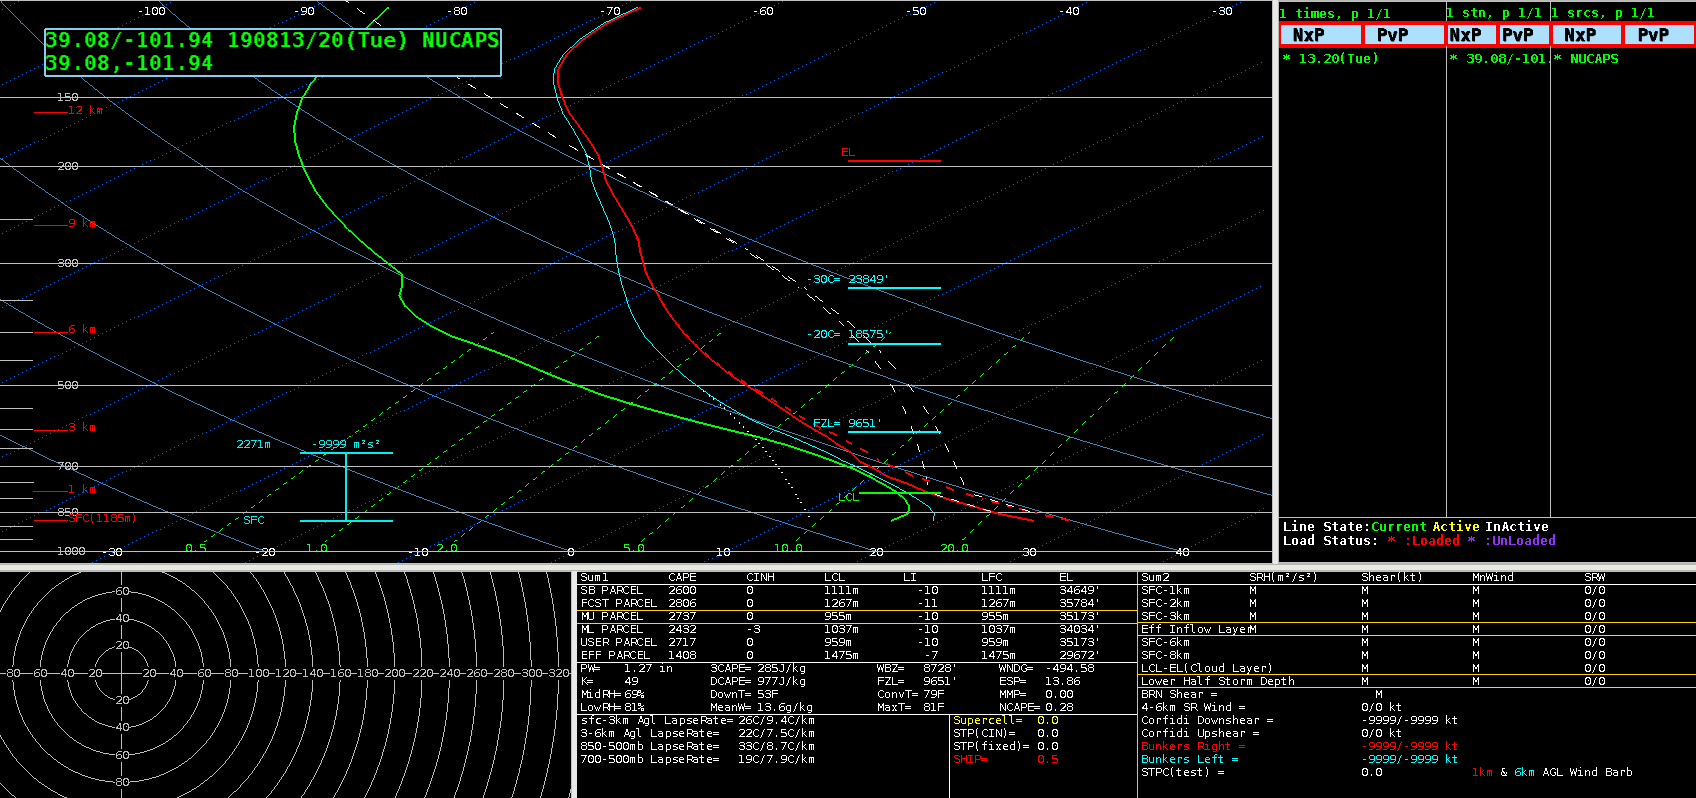
The animation below steps north-south through seven profiles that surround the weak convection. Note that a profile near the convection has thermodynamic parameters more favorable for convection than at the other profiles. For example, NUCAPS profiles show the convection at the northern edge of a precipitable water gradient, and also in a local minimum of inhibition. Although the convection has initiated here, the fields do suggest that NUCAPS can be used to monitor thermodynamics at small scales before initiation.

NUCAPS Soundings at various points north, south and within convection at 1946 UTC on 14 August 2019 (Click to enlarge) Thermodynamic variables from the sounding are noted.
Horizontal gridded information derived from NUCAPS data will be in AWIPS shortly. See this post from Emily Berndt at SPoRT!
View only this post Read Less
![Plot of rawinsonde data from Anchorage, Alaska [click to enlarge]](https://cimss.ssec.wisc.edu/satellite-blog/wp-content/uploads/sites/5/2019/08/190814_00UTC_PANC_RAOB.GIF)
![Plot of rawinsonde data from Fairbanks, Alaska [click to enlarge]](https://cimss.ssec.wisc.edu/satellite-blog/wp-content/uploads/sites/5/2019/08/190814_00UTC_PAFA_RAOB.GIF)
![MIMIC Total Precipitable Water [click to play animation | MP4]](https://cimss.ssec.wisc.edu/satellite-blog/wp-content/uploads/sites/5/2019/08/190811_190814_mimicTPW_global_anim.gif)
![MIMIC Total Precipitable Water [click to play animation | MP4]](https://cimss.ssec.wisc.edu/satellite-blog/wp-content/uploads/sites/5/2019/08/190811_190814_mimicTPW_AK_anim.gif)
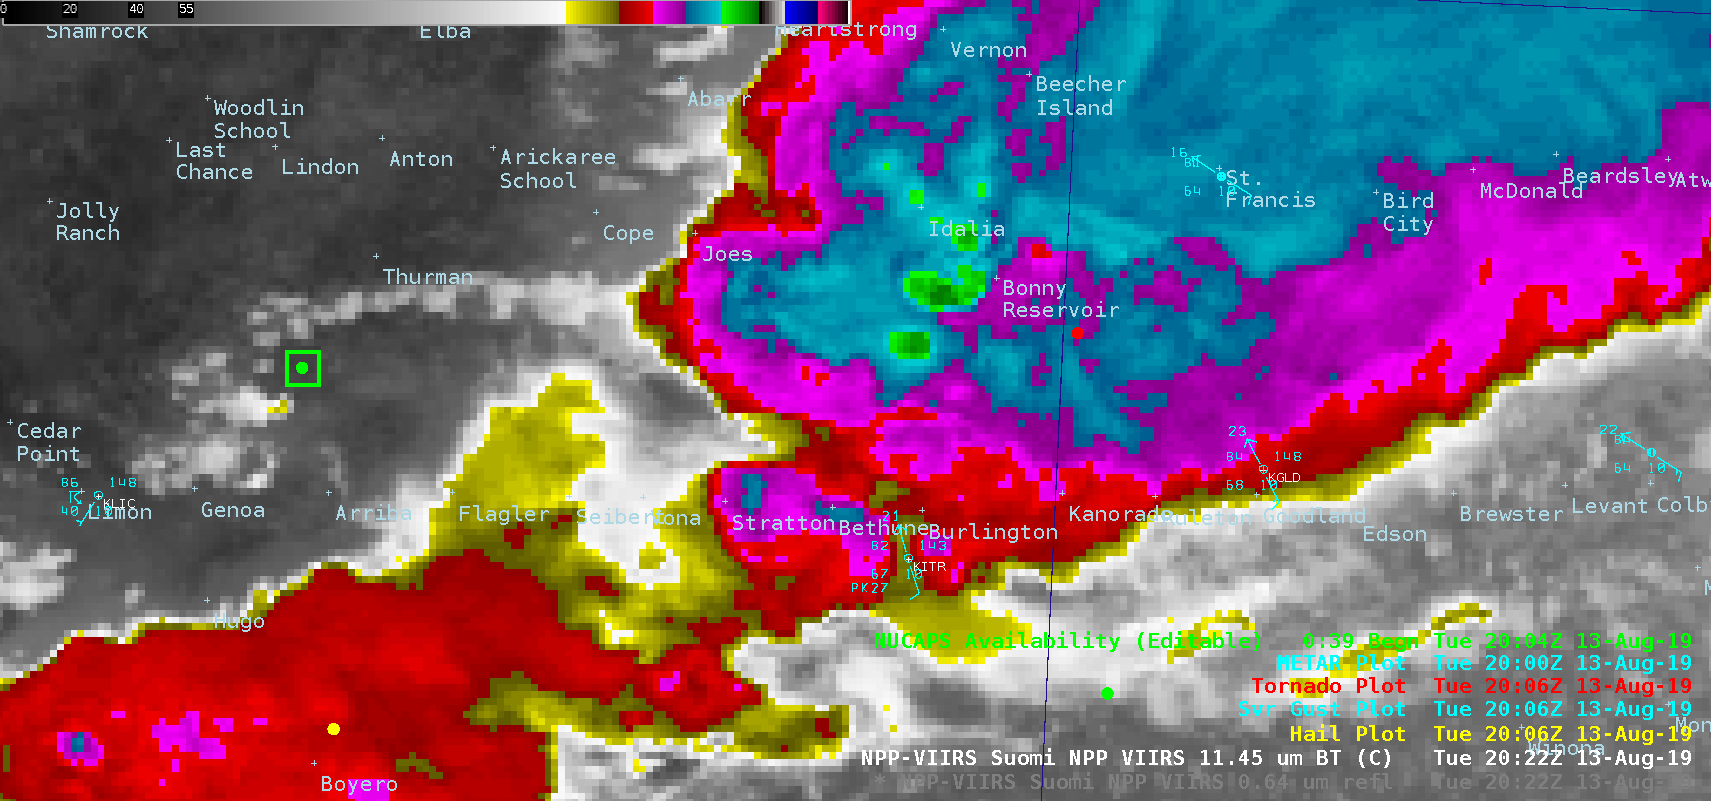
![NOAA-20 Visible (0.64 µm) and Infrared Window (11.45 µm) images, with NUCAPS sounding locations and surface reports [click to enlarge]](https://cimss.ssec.wisc.edu/satellite-blog/wp-content/uploads/sites/5/2019/08/190813_2022utc_noaa20_viirs_visible_infrared_nucaps_CO_KS_anim.gif)
![NOAA-20 NUCAPS profile in eastern Colorado [click to enlarge]](https://cimss.ssec.wisc.edu/satellite-blog/wp-content/uploads/sites/5/2019/08/190813_20utc_co_nucaps_profile_orig.png)
