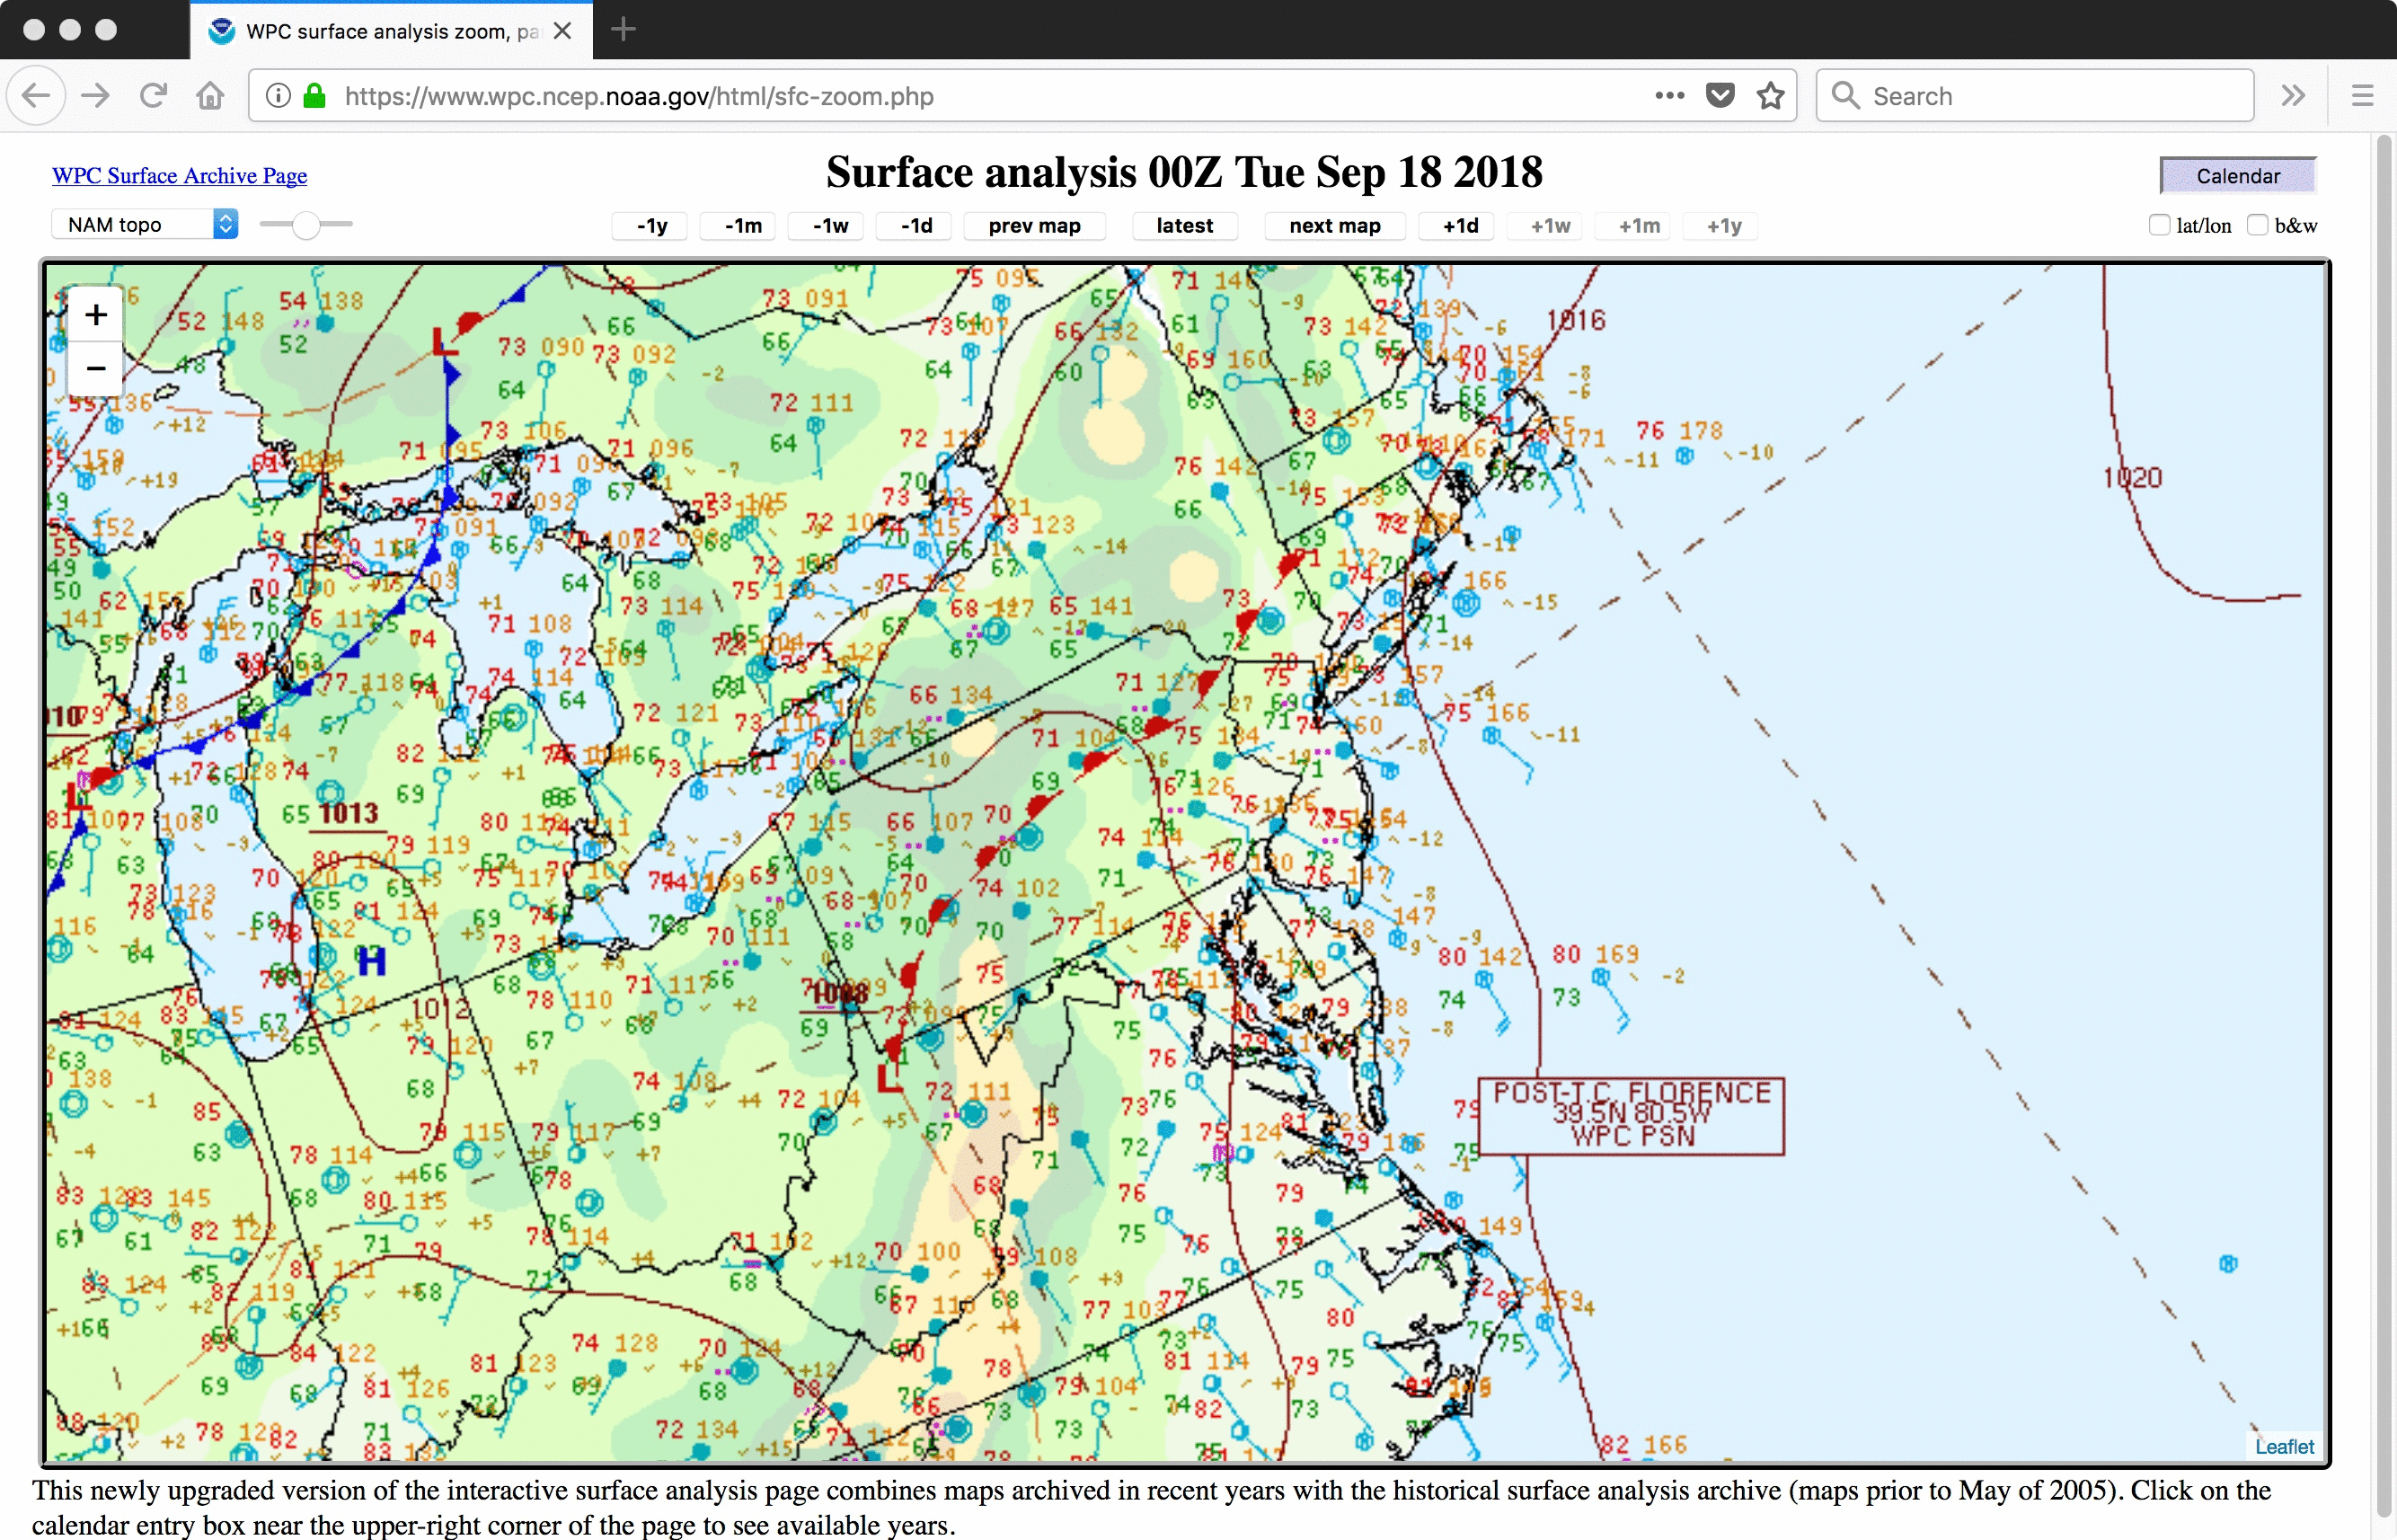
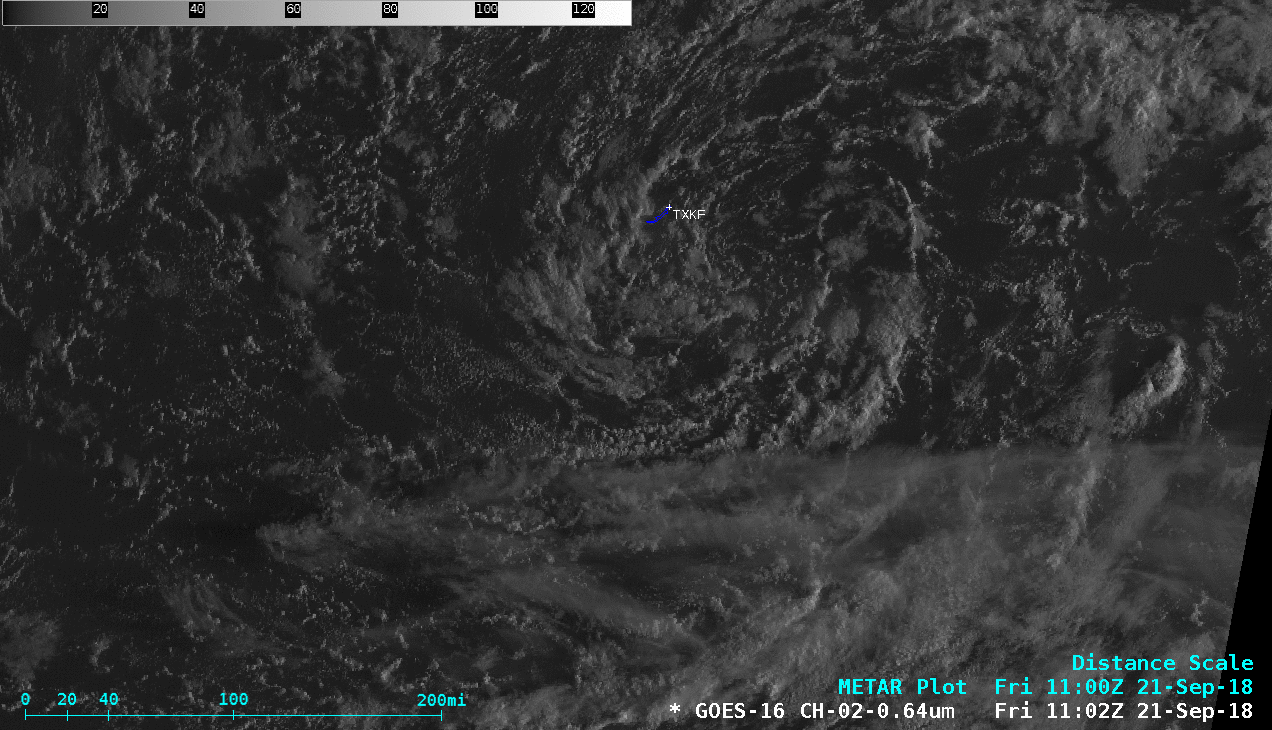
Remnants of Post-Tropical Cyclone Florence north of Bermuda
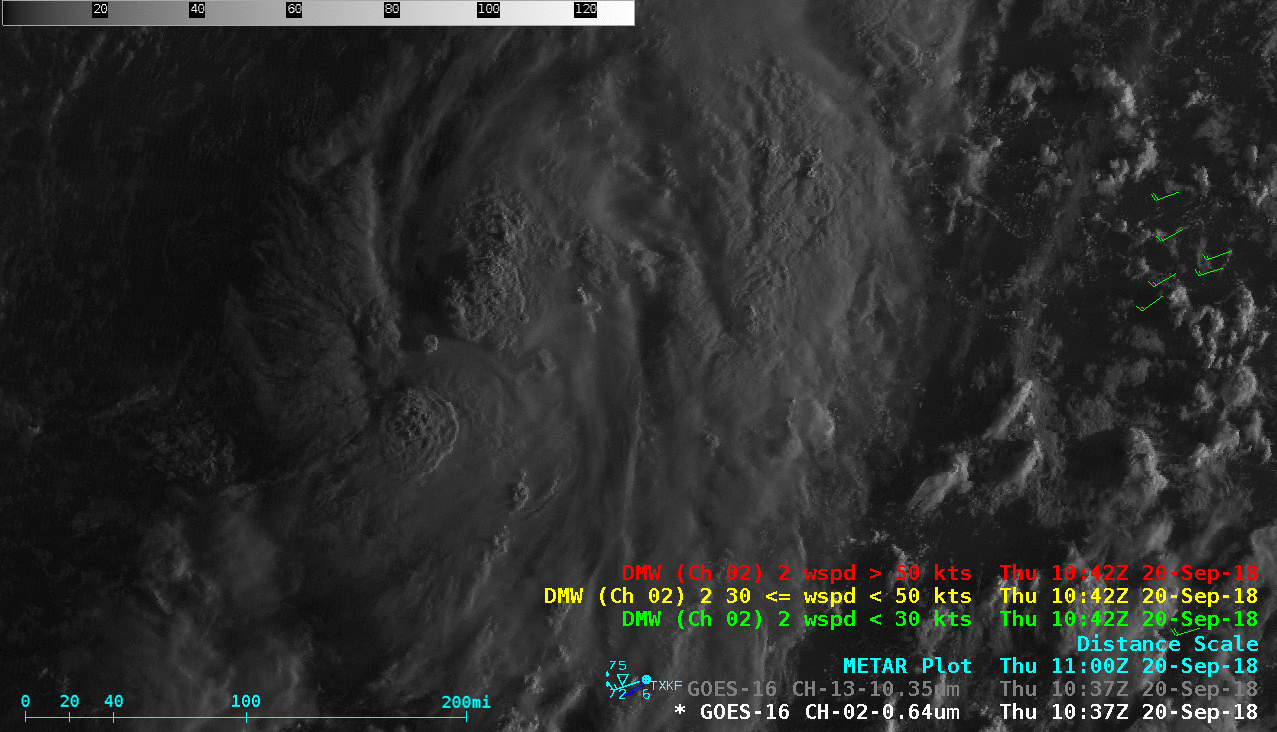
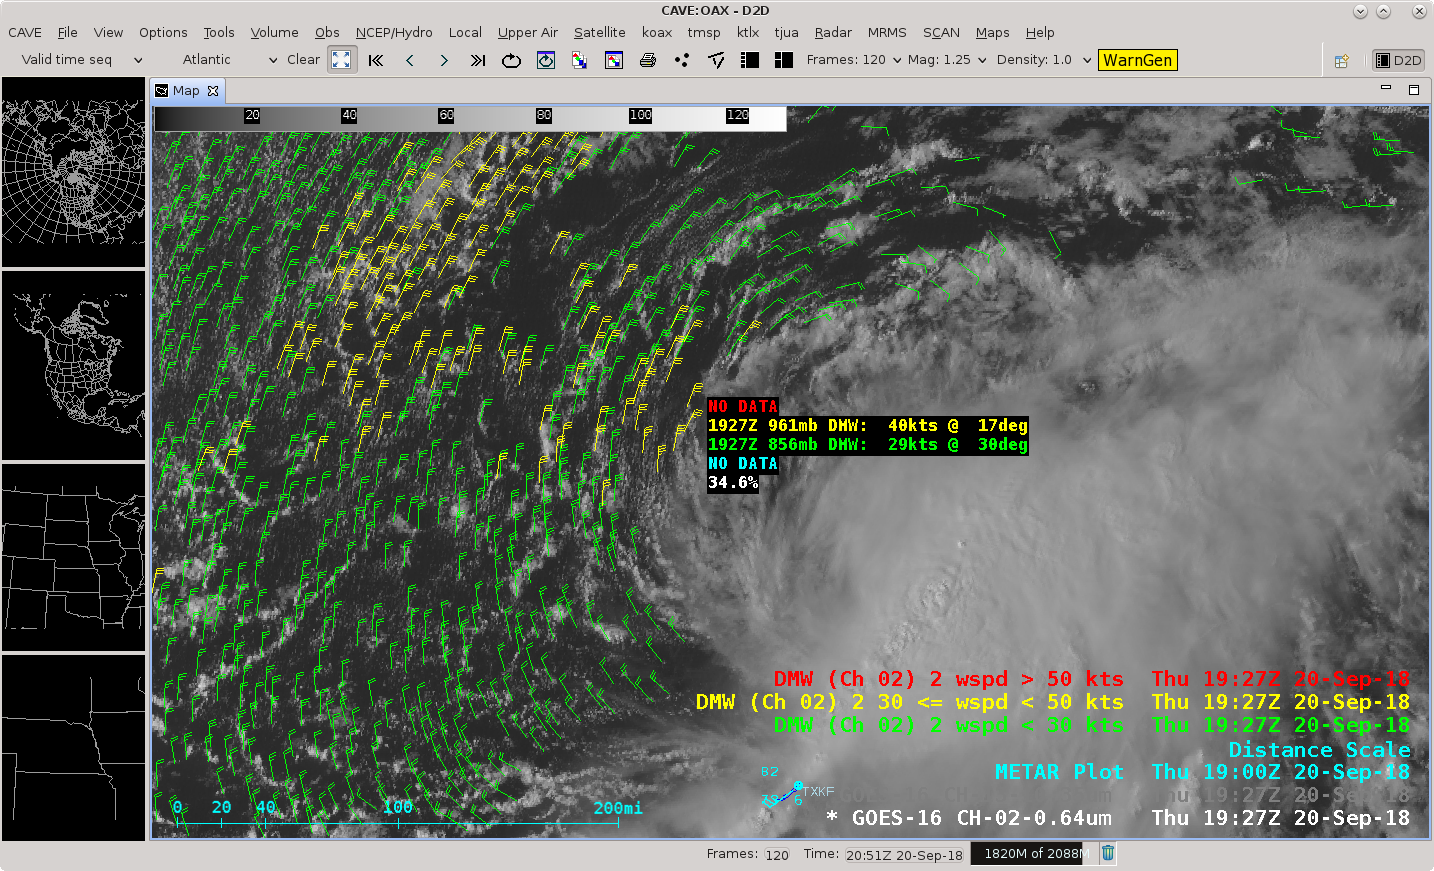
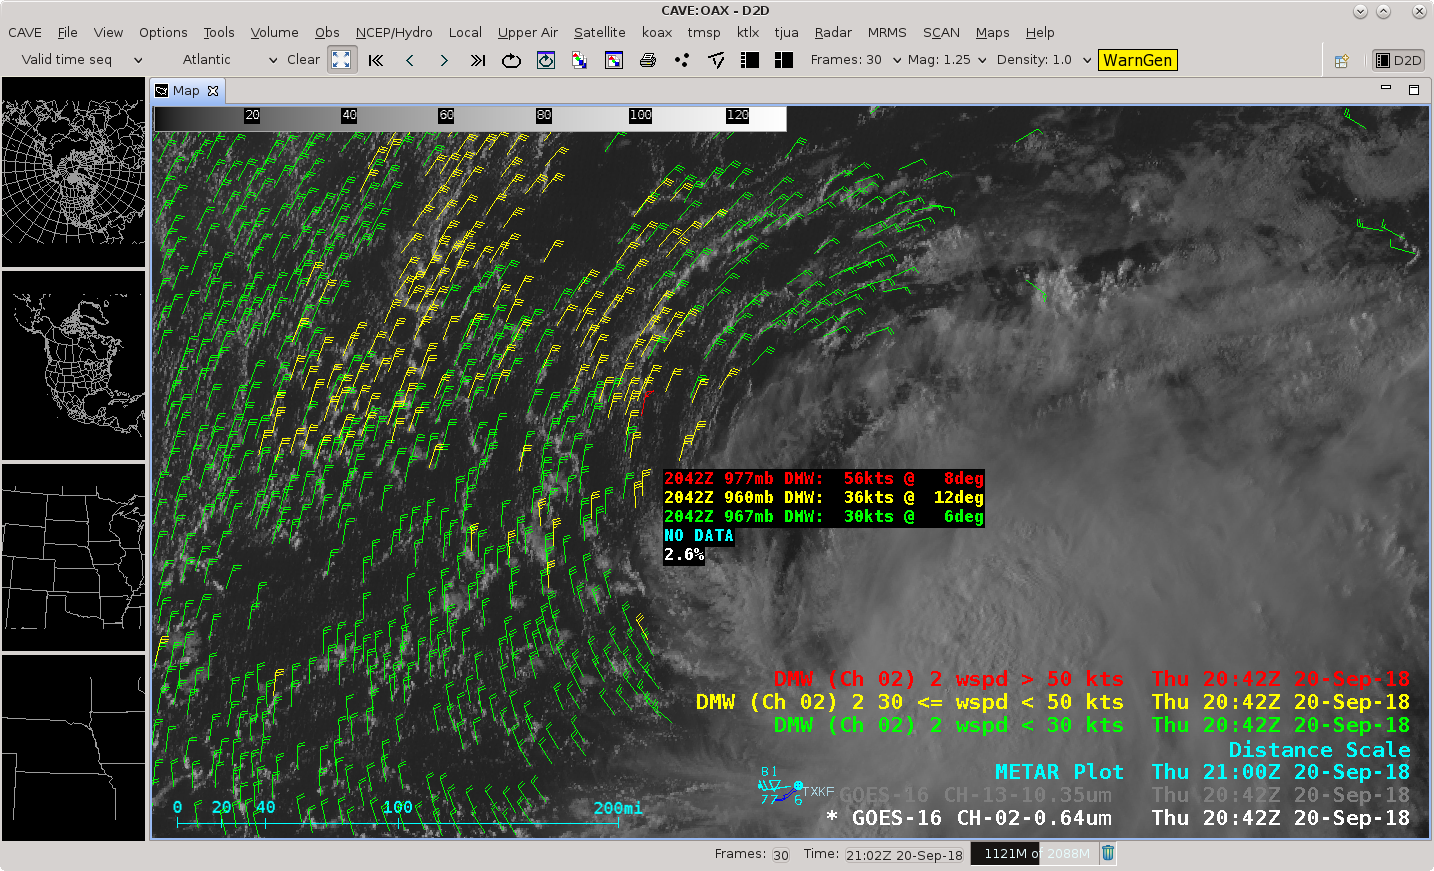
GOES-16 “Red” Visible (0.64 µm) images, with plots of Derived Motions Winds [click to play animation | MP4]
However, ASCAT scatterometer data from an overpass of the Metop-A satellite at 1335 UTC (below) only sensed surface winds speeds (deduced from ocean surface roughness) as high as 25 knots around the center of the circulation.
![Metop-A ASCAT surface scatterometer winds [click to enlarge]](https://cimss.ssec.wisc.edu/satellite-blog/wp-content/uploads/sites/5/2018/09/METOP_A_ASCAT_20180920_1335.png)
Metop-A ASCAT surface scatterometer winds [click to enlarge]
![GOES-16 Relative Vorticity product [click to play animation | MP4]](https://cimss.ssec.wisc.edu/satellite-blog/wp-content/uploads/sites/5/2018/09/180914_180920_850_vorticity_Florence_anim.gif)
GOES-16 Relative Vorticity product [click to play animation | MP4]
![Sea Surface Temperature and Ocean Heat Content [click to enlarge]](https://cimss.ssec.wisc.edu/satellite-blog/wp-content/uploads/sites/5/2018/09/180920_sst_ohc_Invest98L_anim.gif)
Sea Surface Temperature and Ocean Heat Content [click to enlarge]
![GOES-16 Mid-level Water Vapor (6.9 µm) images, with deep-layer wind shear analyzed at 22 UTC [click to enlarge]](https://cimss.ssec.wisc.edu/satellite-blog/wp-content/uploads/sites/5/2018/09/180920_goes16_water_vapor_shear_Invest98L_anim.gif)
GOES-16 Mid-level Water Vapor (6.9 µm) images, with deep-layer wind shear analyzed at 22 UTC [click to enlarge]
![GOES-16 Low-level Water Vapor (7.3 µm) images + Total Precipitable Water derived product [click to play MP4 animation]](https://cimss.ssec.wisc.edu/satellite-blog/wp-content/uploads/sites/5/2018/09/flo_remnants_wv_tpw-20180920_180215.png)
GOES-16 Low-level Water Vapor (7.3 µm) images + Total Precipitable Water derived product [click to play MP4 animation]
===== 21/22 September Update =====
GOES-16 “Red” Visible (0.64 µm) images [click to play animation | MP4]
On 22 September, the circulation continued to drift a bit farther south of Bermuda (below), a few hundred miles north of an area of Saharan Air Layer dust (discussed here) — note the hazy signature of the dust on Visible imagery, along with elevated Aerosol Optical Depth values of 0.6 to 0.7 having a good coverage of medium to high confidence Dust Detection.
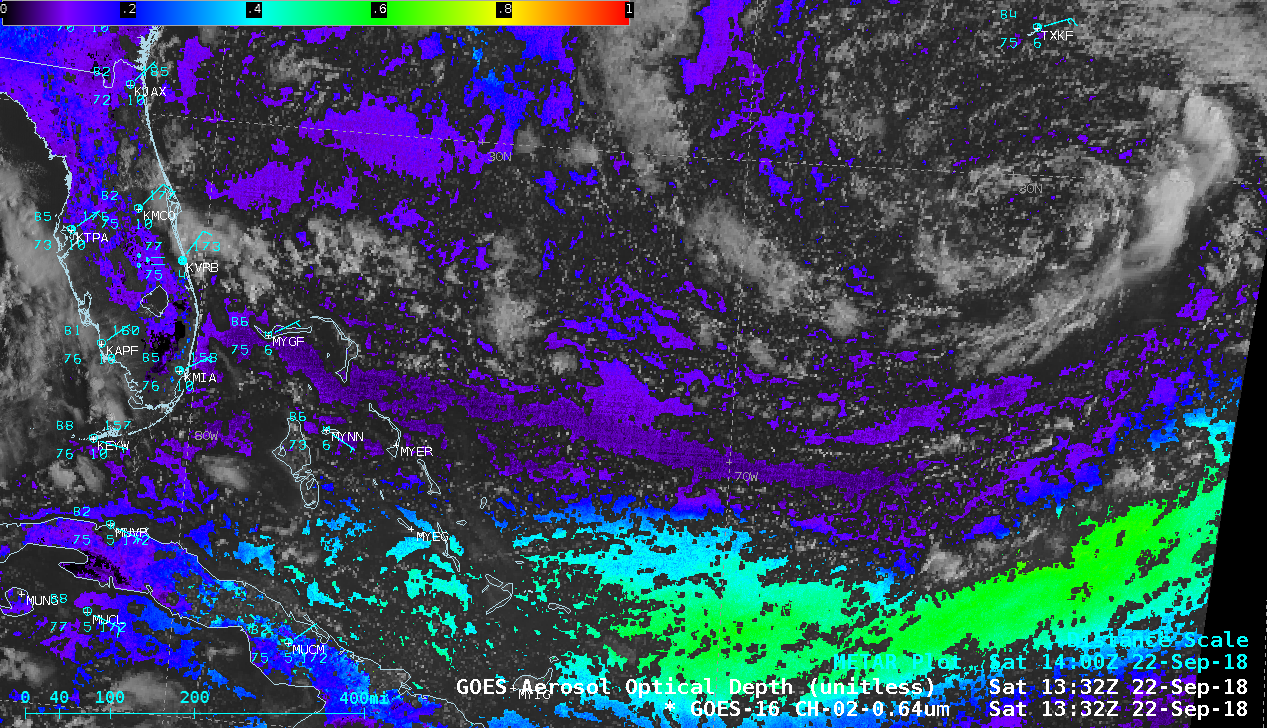
GOES-16 “Red” Visible (0.64 µm) images, along with Aerosol Optical Depth and Dust Detection products [click to play MP4 animation]