NUCAPS views Saharan Air over the Atlantic

Saharan Air Layer Analysis over the Tropical Atlantic, 0600 UTC on 20 September 2018 (Click to enlarge)
There have been many episodes of Saharan Air over the tropical Atlantic within the past months, and another episode is in progress on 20 September. The Saharan Air Layer (SAL) analysis, above, from the CIMSS Tropical Weather website (Direct Link), shows dry air north and east of the Caribbean. The Clean Window ABI Band 13 (10.3 µm) Full-Disk ABI infrared imagery, below, from 0500 UTC, overlain with NUCAPS sounding points, shows where data were available from that morning overpass of Suomi NPP.
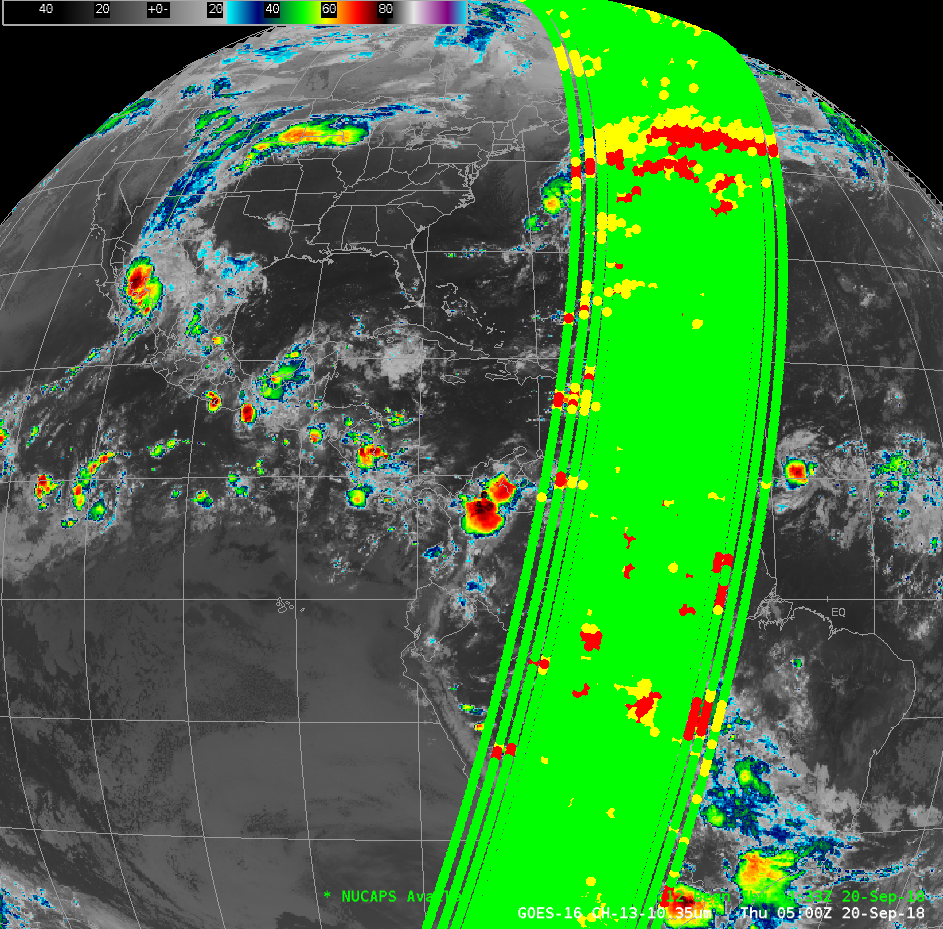
GOES-16 ABI 10.3 µm Infrared Imagery at 0500 UTC along with NUCAPS Sounding Points at approximately the same time (Click to enlarge)
The stepping animation below shows NUCAPS Soundings at a selection of points that starts north of the Saharan Air Layer and ends up within the SAL. The underlying figure is the Dust RGB from AWIPS, an RGB that combines the Split Window Difference (12.3 µm -10.3 µm; Red Component), Split Cloud Top Phase Brightness Temperature Difference (11.2 µm – 8.5 µm; Green Component) and 10.3 µm Infrared Imagery (Blue Component). Typically, regions with dust as might accompany a SAL have a pink tinge. The soundings are annotated to include Total Precipitable Water measurements, and mid-level Relative humidity. NUCAPS soundings identify the region where the SAL is present.
Dust RGB at 0433 UTC north and east of the Caribbean, and NUCAPS Soundings at selected points along a transect (Click to enlarge)
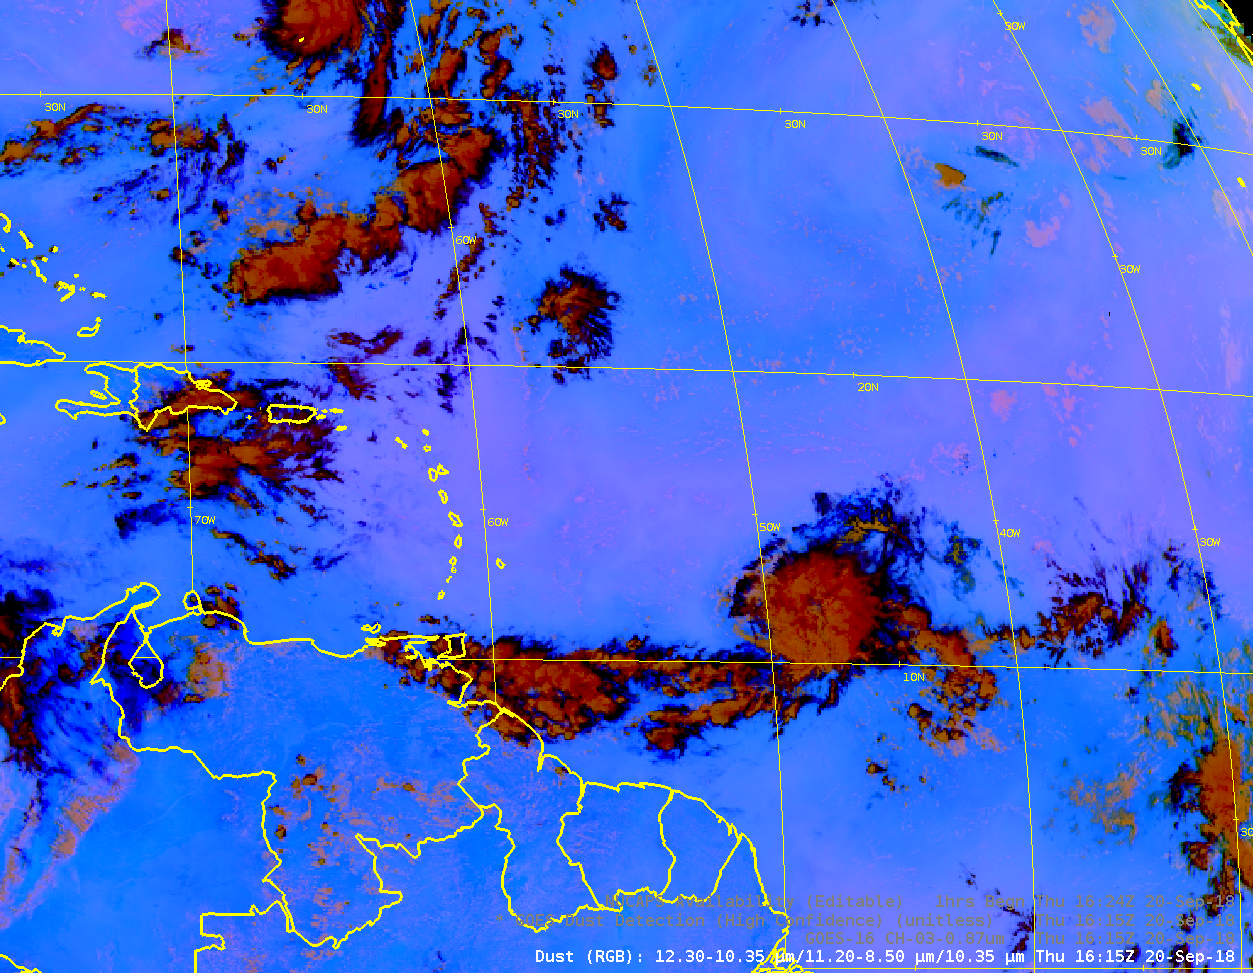
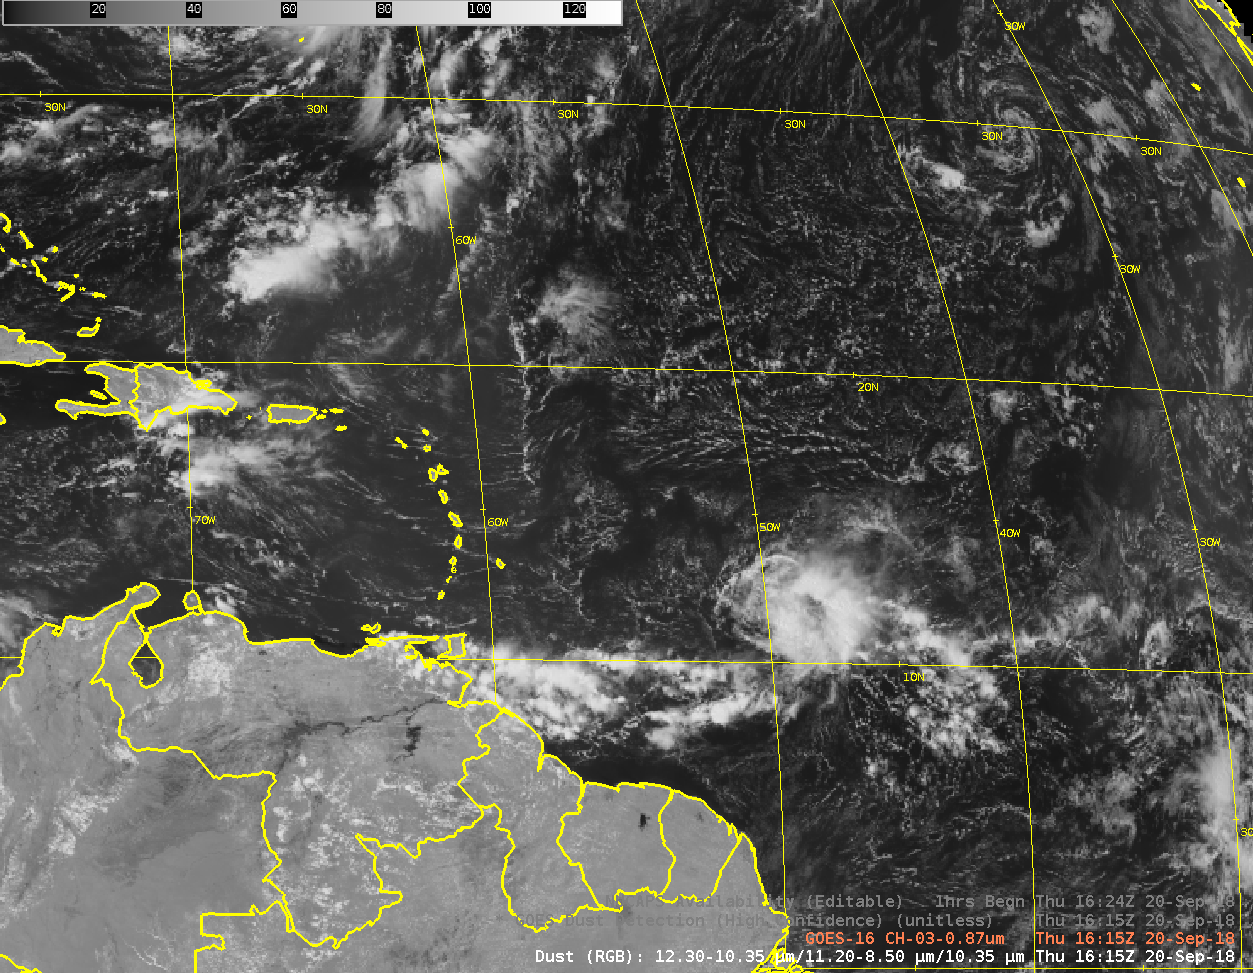
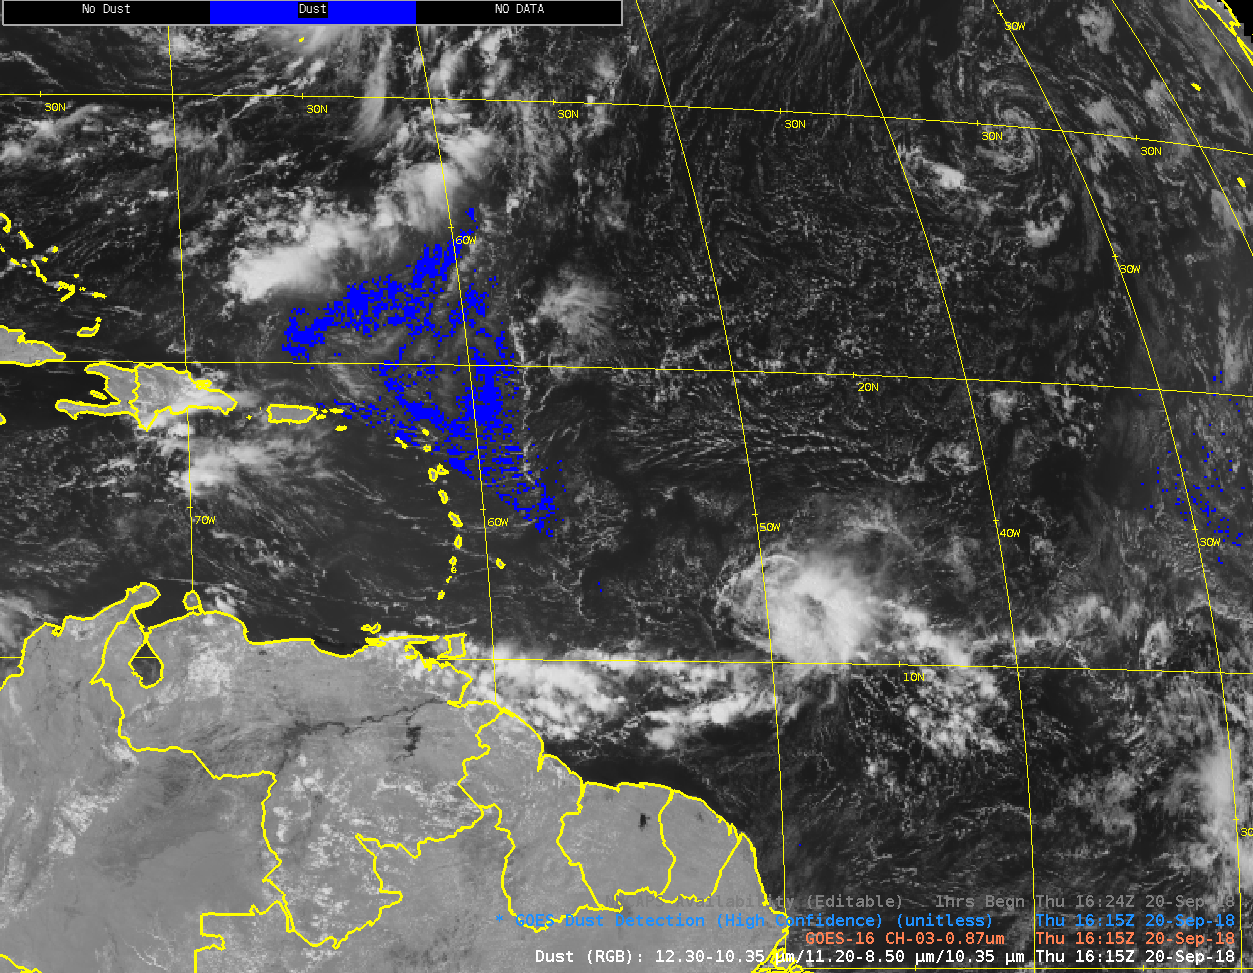
The SAL air continued its movement west during the day on 20 September. The toggle below shows the Dust RGB, ABI Band 3 (0.86 µm) and the Baseline Aerosol Detection Product (in blue) at about the same time as the afternoon NUCAPS Sounding overpass (from Suomi NPP). Suomi NPP overflew the eastern half of the SAL air (the overpass from NOAA-20 was more centered on the SAL air approaching the Caribbean, but NOAA-20 NUCAPS soundings are not yet in AWIPS; they should be by the end of the year).

GOES-16 ABI Dust RGB, “Veggie Band” (Near-Infrared at 0.86 µm), and Baseline Aerosol Detection Product (Blue points), 1615 UTC on 20 September 2018 (Click to enlarge)
NUCAPS Soundings at 3 points (North of the SAL, within the SAL, and south of the SAL), below, show much different thermodynamics within the SAL.
NUCAPS Profiles at ~1600 UTC on 20 September 2018 at three locations as noted (Click to enlarge)
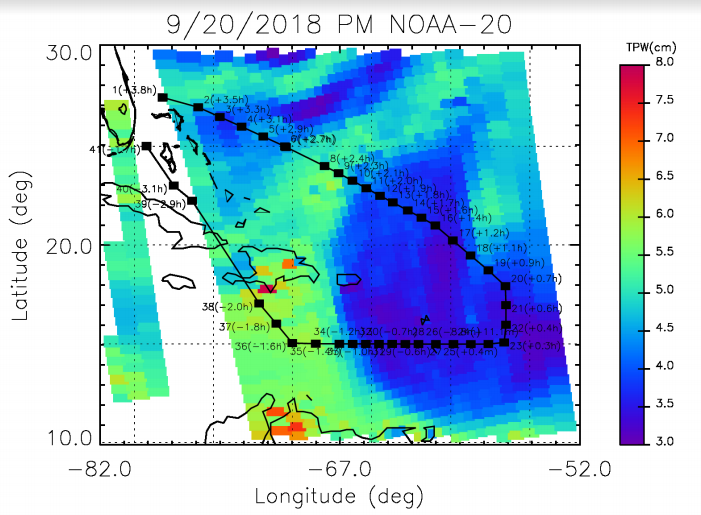
NOAA’s G-IV flew through this outbreak, deploying dropsondes to sample the event. The path of the aircraft (with the dropsonde locations) is here. Sonde #26, below, in the heart of the SAL, is shown below, with a nearby NOAA-20 NUCAPS sounding. (Flight path and Sonde imagery courtesy Chris Barnet, STC/NOAA) Refer to the caption for details. Recall that the Dropsonde shows values at a point. The NUCAPS profile is sampling a volume that is approximately a 50-km cylinder! There is nevertheless excellent agreement.
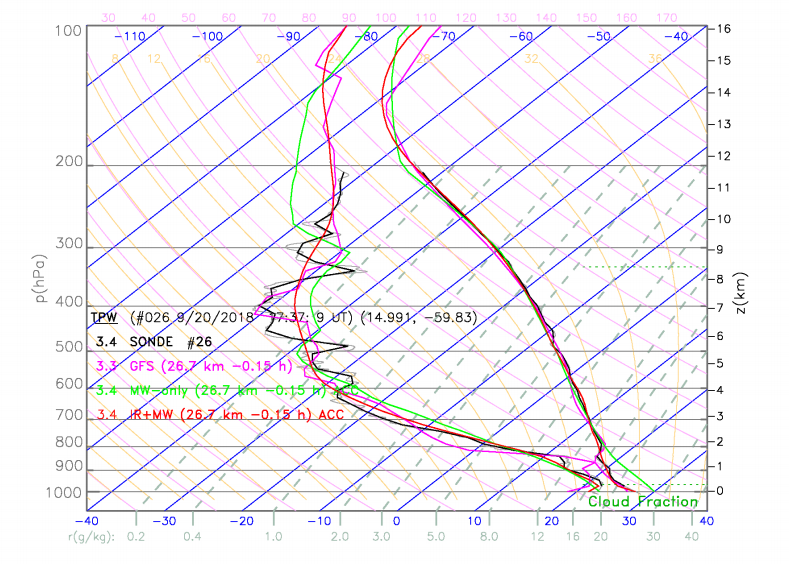
Dropsonde #26 data (raw data in light grey; values averaged into the 100 NUCAPS vertical layers in black); GFS sounding in magenta. NUCAPS Microwave-only sounding in green; NUCAPS Microwave and infrared retrieval (as might be seen in AWIPS) in Red. Time offset from the Dropsonde is noted (Click to enlarge)
SAL outbreaks cause a significant deterioration in air quality over the Caribbean. The image below, courtesy Ernesto Rodriguez, SOO for the National Weather Service office in San Juan, Puerto Rico, compares Air Quality before and during a SAL outbreak in July, and during the current outbreak.

The view outside of the National Weather Service office in San Juan on 20 September and 13 July 2018 (during SAL outbreaks) and on 12 July 2018 (before a SAL outbreak). Imagery courtesy Ernesto Rodriguez, NWS SJU.