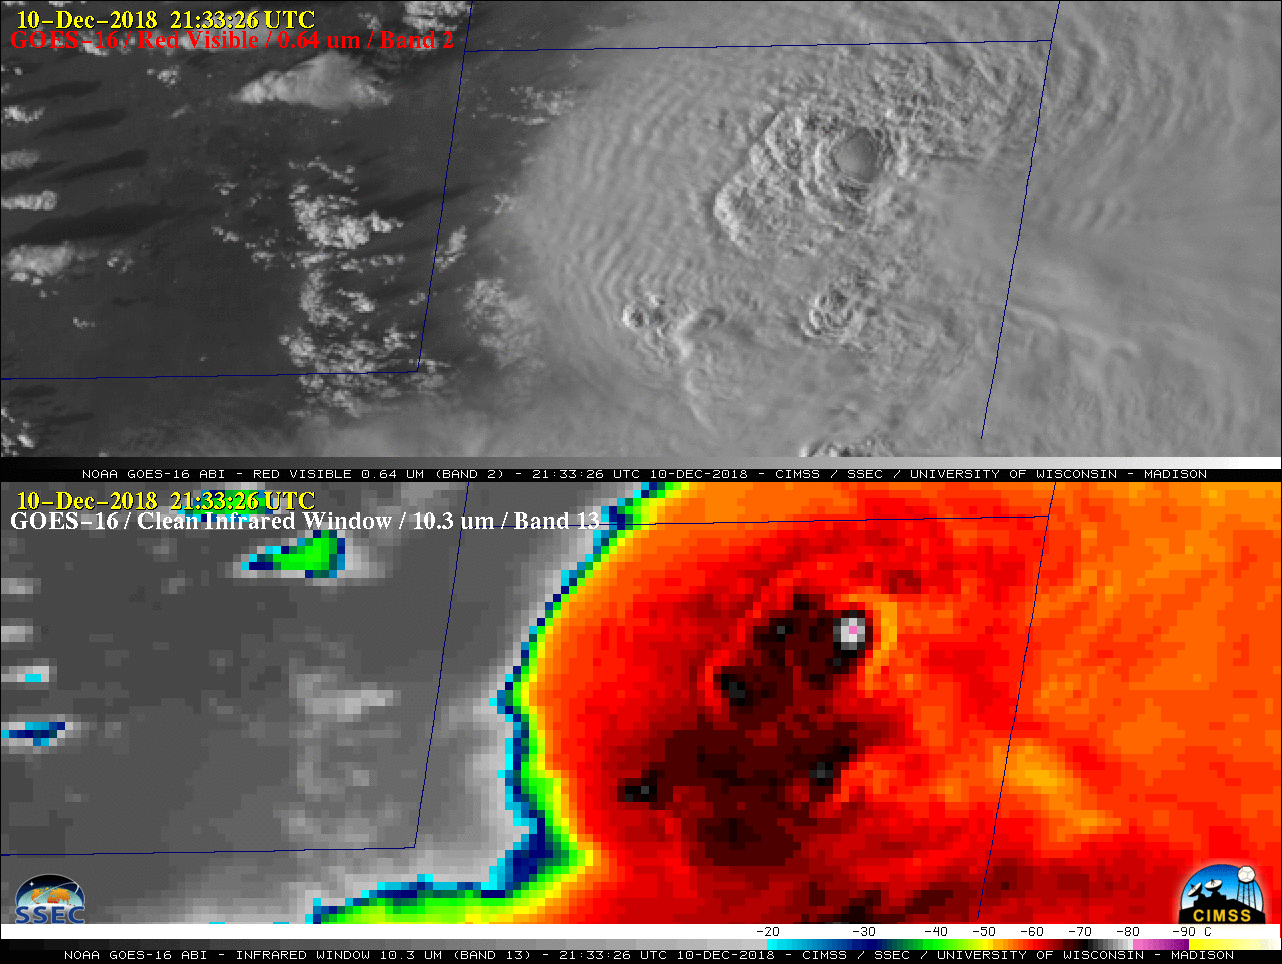
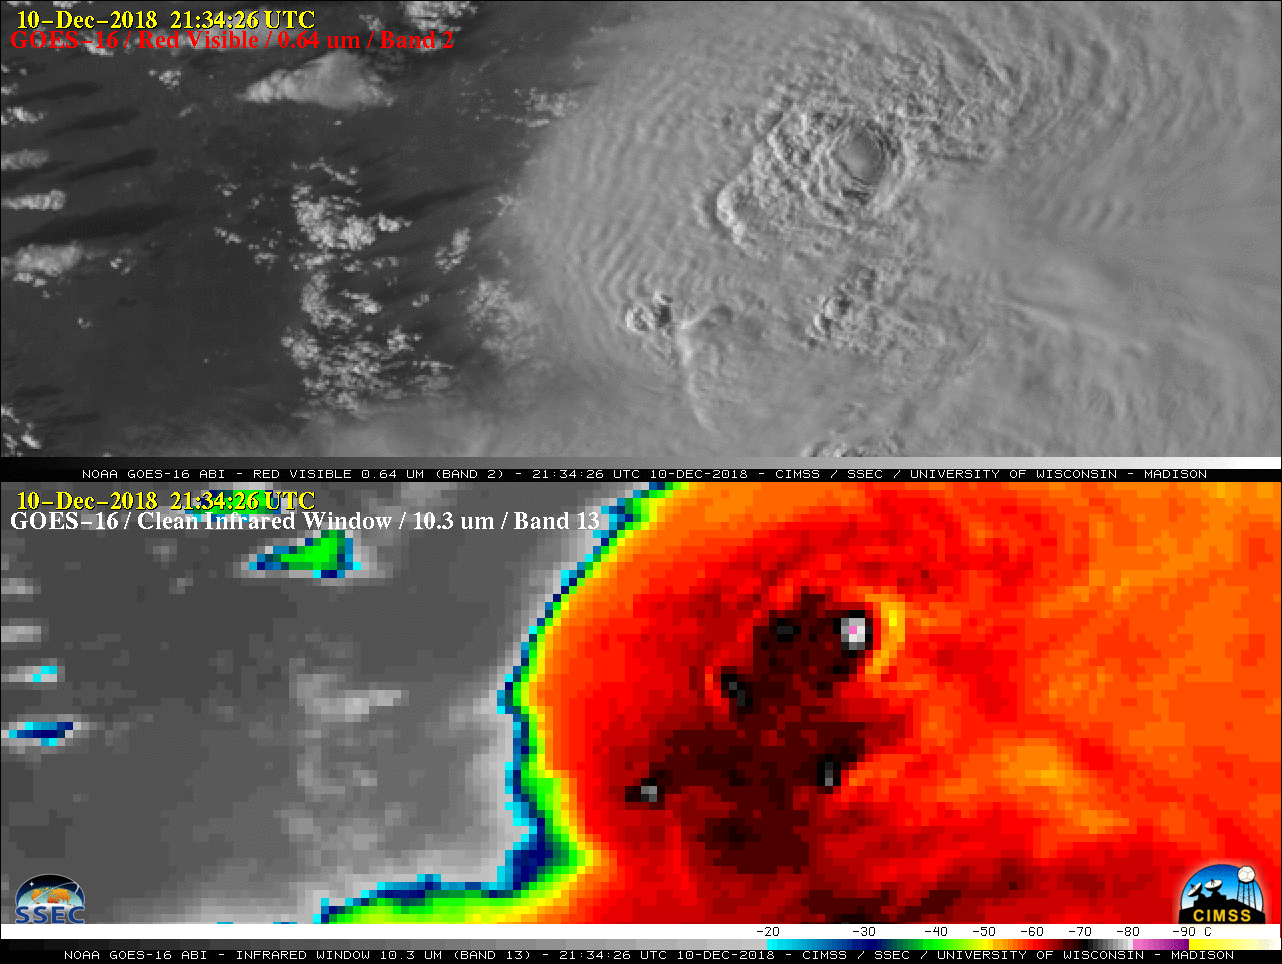
GOES-16 “Red” Visible (0.64 µm, top) and “Clean” Infrared Window (10.3 µm, bottom) images [click to play MP4 animation]
A comparison of GOES-16
(GOES-East) “Red” Visible (
0.64 µm) and “Clean” Infrared Window (
10.3 µm) images
(above) showed the development of thunderstorms well ahead of a cold front (
surface analyses) that was moving northward across central Argentina on 10 December 2018. A
Mesoscale Domain Sector had been positioned over that region in support of the
RELAMPAGO-CACTI field experiment
IOP15, providing imagery at 1-minute intervals. The northernmost storm (of a cluster of 3) featured a very pronounced overshooting top that was seen for several hours, briefly exhibiting infrared brightness temperatures as cold as -80ºC
(violet enhancement) at
2133 UTC and
2134 UTC. Also noteworthy was the long-lived “warm trench”
(arc of yellow enhancement) immediately downwind of the persistent cold overshooting top.
Plots of GOES-16 GLM Groups on the Visible and Infrared images (below) showed a good deal of lightning activity with this convection — especially in the leading anvil region east of the storm core. However, it is interesting to point out that there was a general lack of satellite-detected lightning directly over the large and persistent overshooting top. The GLM Groups were plotted with the default parallax correction removed, so the optical emissions of the lightning aligned with cloud-top features as seen on the ABI imagery.
![GOES-16 "Red" Visible (0.64 µm, top) with GLM Groups and "Clean" Infrared Window (10.3 µm, bottom) images [click to play MP4 animation]](https://cimss.ssec.wisc.edu/satellite-blog/wp-content/uploads/sites/5/2018/12/G16_VIS_GLM_IR_ARGENTINA_10DEC2018_2018344_213326_GOES-16_0002PANELS.GIF)
GOES-16 “Red” Visible (0.64 µm, top) with GLM Groups and “Clean” Infrared Window (10.3 µm, bottom) images [click to play MP4 animation]
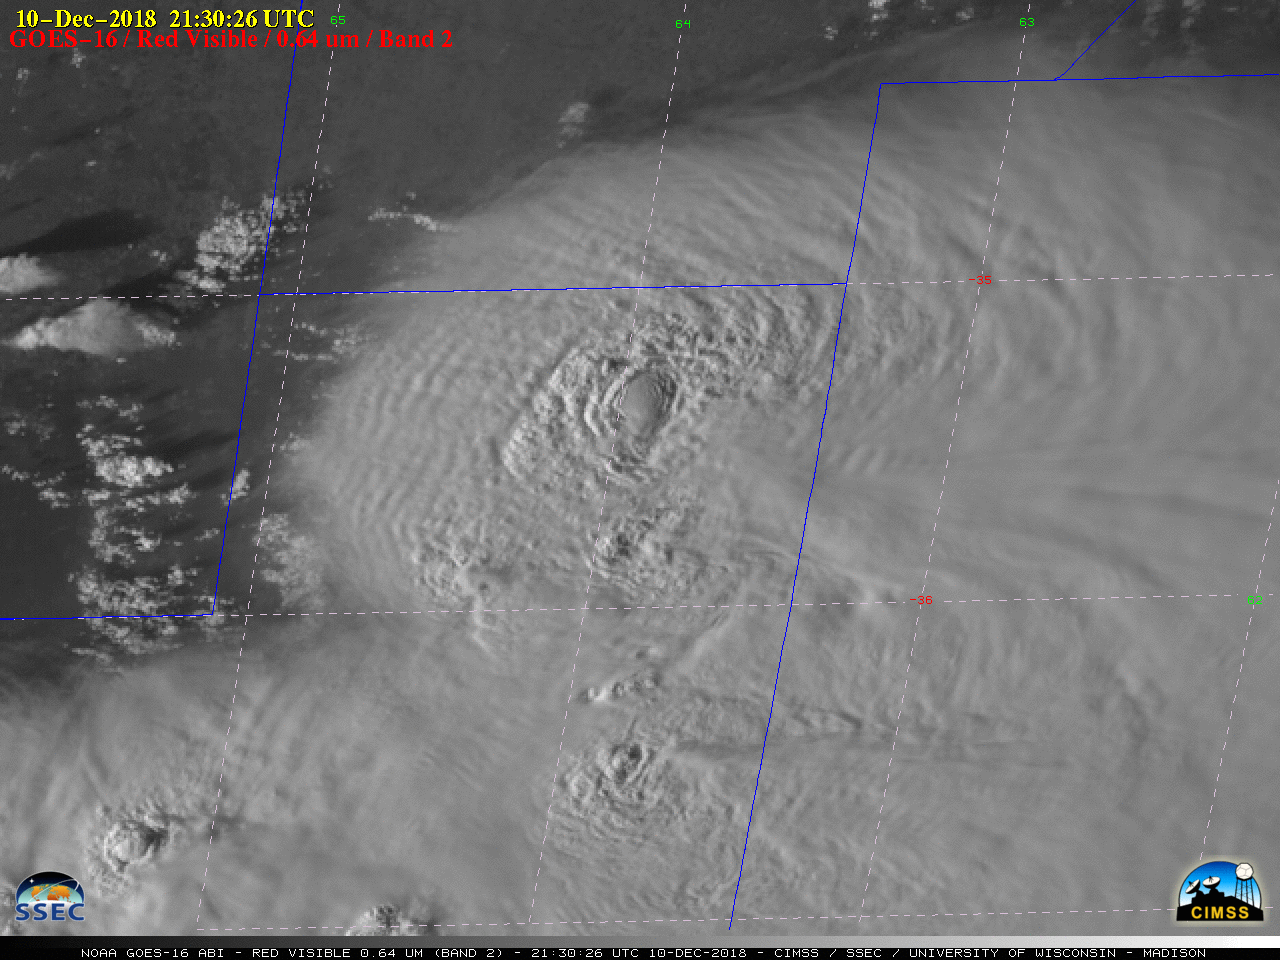
A similar comparison of GOES-16 Visible and Near-Infrared “Snow/Ice” (
1.61 µm) images
(below) helped to highlight the formation of multiple
Above-Anvil Cirrus Plume (AACP) features, which are signatures of thunderstorms that are producing (or could soon be producing) severe weather such as tornadoes, large hail or damaging winds. The appearance of gravity waves upshear (west) of the overshooting top was also very apparent.
![GOES-16 "Red" Visible (0.64 µm, top) and Near-Infrared "Snow/Ice" (1.61 µm, bottom) images [click to play MP4 animation]](https://cimss.ssec.wisc.edu/satellite-blog/wp-content/uploads/sites/5/2018/12/G16_VIS_NIR_ARGENTINA_10DEC2018_2018344_213326_GOES-16_0002PANELS.GIF)
GOES-16 “Red” Visible (0.64 µm, top) and Near-Infrared “Snow/Ice” (1.61 µm, bottom) images [click to play MP4 animation]
![Plot of severe weather reports [click to enlarge]](https://cimss.ssec.wisc.edu/satellite-blog/wp-content/uploads/sites/5/2018/12/181210_public_severe_weather_reports_Argentina.png)
Plot of severe weather reports [click to enlarge]
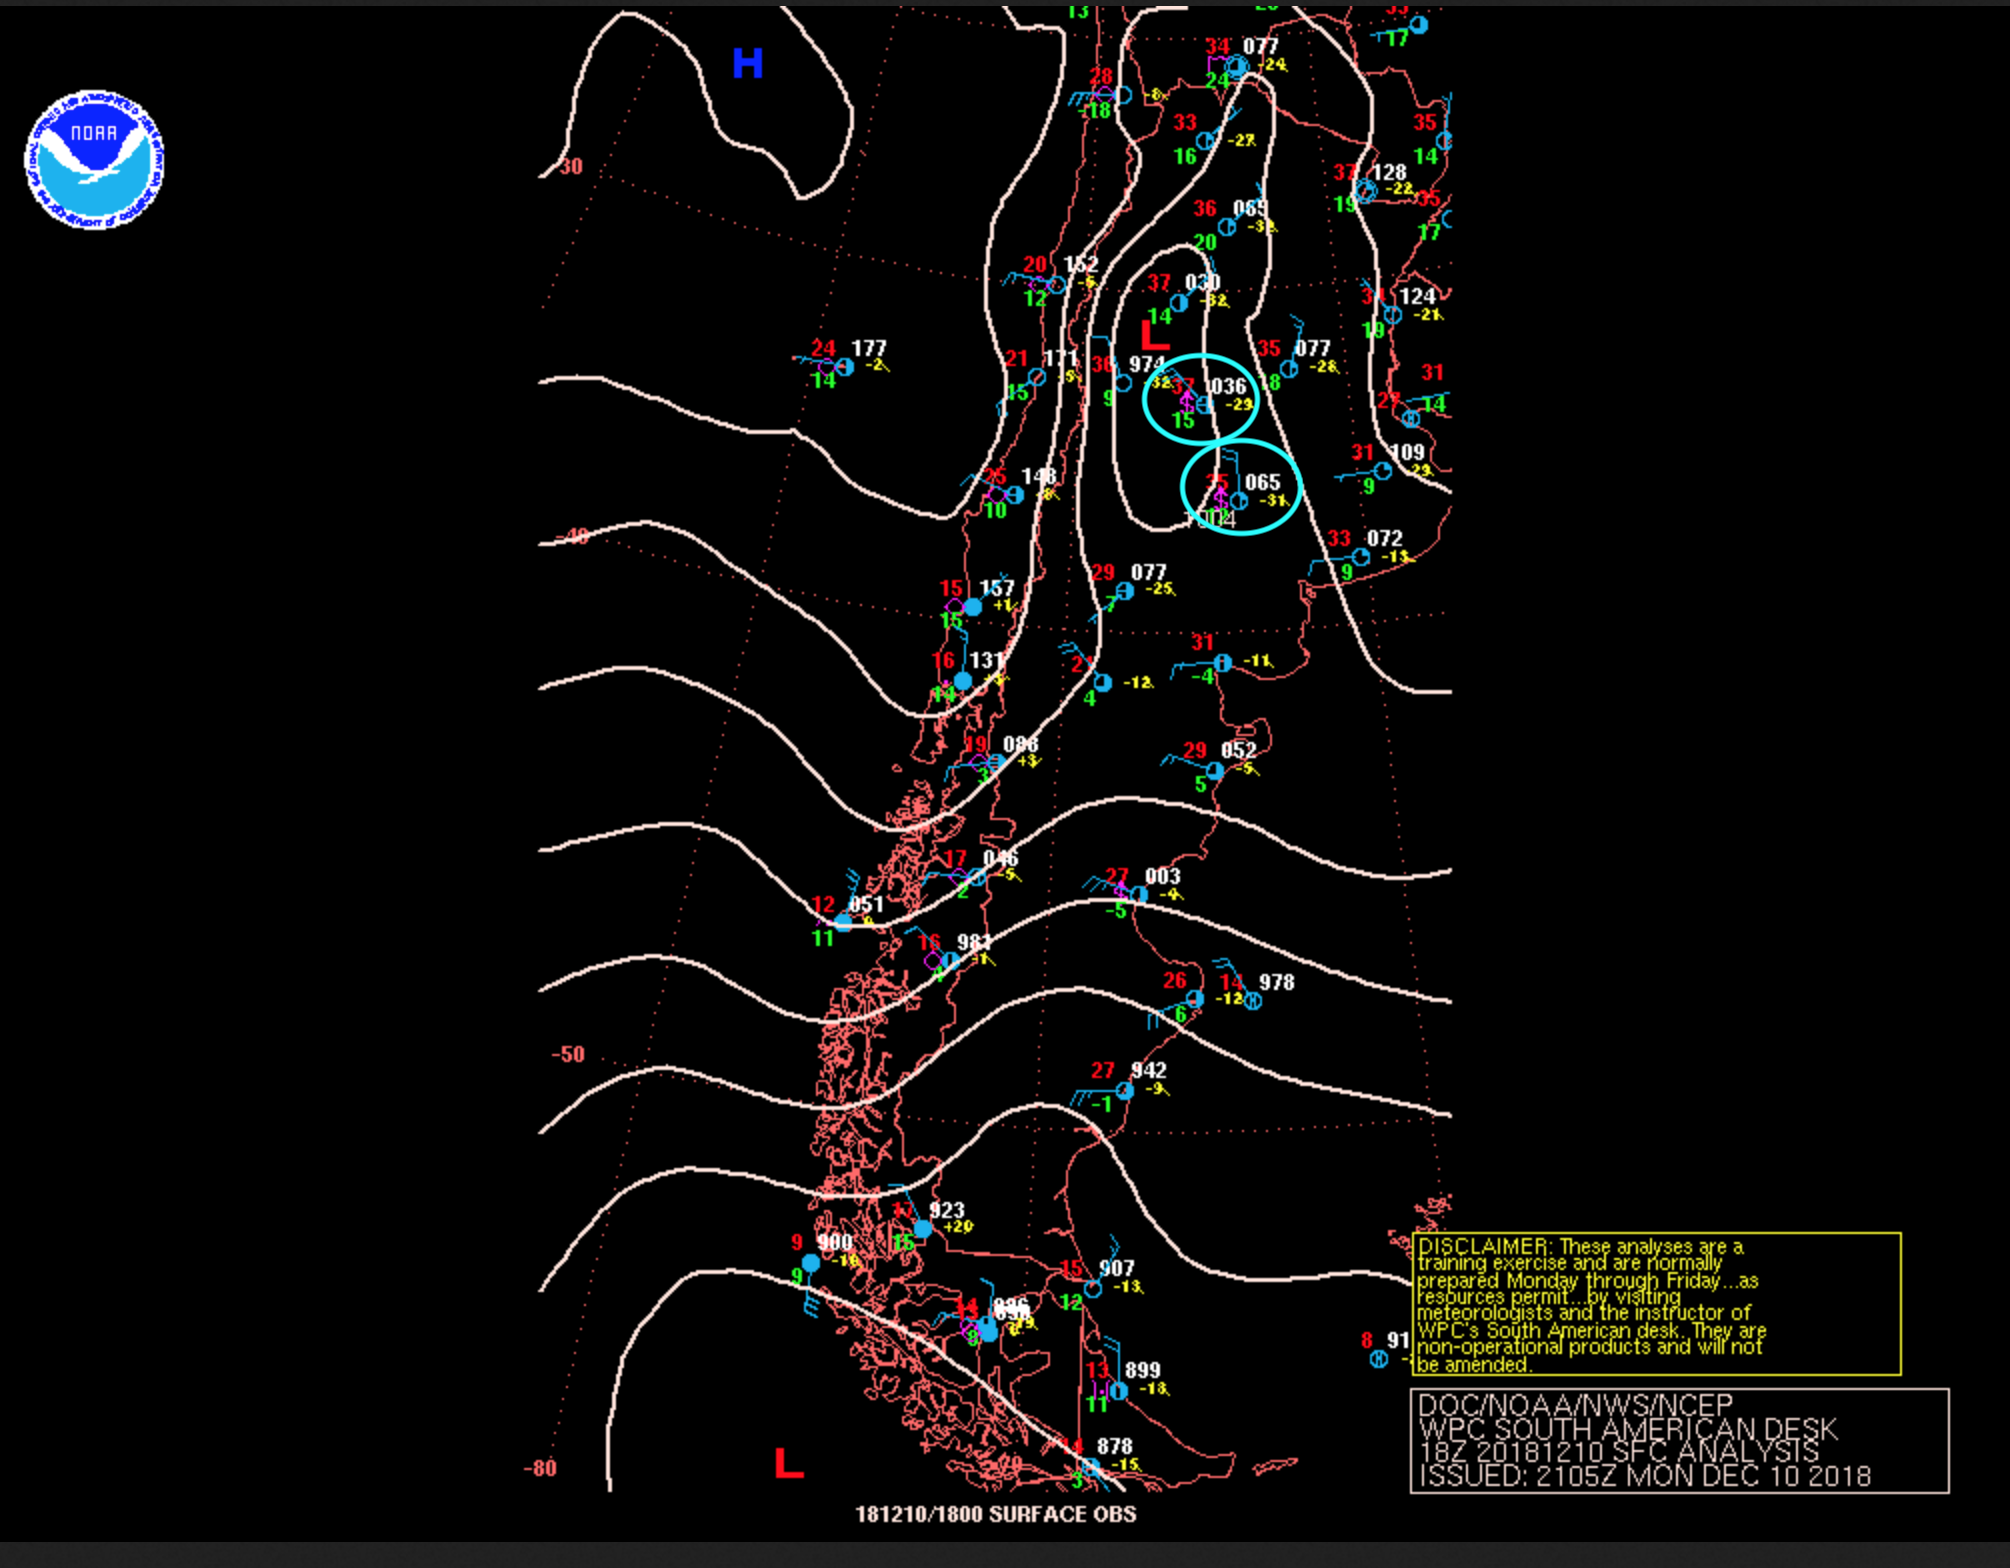
There were several reports of hail with these particular thunderstorms
(above), concentrated in the area between 35-36º S latitude and 62-65º W longitude. GOES-16 Visible images
(below) showed this was the area under the path of the more northern storm with the prolonged overshooting top and the prominent AACP. This convection produced very large hail in
Ingeniero Luiggi and General Villegas (located at 35.5º S, 64.5º W and 35º S, 63º W respectively) — see the tweets below for photos. On a side note, the large overshooting top began to take on an unusual
darker gray appearance after 2230 UTC, possibly suggesting that boundary layer dust or particulate matter was being lofted to the cloud top by the very intense and long-lived updraft — the
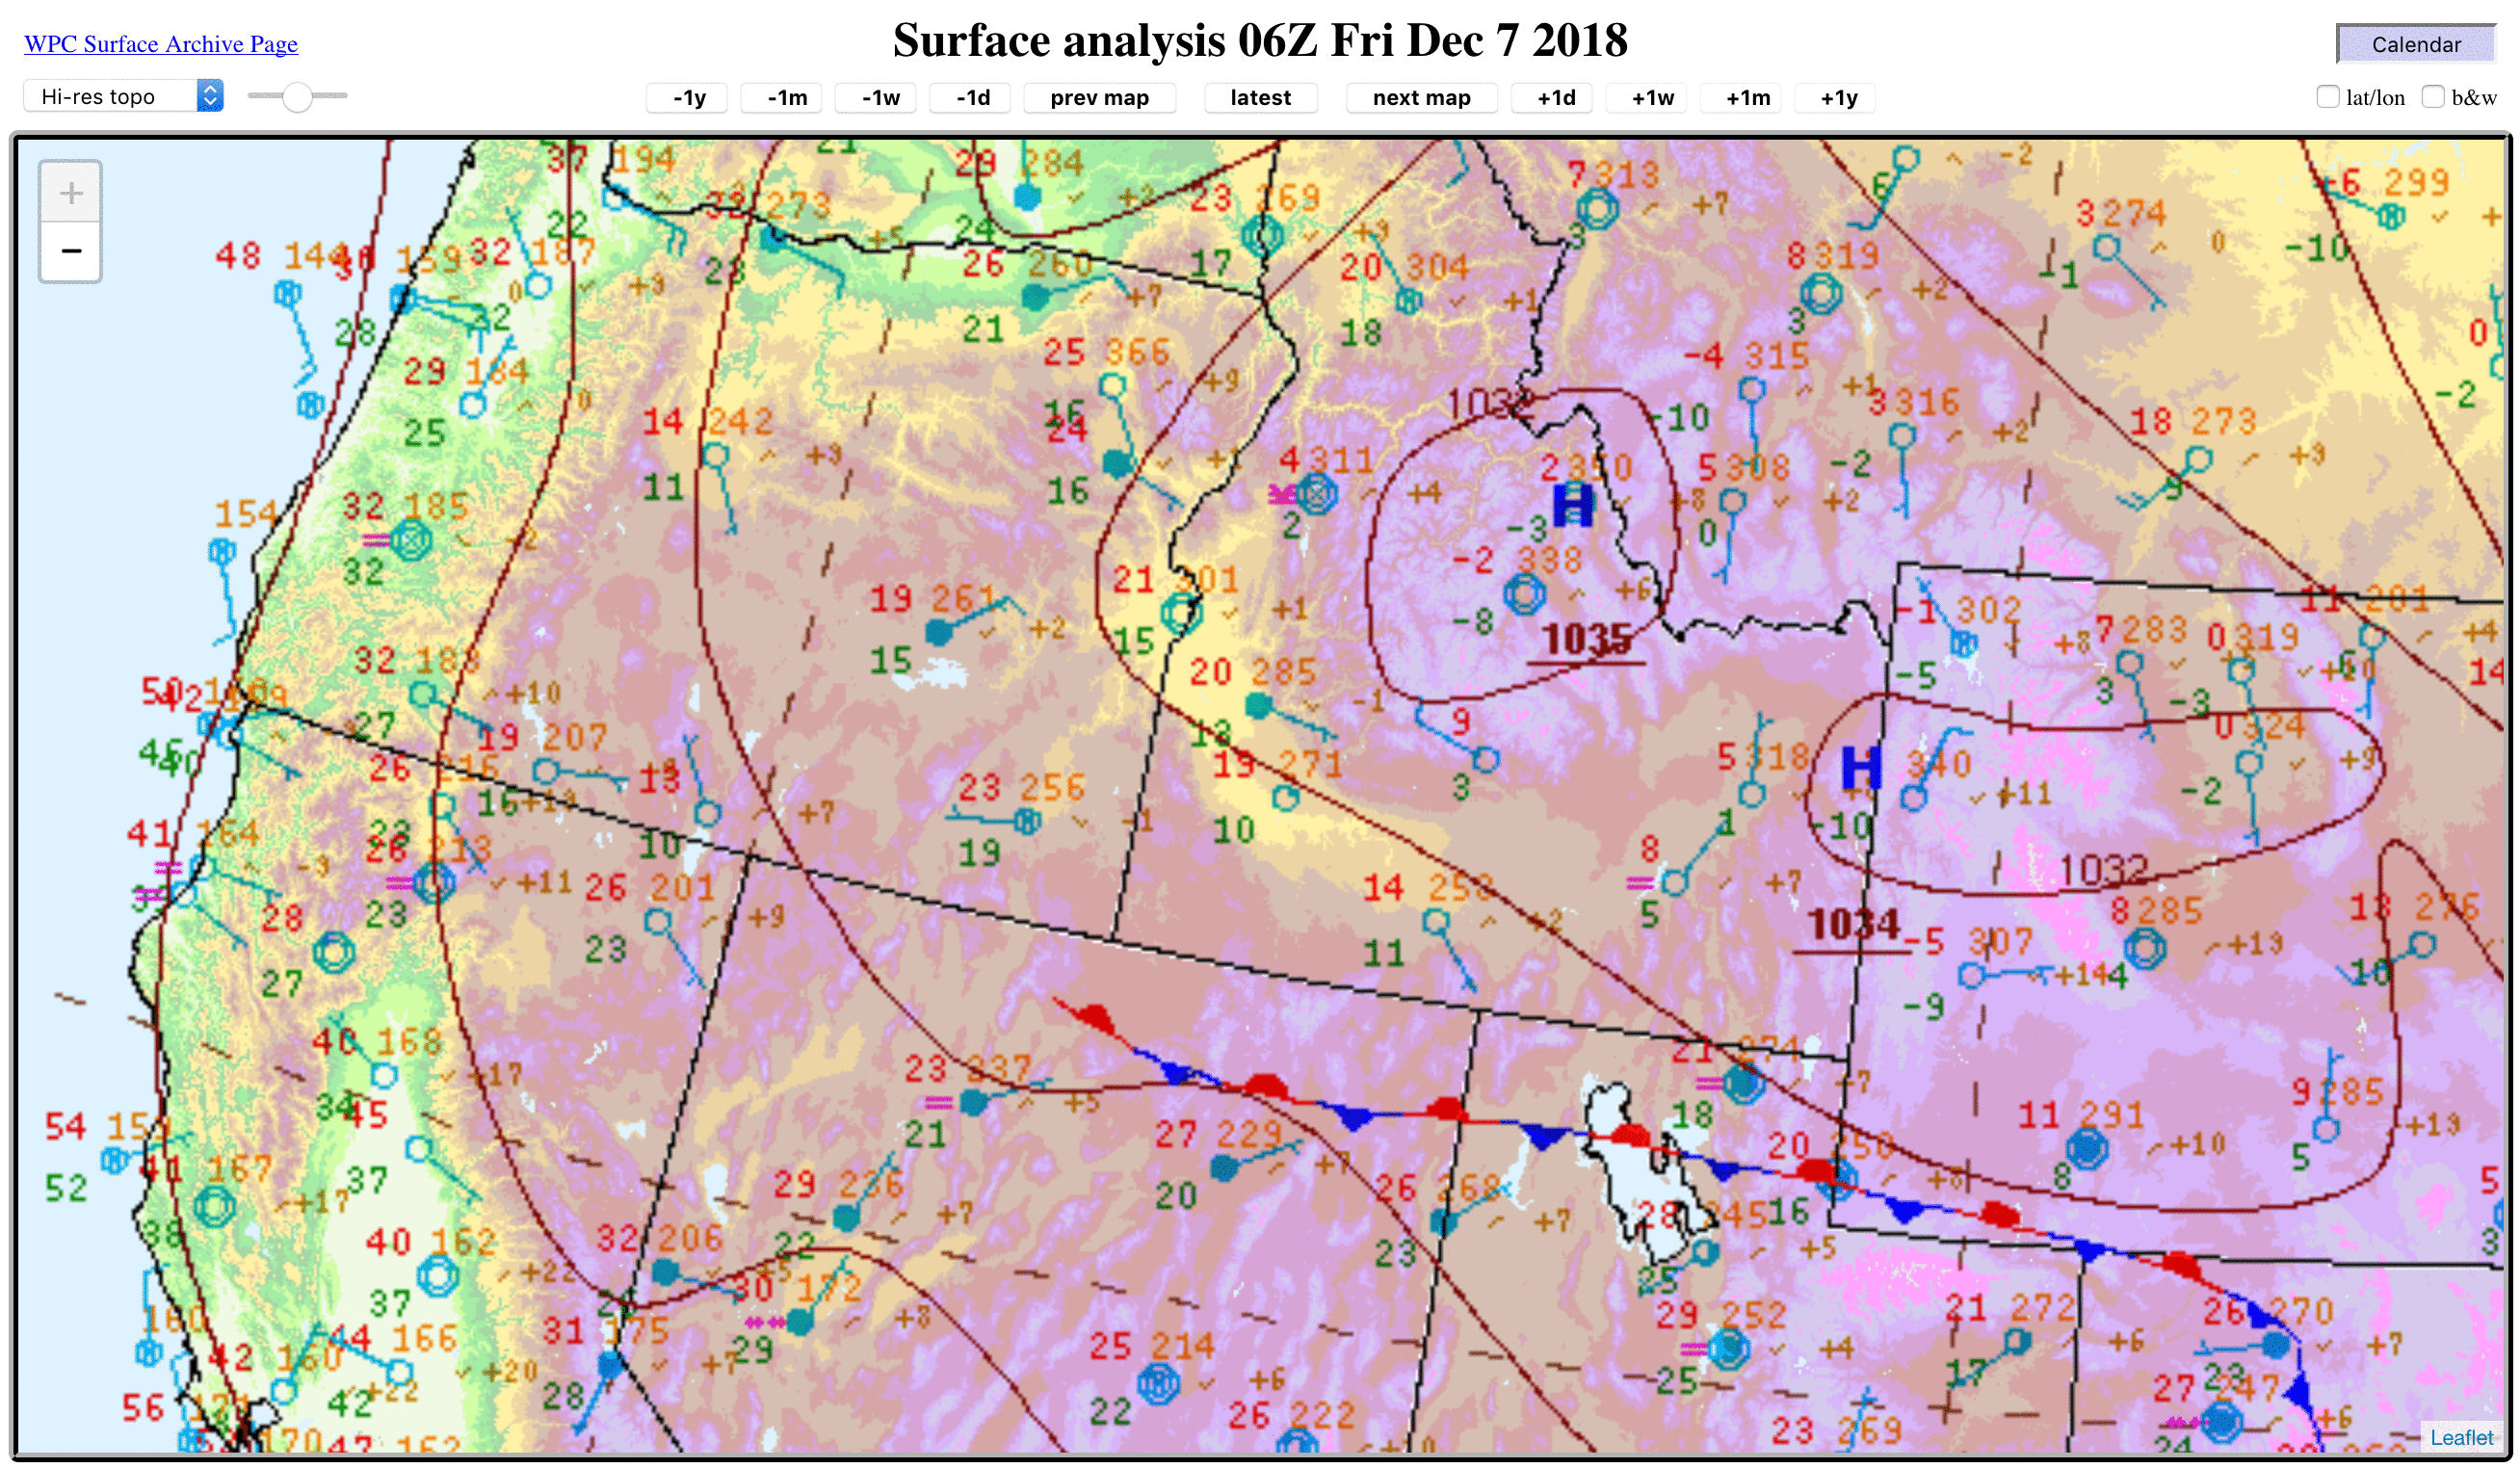
18 UTC surface analysis showed that sites northwest of and south of the developing storms were reporting blowing dust.
GOES-16 “Red” Visible (0.64 µm) images [click to play MP4 animation]
Additional GOES-16 animations of these storms can be found on the
Satellite Liaison Blog.
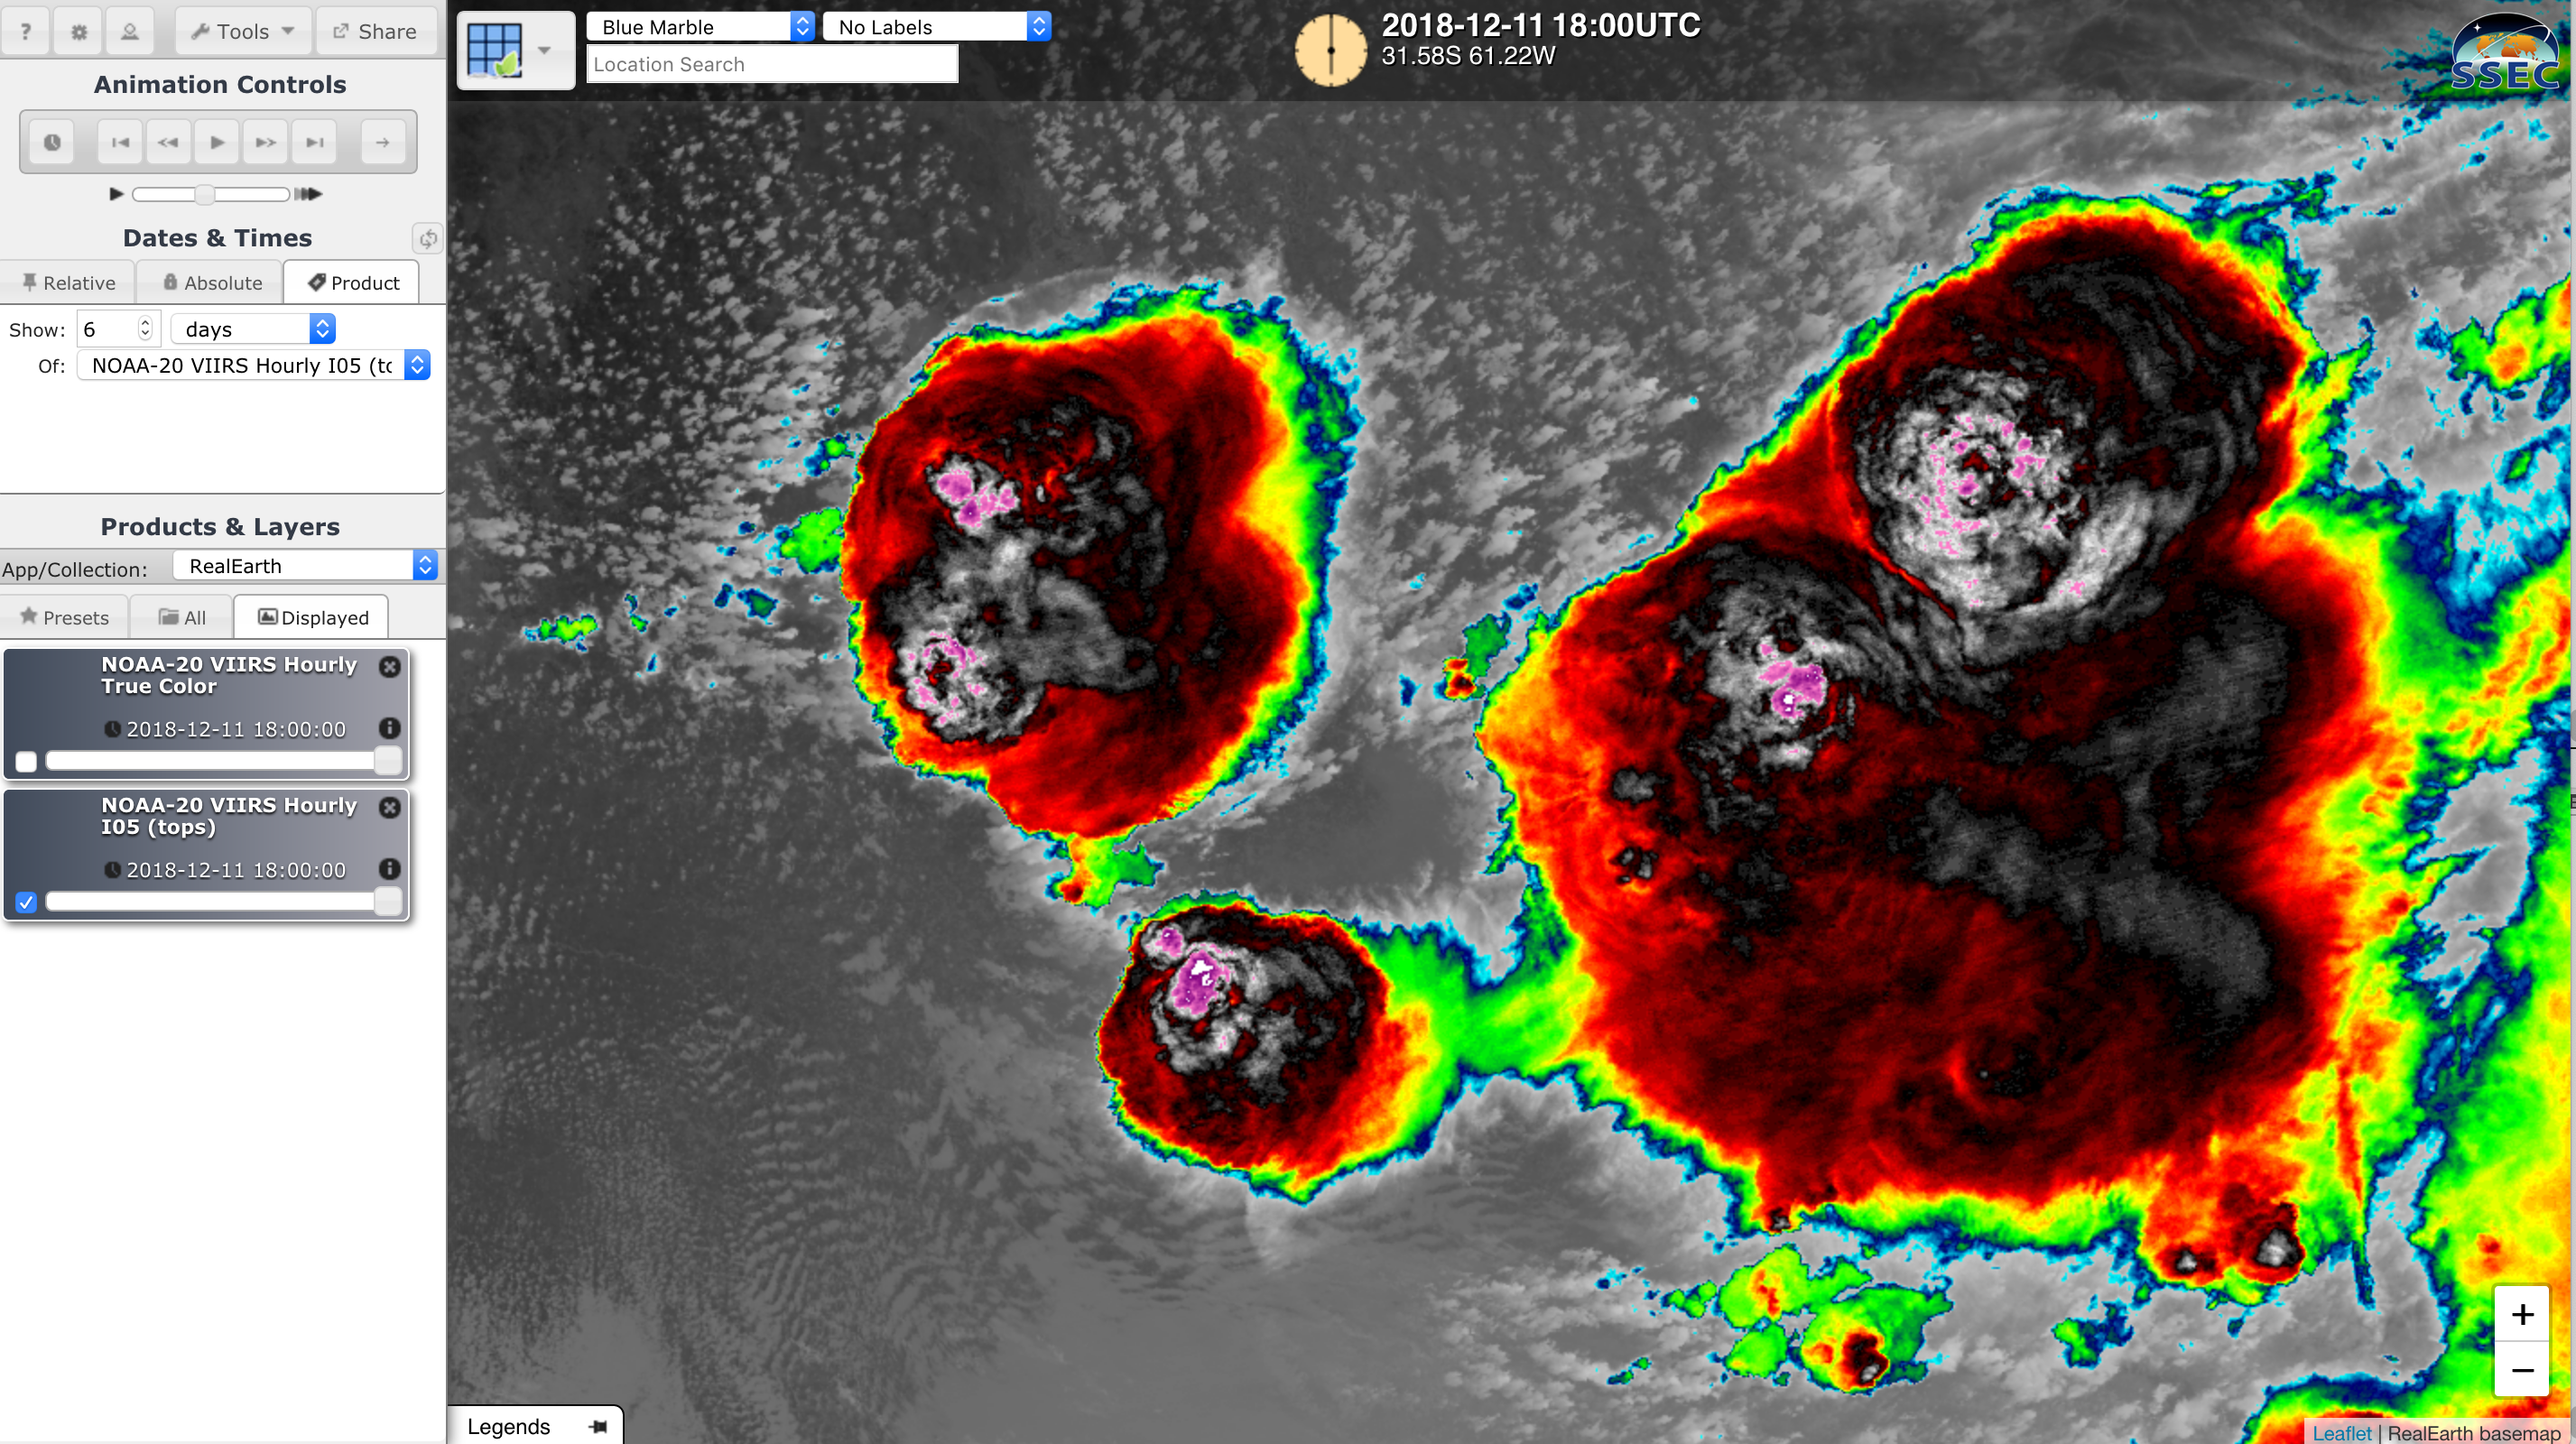
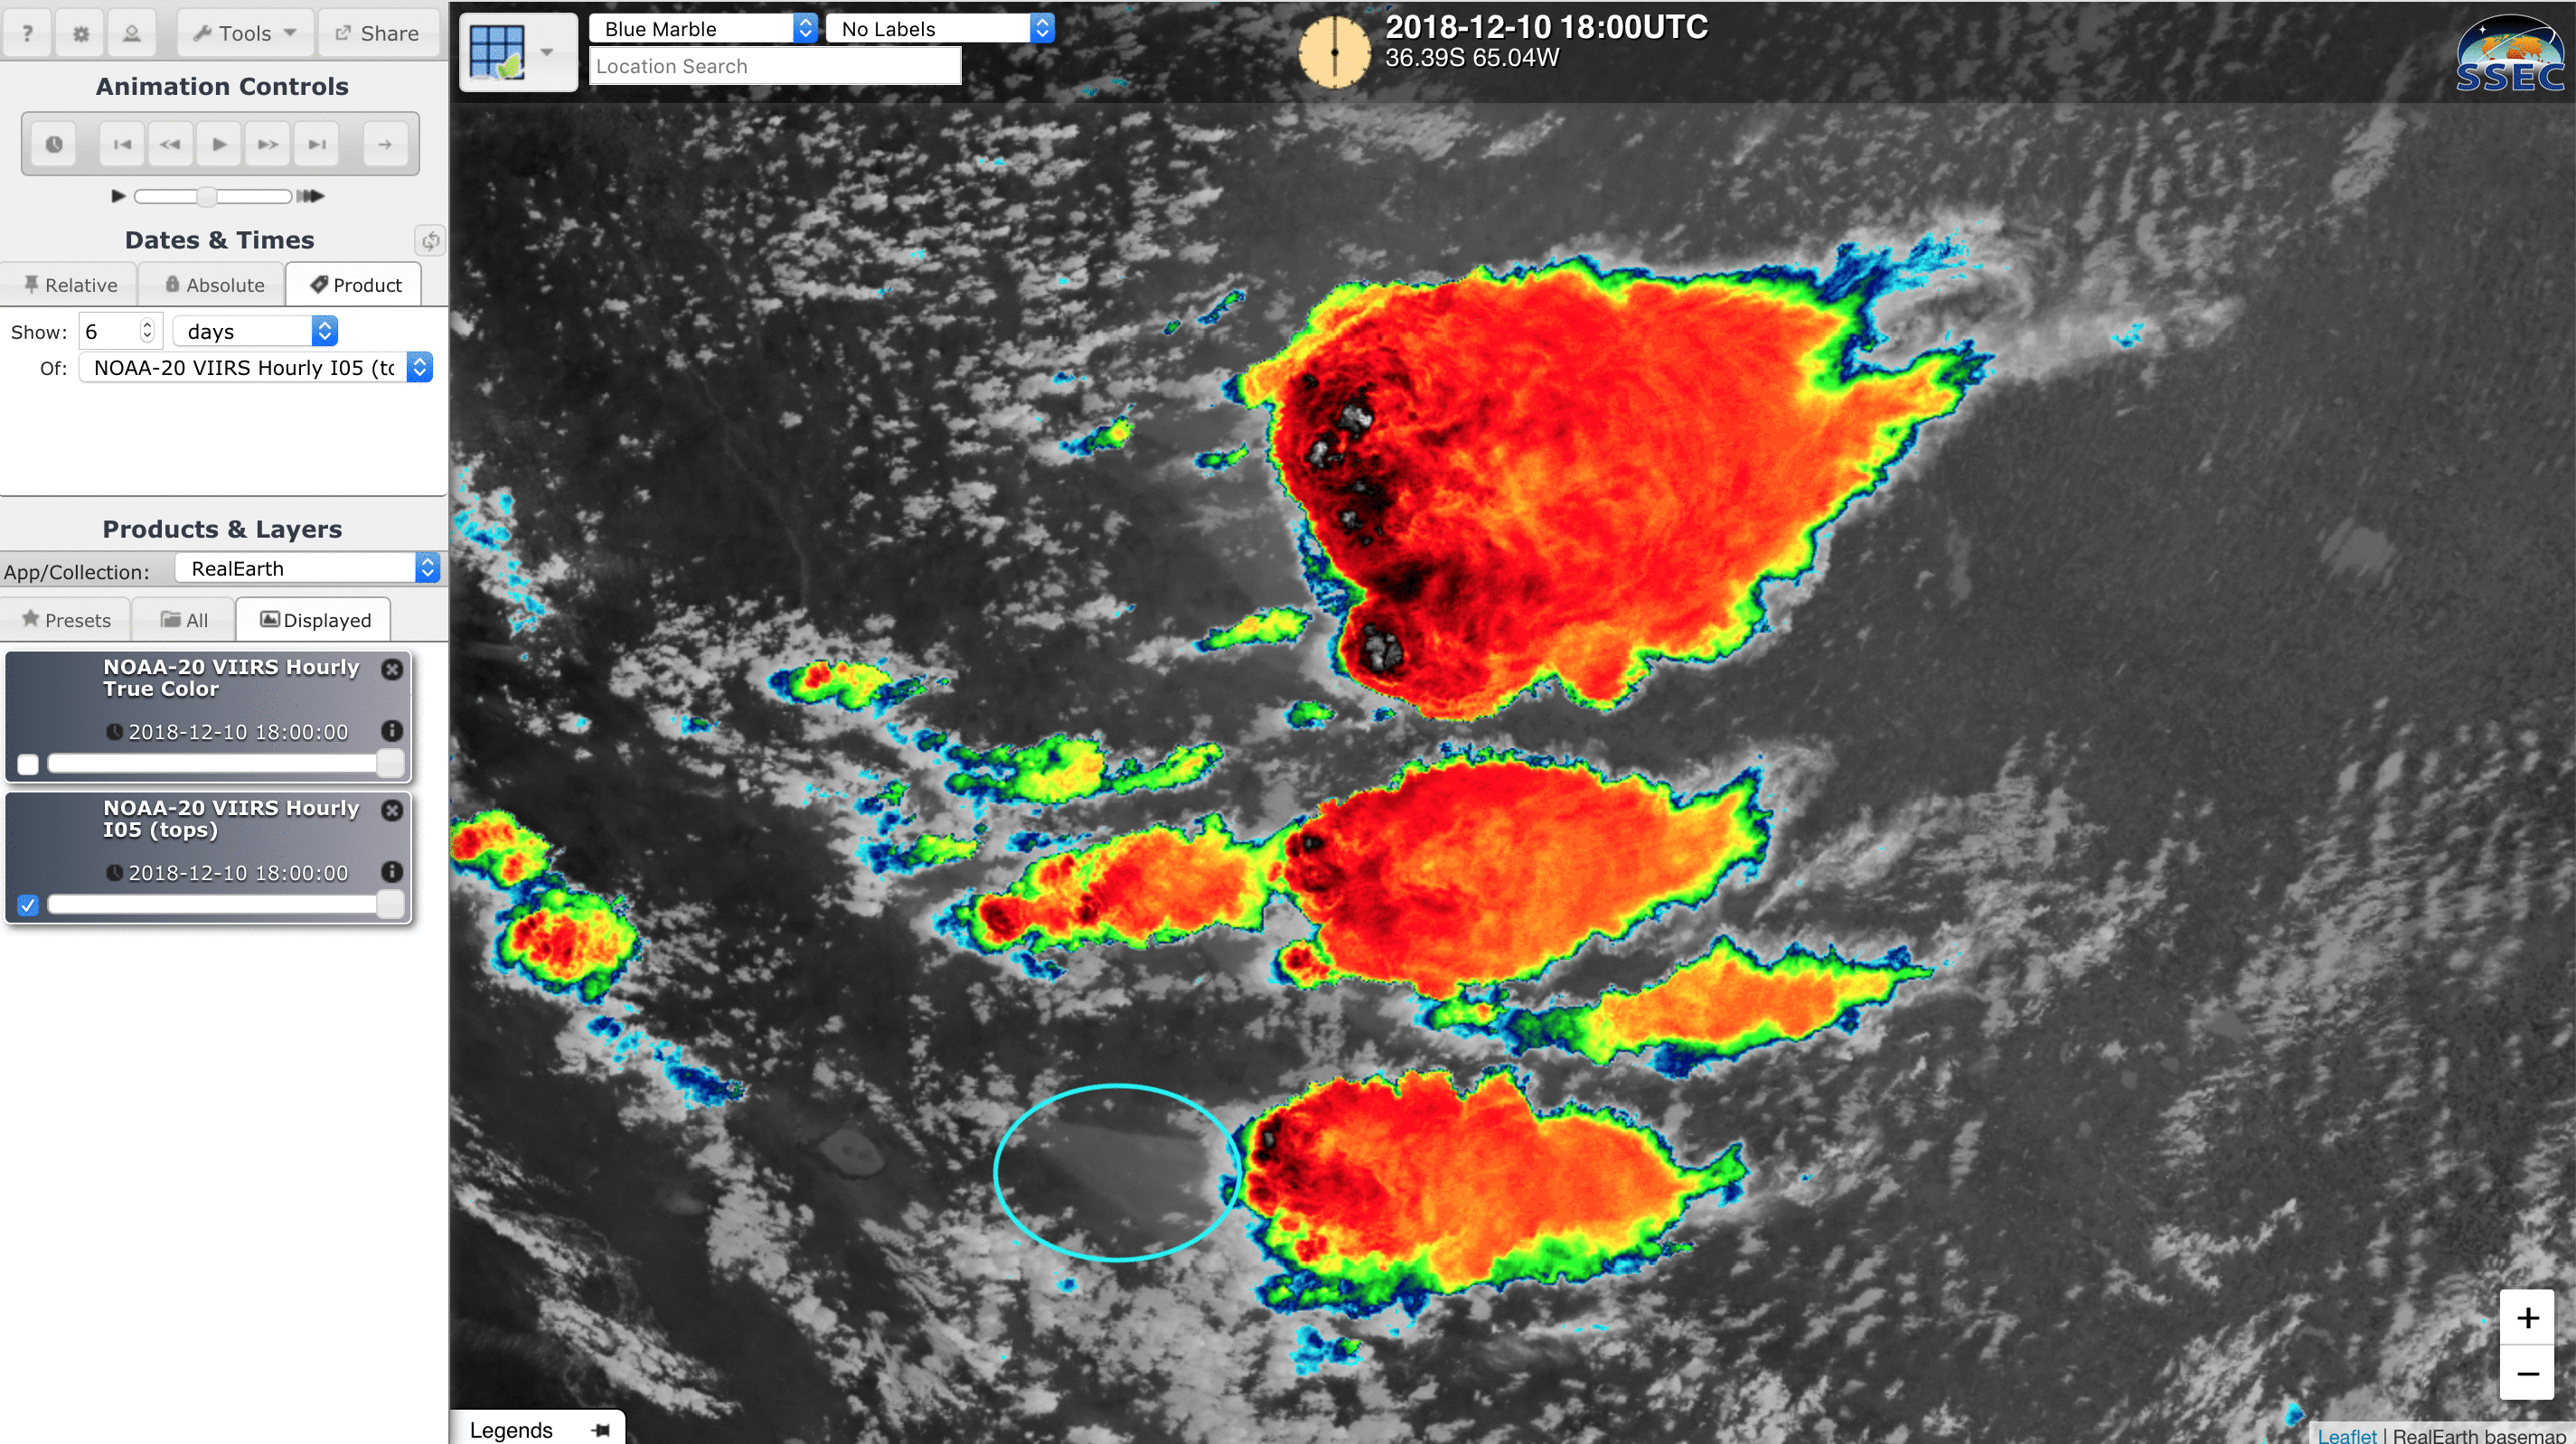
A zoom-in of NOAA-20 VIIRS True Color Red-Green-Blue (RGB) imagery at 1835 UTC viewed using RealEarth (below) showed the 3 discrete thunderstorms in the vicinity of Santa Rosa.
![NOAA-20 VIIRS True Color RGB image at 1835 UTC [click to enlarge]](https://cimss.ssec.wisc.edu/satellite-blog/wp-content/uploads/sites/5/2018/12/181210_1835utc_noaa20_truecolor_zoom_Argentina_anim.gif)
NOAA-20 VIIRS True Color RGB image at 1835 UTC [click to enlarge]
A toggle between NOAA-20 VIIRS True Color RGB and Infrared Window (11.45 µm) images at 1835 UTC
(below) revealed the cold overshooting tops associated with each of the 3 thunderstorms. Also note the
swath of wet soil in the wake of the southern storm, which appears
darker in the True Color image and cooler
(lighter shades of gray) in the Infrared image.
![NOAA-20 VIIRS True Color RGB and Infrared Window (11.45 µm) images at 1835 UTC [click to enlarge]](https://cimss.ssec.wisc.edu/satellite-blog/wp-content/uploads/sites/5/2018/12/181210_1835utc_noaa20_truecolor_infrared_zoom_Argentina_anim.gif)
NOAA-20 VIIRS True Color RGB and Infrared Window (11.45 µm) images at 1835 UTC [click to enlarge]
A toggle between NOAA-20 VIIRS Infrared Window (11.45 µm) images at 1835 UTC on 10 December and 0555 UTC on 11 December
(below) showed the upscale growth into a large Mesoscale Convective System (MCS) that moved northeastward (eventually producing flooding in Rosario).
![NOAA-20 VIIRS Infrared Window (11.45 µm) images at 1835 UTC on 10 December and 0555UTC on 11 December [click to enlarge]](https://cimss.ssec.wisc.edu/satellite-blog/wp-content/uploads/sites/5/2018/12/181210_1835utc_181211_0555utc_noaa20_viirs_infrared_Argentina_anim.gif)
NOAA-20 VIIRS Infrared Window (11.45 µm) images at 1835 UTC on 10 December and 0555 UTC on 11 December [click to enlarge]
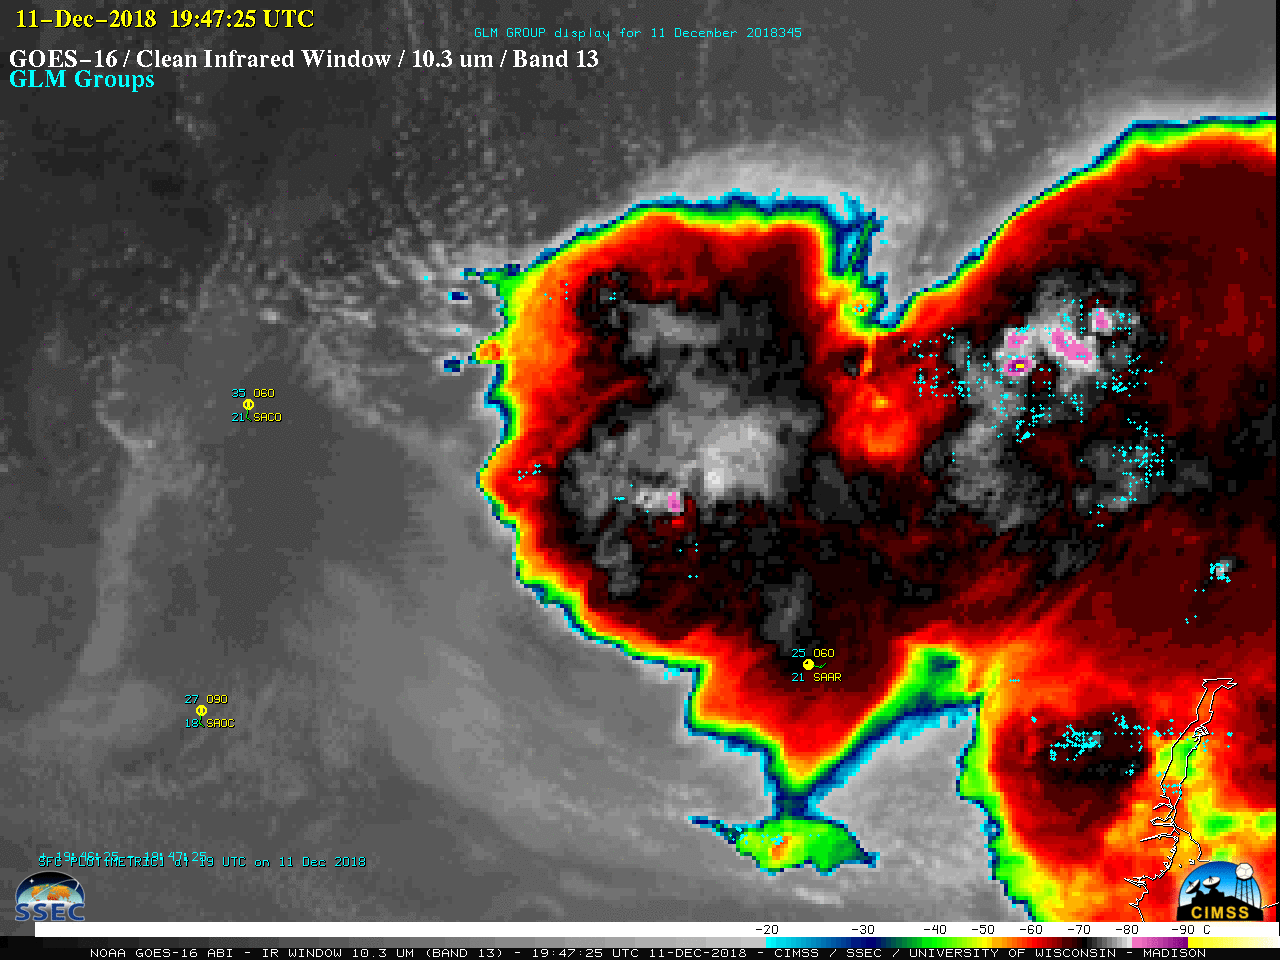
===== 11 December Update =====
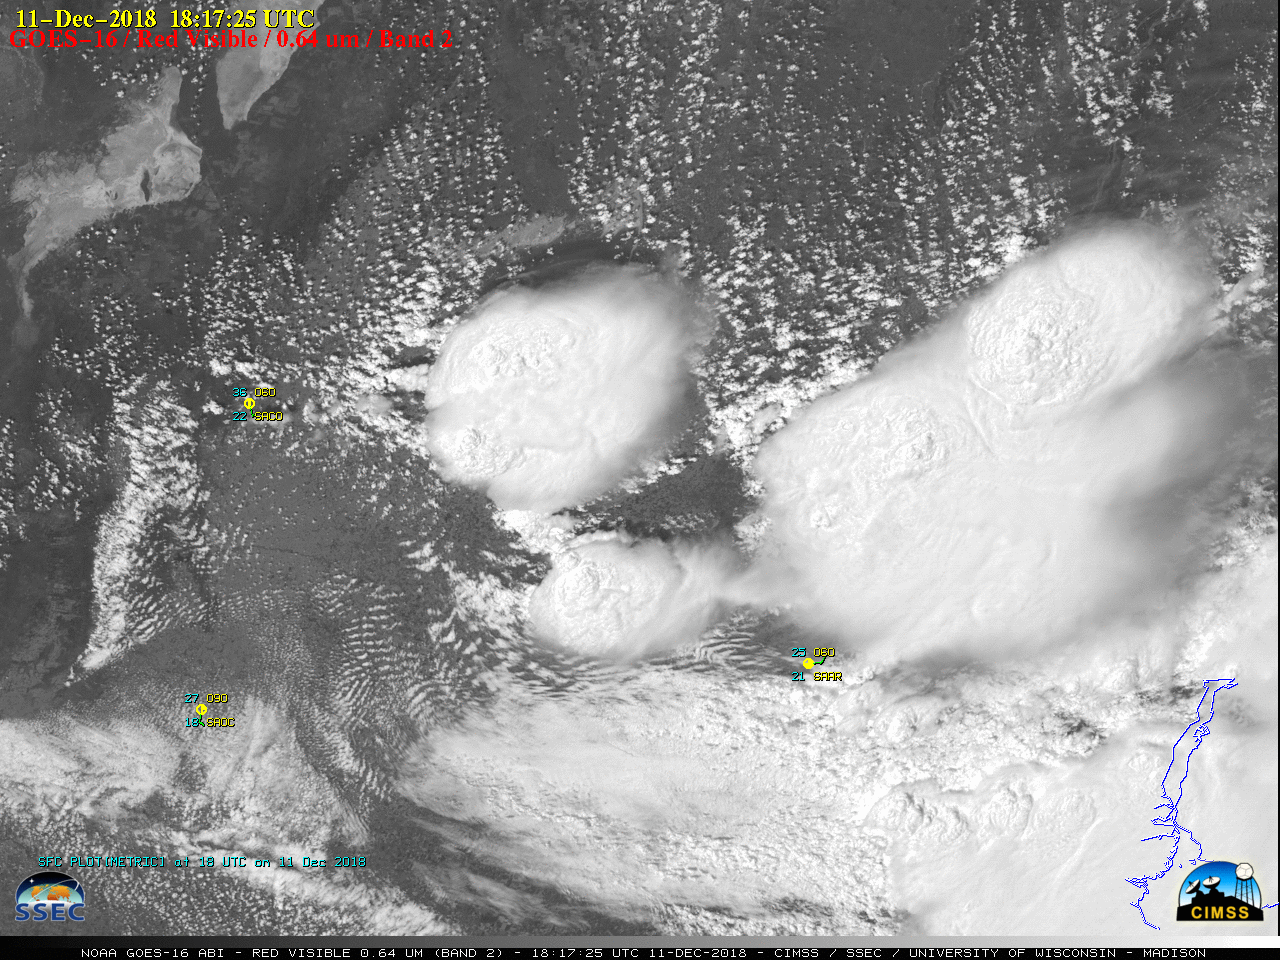
GOES-16 “Red” Visible (0.64 µm) images [click to play MP4 animation]
On the following day, GOES-16 Visible images
(above) showed that additional severe thunderstorms developed across northern Argentina, in the general vicinity of a stationary front (
surface analyses) east of Cordoba (SACO). Plots of GLM Groups
(below) indicated that these storms produced a great deal of lightning.
![GOES-16 "Red" Visible (0.64 µm) images, with GLM Groups plotted in red [click to play MP4 animation]](https://cimss.ssec.wisc.edu/satellite-blog/wp-content/uploads/sites/5/2018/12/G16_VIS_GLM_ARGENTINA_11DEC2018_2018345_181725_GOES-16_0001PANEL.GIF)
GOES-16 “Red” Visible (0.64 µm) images, with GLM Groups plotted in red [click to play MP4 animation]
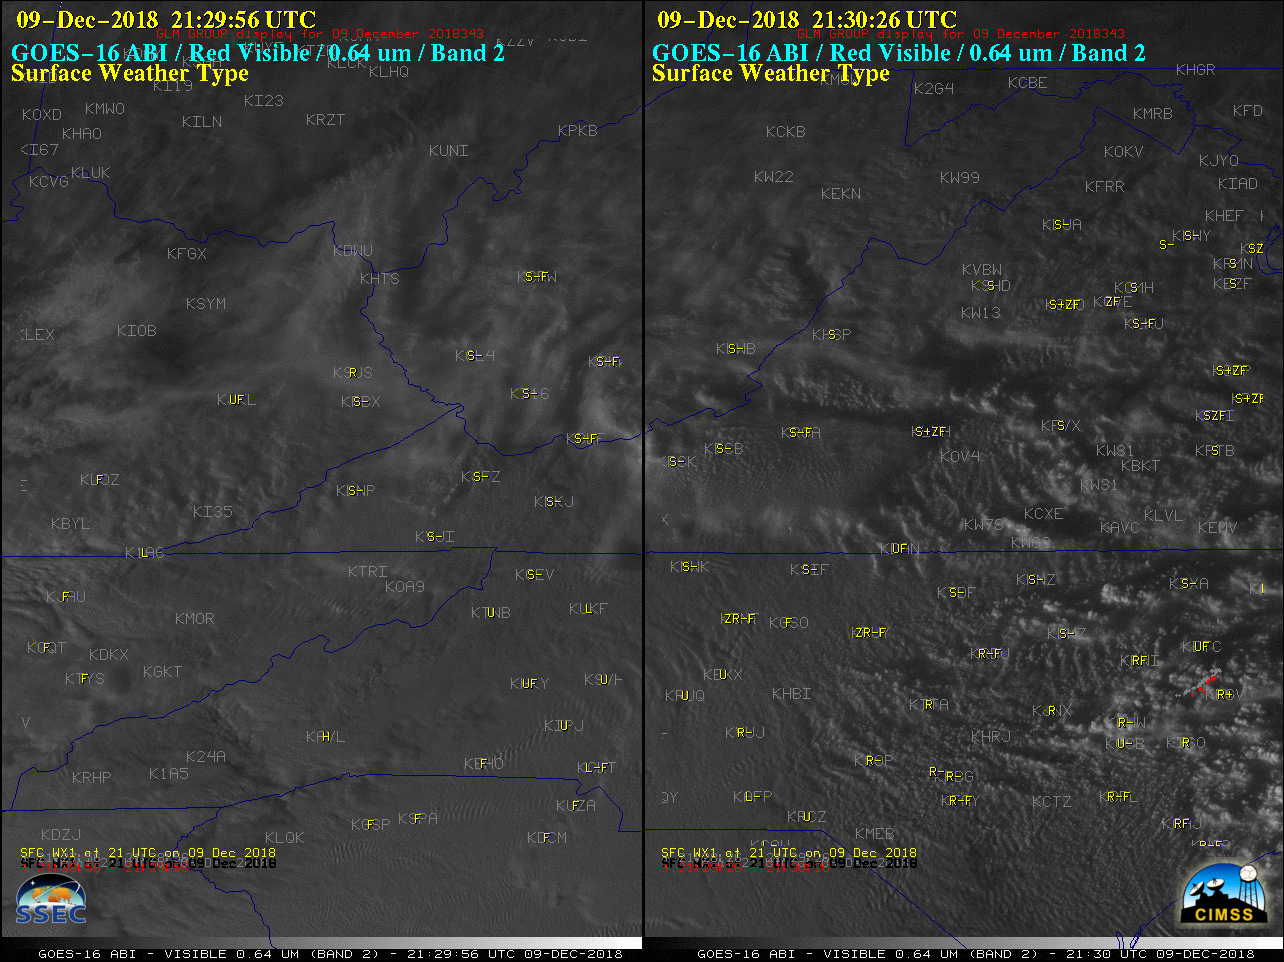
The corresponding GOES-16 Infrared images, with and without plots of GLM Groups, are shown below. The coldest cloud-top infrared brightness temperatures were frequently colder than -80ºC, even reaching -90ºC
(yellow pixels embedded within darker purple areas) from
1946,
1947 and
1948 UTC.
![GOES-16 "Clean" Infrared Window (10.3 µm) images [click to play MP4 animation]](https://cimss.ssec.wisc.edu/satellite-blog/wp-content/uploads/sites/5/2018/12/G16_IR_ARGENTINA_11DEC2018_2018345_181725_GOES-16_0001PANEL.GIF)
GOES-16 “Clean” Infrared Window (10.3 µm) images [click to play MP4 animation]
![GOES-16 "Clean" Infrared Window (10.3 µm) images, with GLM Groups plotted cyan [click to play MP4 animation]](https://cimss.ssec.wisc.edu/satellite-blog/wp-content/uploads/sites/5/2018/12/G16_IR_GLM_ARGENTINA_11DEC2018_2018345_181725_GOES-16_0001PANEL.GIF)
GOES-16 “Clean” Infrared Window (10.3 µm) images, with GLM Groups plotted cyan [click to play MP4 animation]
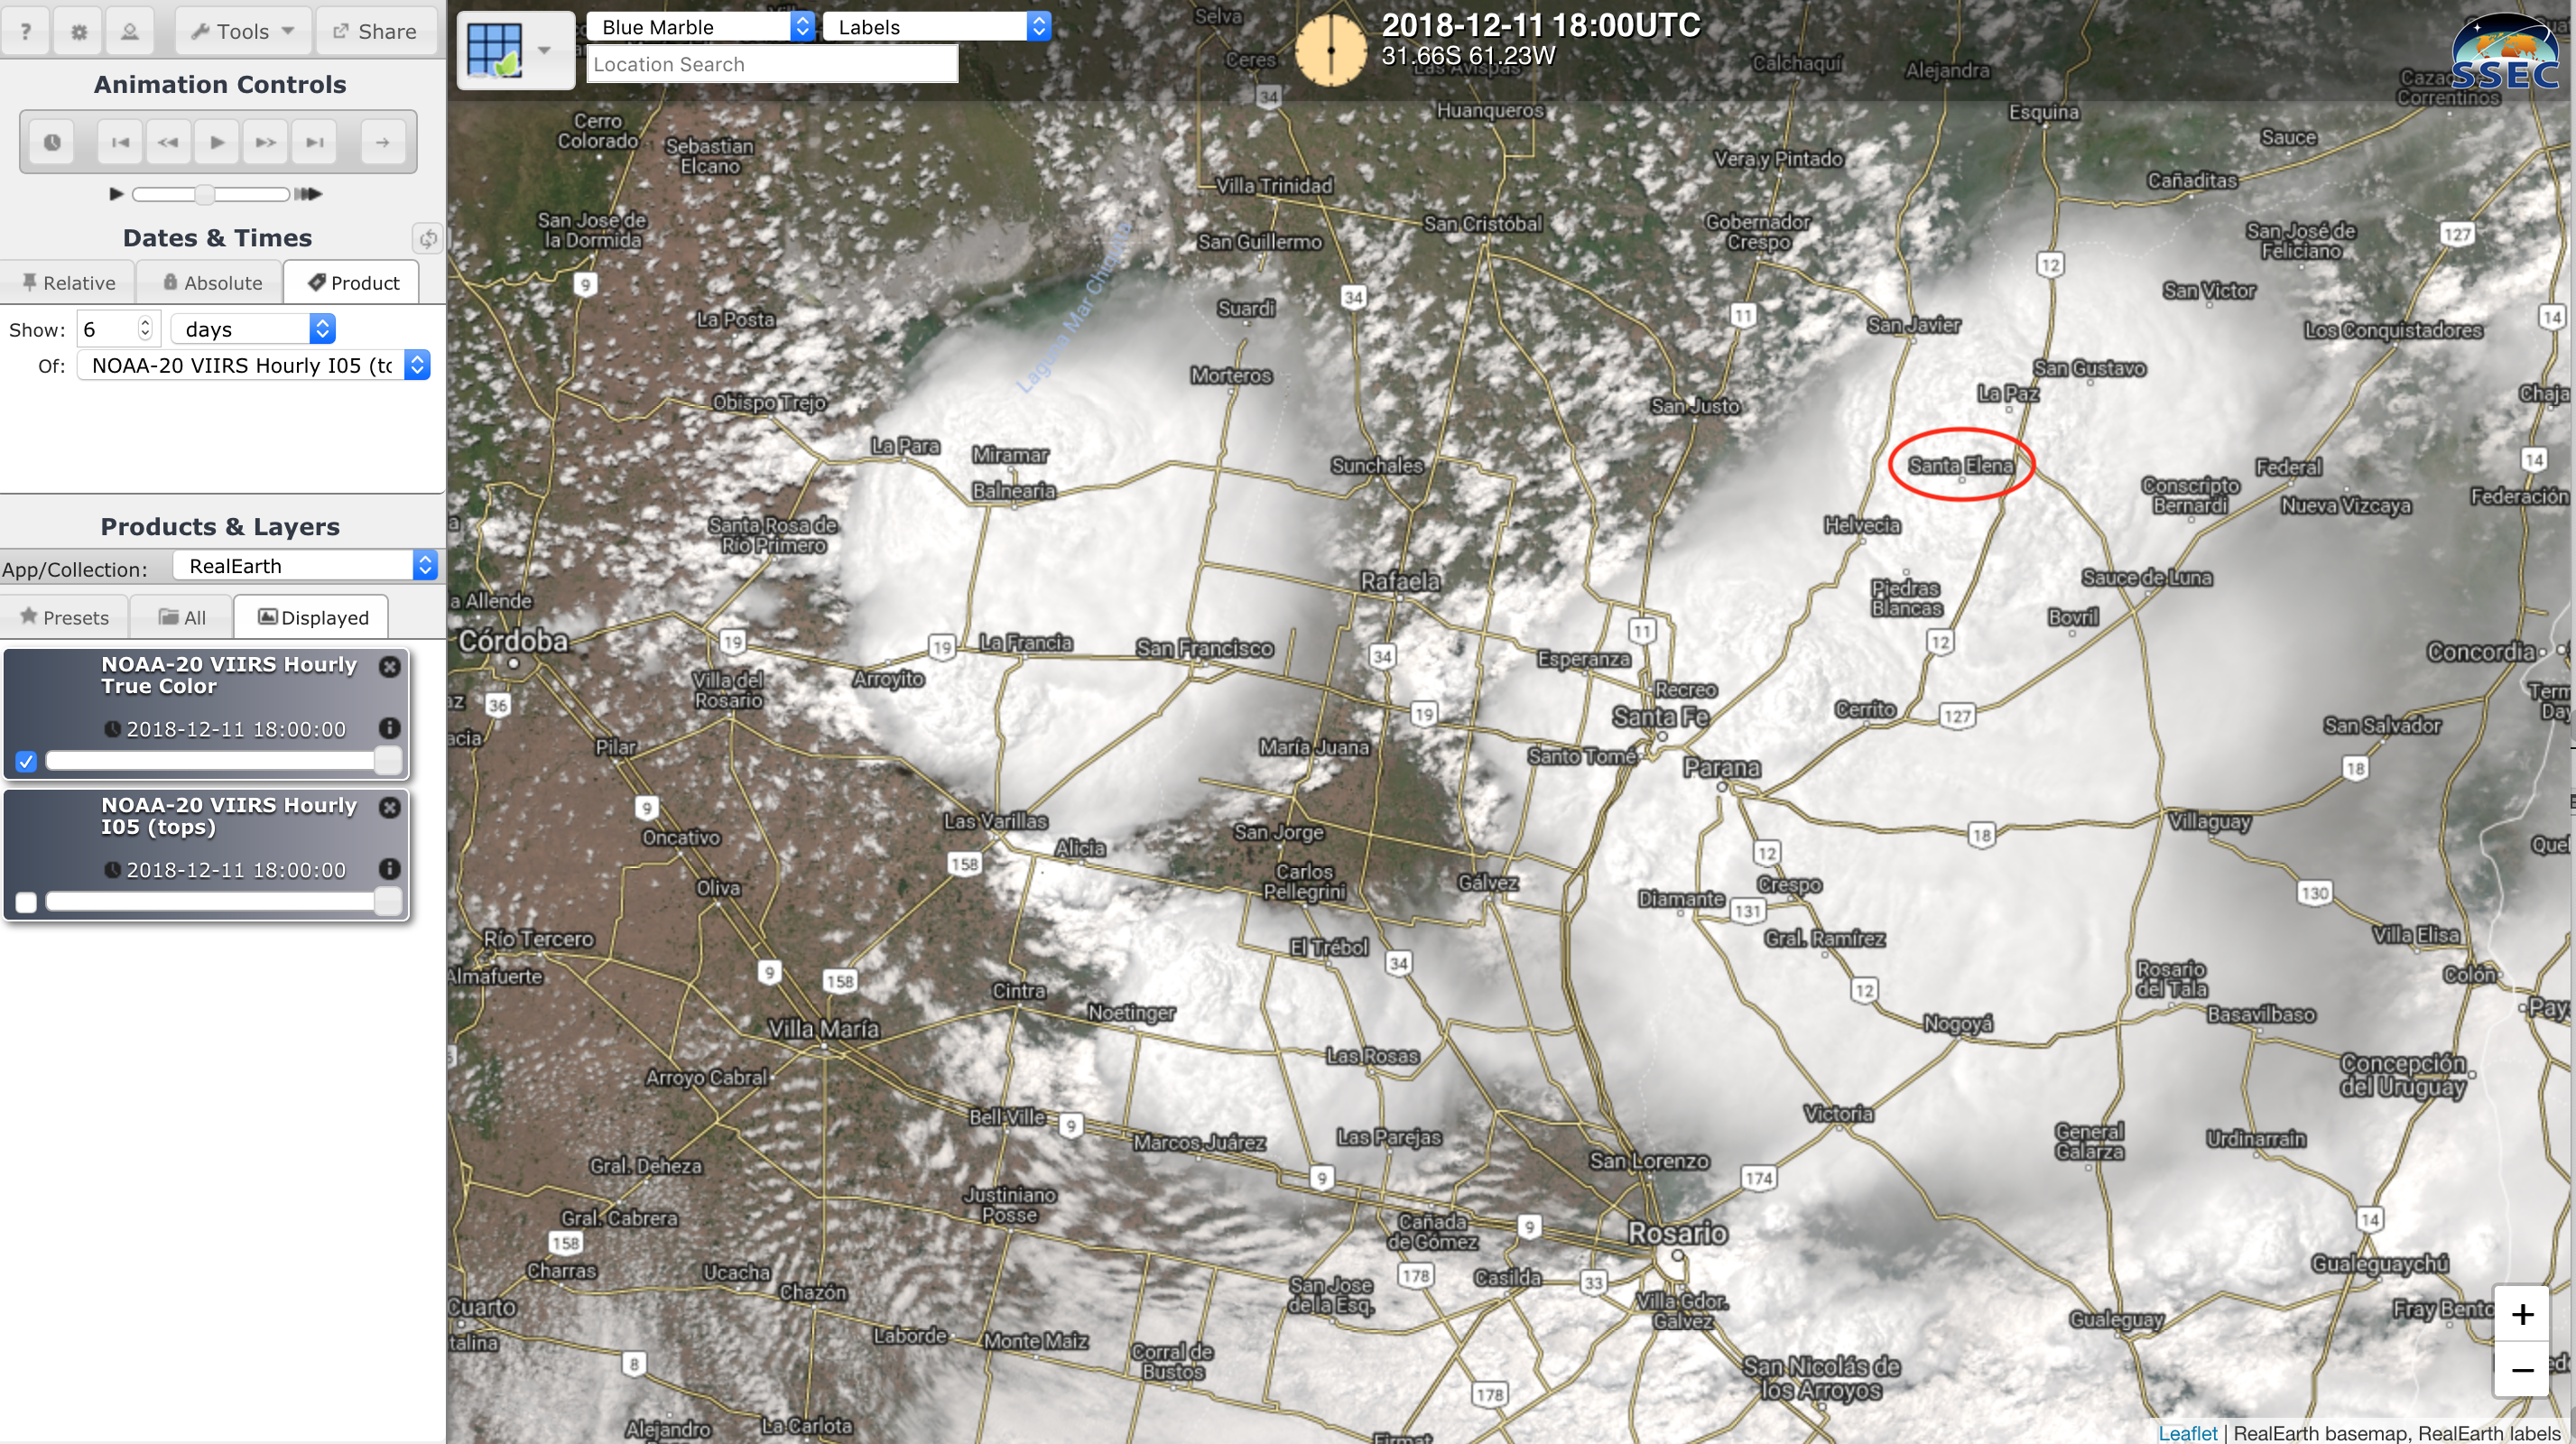
A NOAA-20 VIIRS True Color RGB image
(below) showed the cluster of thunderstorms east of Cordoba at 1817 UTC.
![NOAA-20 VIIRS True Color RGB image at 1817 UTC [click to enlarge]](https://cimss.ssec.wisc.edu/satellite-blog/wp-content/uploads/sites/5/2018/12/181211_1817utc_noaa20_viirs_truecolor_Argentina_anim.gif)
NOAA-20 VIIRS True Color RGB image at 1817 UTC [click to enlarge]
A toggle between NOAA-20 VIIRS True Color RGB and Infrared Window (11.45 µm) images at 1817 UTC
(below) showed the easternmost storm which produced a tornado at
Santa Elena.
![NOAA-20 VIIRS True Color RGB and Infrared Window (11.45 µm) images at 1817 UTC [click to enlarge]](https://cimss.ssec.wisc.edu/satellite-blog/wp-content/uploads/sites/5/2018/12/181211_1817utc_noaa20_viirs_truecolor_infrared_Argentina_anim.gif)
NOAA-20 VIIRS True Color RGB and Infrared Window (11.45 µm) images at 1817 UTC [click to enlarge]
View only this post
Read Less
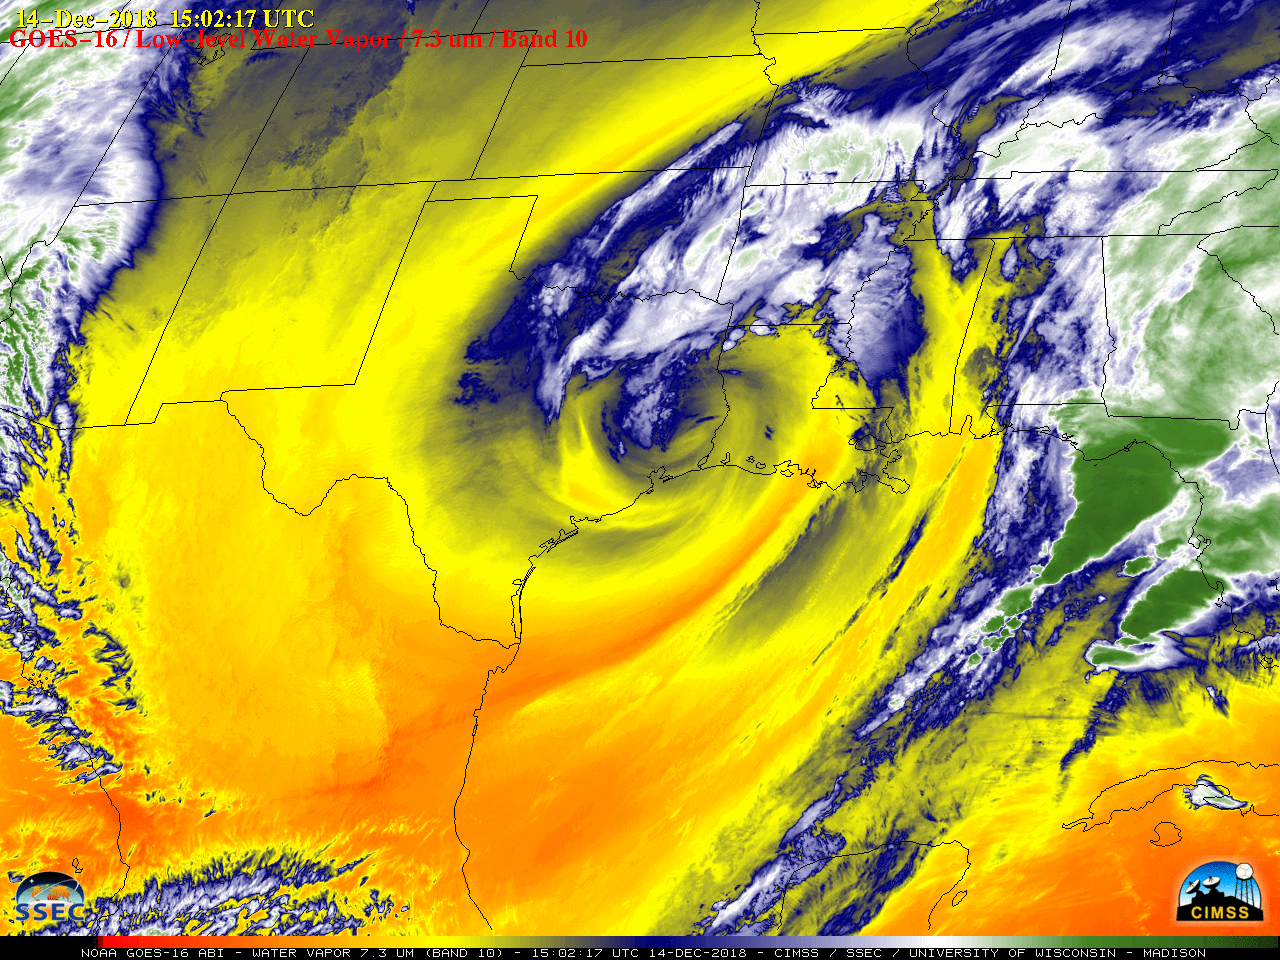
![GOES-16 Low-level Water Vapor (7.3 µm) images, 13-15 December [click to play MP4 animation]](https://cimss.ssec.wisc.edu/satellite-blog/wp-content/uploads/sites/5/2018/12/G16_WV_SOUTHERN_US_STORM_13_15DEC2018_2018348_150217_GOES-16_0001PANEL.GIF)
![GOES-16 Low-level Water Vapor (7.3 µm) images with hourly plots of surface wind gusts, 13-15 December [click to play MP4 animation]](https://cimss.ssec.wisc.edu/satellite-blog/wp-content/uploads/sites/5/2018/12/G16_WV_GUSTS_SOUTHERN_US_STORM_13_15DEC2018_2018348_150217_GOES-16_0001PANEL.GIF)
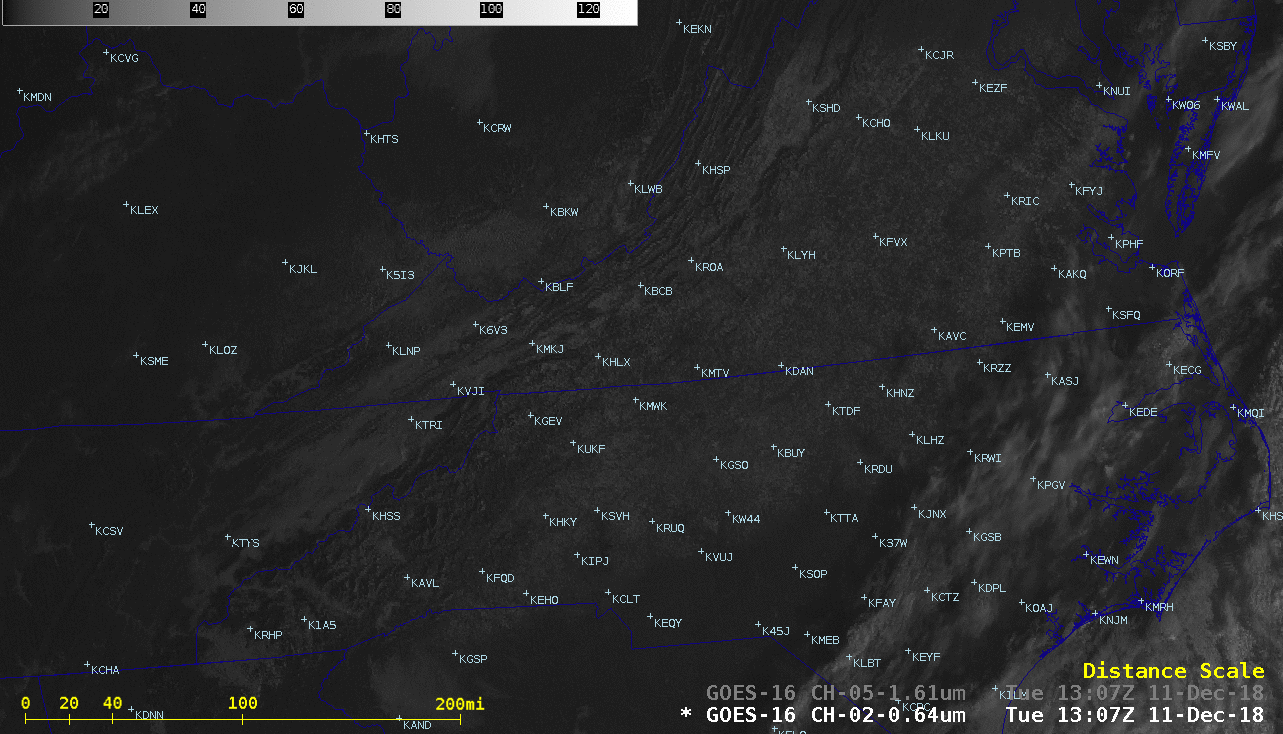
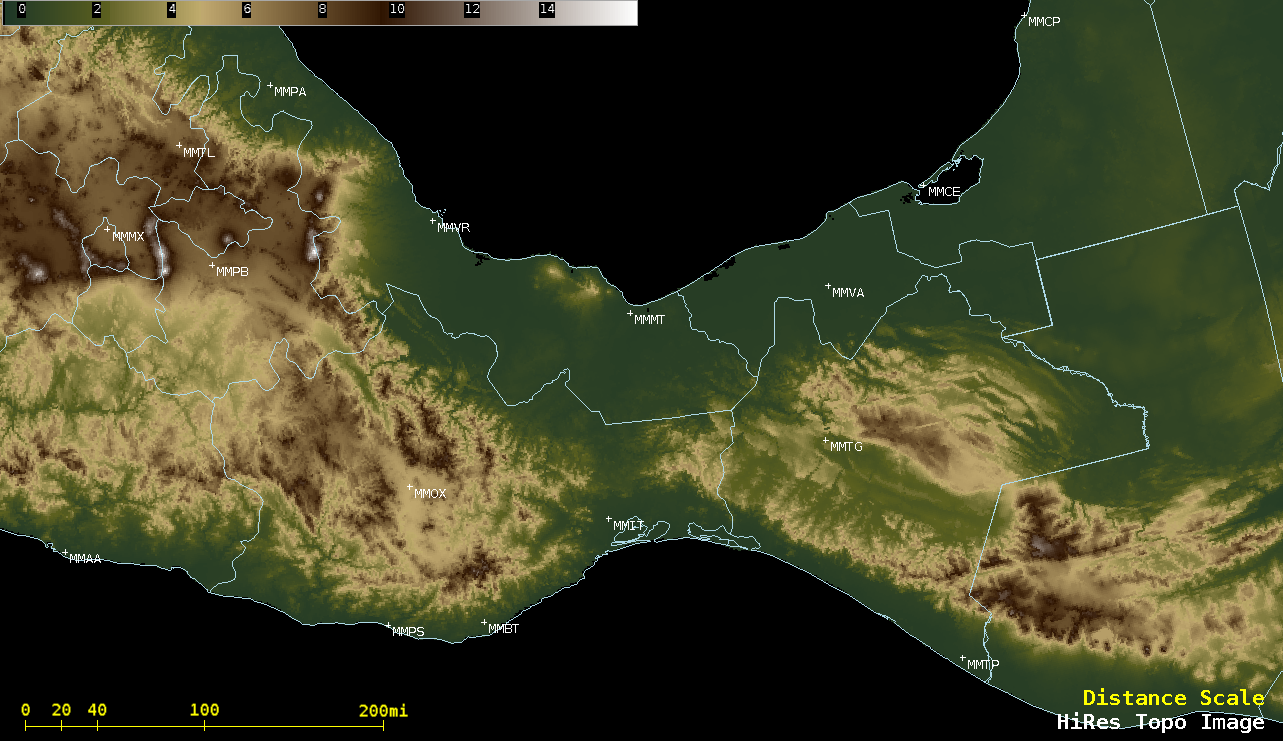
![Topography, Suomi NPP VIIRS Visible (0.64 µm) and Near-Infrared "Snow/Ice" (1.61 µm) images on 14 December [click to enlarge]](https://cimss.ssec.wisc.edu/satellite-blog/wp-content/uploads/sites/5/2018/12/181214_1917utc_suomiNPP_viirs_visible_snowIce_topography_TX_snowcover_anim.gif)
![Topography plus NOAA-20 VIIRS Visible (0.64 µm) and Near-Infrared "Snow/Ice" (1.61 µm) images on 15 December [click to enlarge]](https://cimss.ssec.wisc.edu/satellite-blog/wp-content/uploads/sites/5/2018/12/181215_1858utc_noaa20_viirs_visible_snowIce_topography_TX_snowcover_anim.gif)
![Terra/Aqua MODIS True Color and False Color images on 14 December [click to enlarge]](https://cimss.ssec.wisc.edu/satellite-blog/wp-content/uploads/sites/5/2018/12/181214_terra_aqua_modis_truecolor_falsecolor_TX_snowcover_anim.gif)
![Terra MODIS True Color RGB images on 14 and 15 December [click to enlarge]](https://cimss.ssec.wisc.edu/satellite-blog/wp-content/uploads/sites/5/2018/12/181214_181215_terra_modis_truecolor_TX_snowcover_anim.gif)
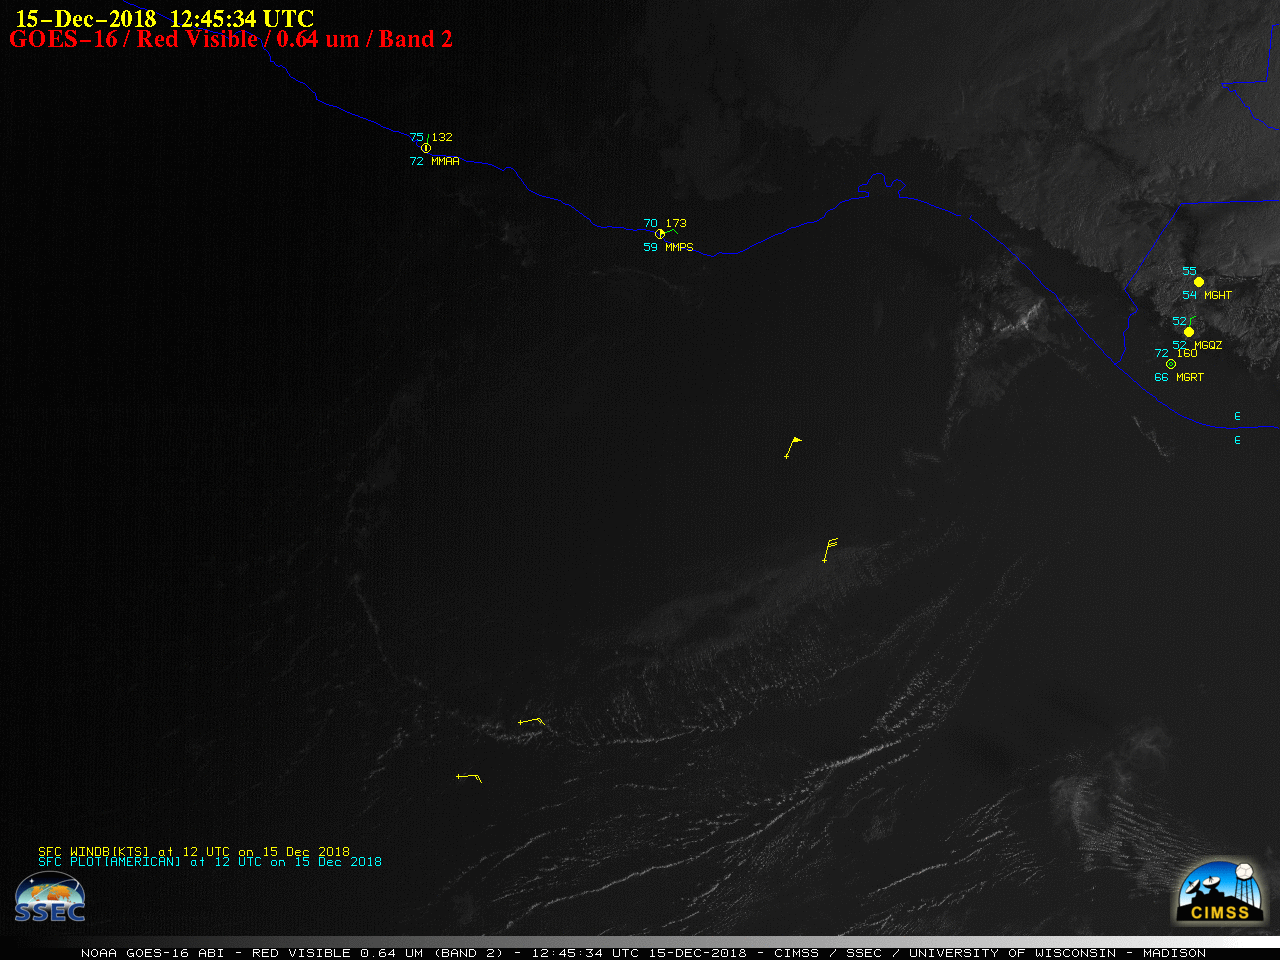
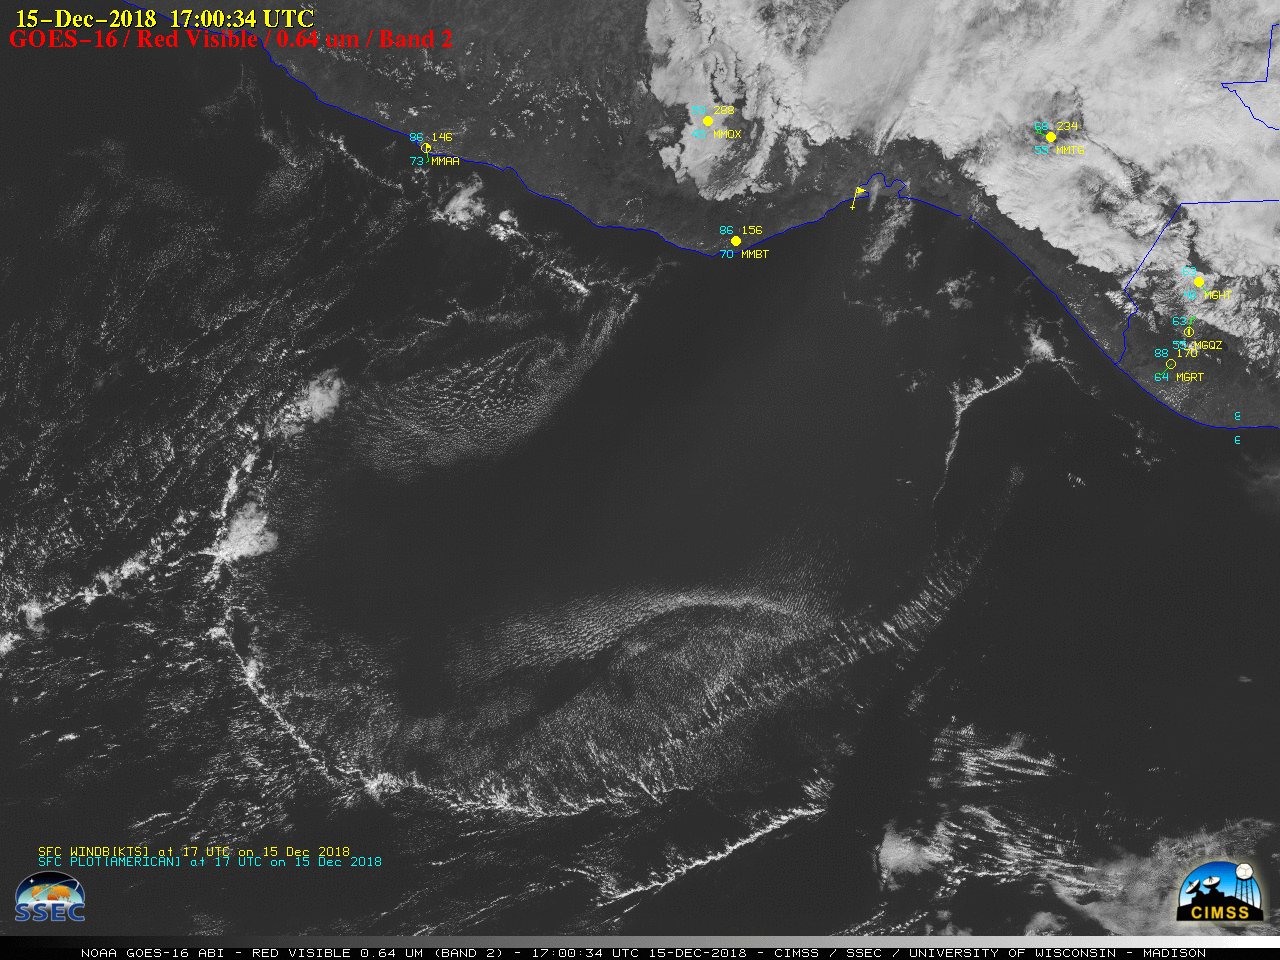
![NOAA-20 VIIRS True Color and Infrared Window (11.45 µm) images on 14 and 15 December [click to enlarge]](https://cimss.ssec.wisc.edu/satellite-blog/wp-content/uploads/sites/5/2018/12/181214_181215_noaa20_viirs_truecolor_infrared_Tehuano_anim.gif)
![Metop-A and Metop-B ASCAT surface scatterometer winds across the western Gulf of Mexico [click to enlarge]](https://cimss.ssec.wisc.edu/satellite-blog/wp-content/uploads/sites/5/2018/12/181214_metop_ascat_Gulf_of_Mexico_anim.gif)
![Metop-A and Metop-B ASCAT surface scatterometer winds across the southern Gulf of Mexico and the Gulf of Tehuantepec [click to enlarge]](https://cimss.ssec.wisc.edu/satellite-blog/wp-content/uploads/sites/5/2018/12/181214_metop_ascat_Tehuano_anim.gif)
![MIMIC Total Precipitable Water product (Total column, and Surface-850 hPa layer) [click to play animation]](https://cimss.ssec.wisc.edu/satellite-blog/wp-content/uploads/sites/5/2018/12/181214_181215_mtpw_sfc850_anim.gif)
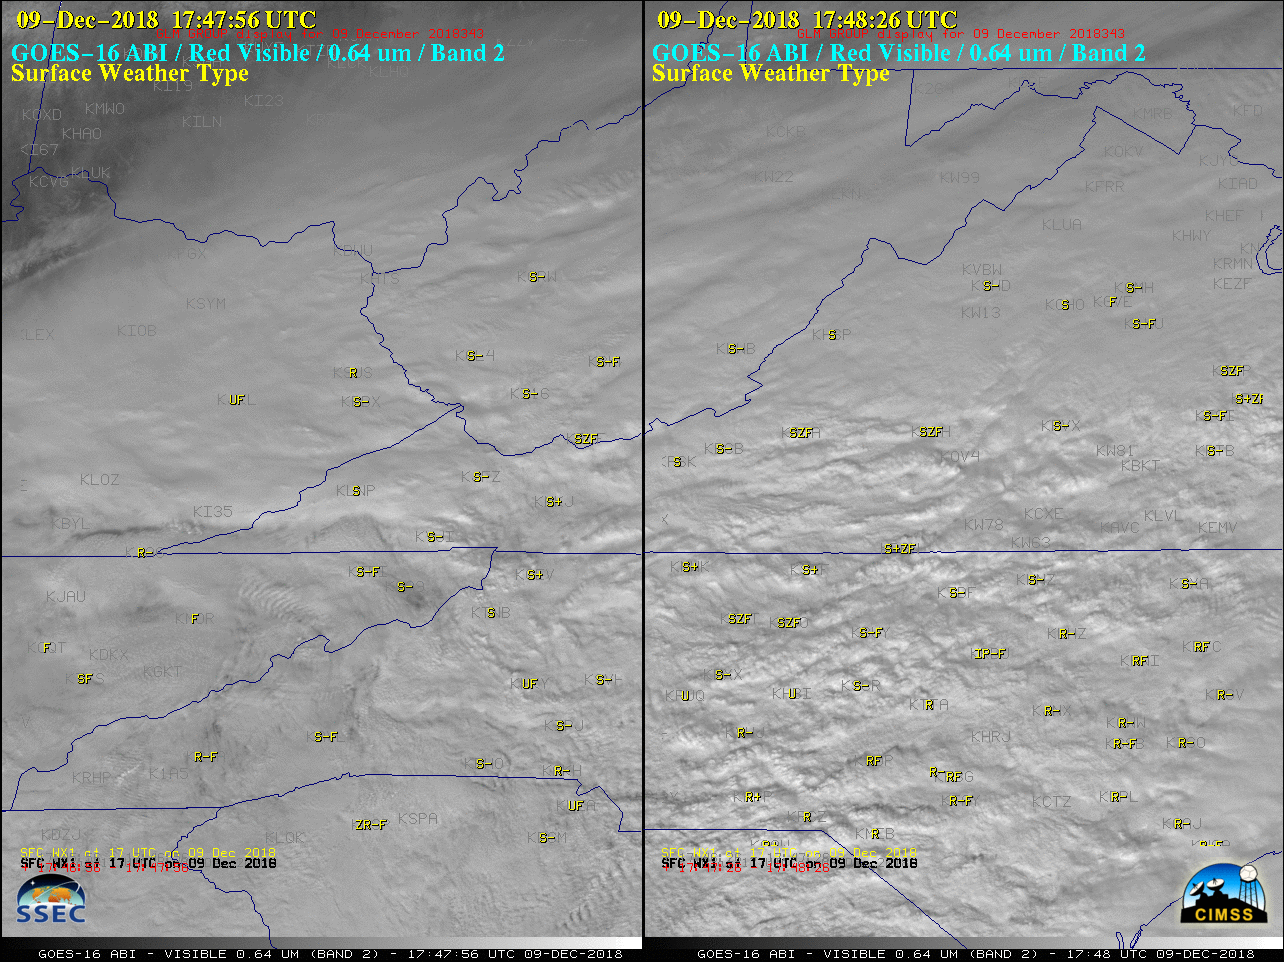
![GOES-16 Mid-level Water Vapor (6.9 µm) images, with hourly plots of surface weather type [click to play MP4 animation]](https://cimss.ssec.wisc.edu/satellite-blog/wp-content/uploads/sites/5/2018/12/G16_WV_WXS_WINTER_STORM_DEIGO_9_DEC2018_2018343_180218_GOES-16_0001PANEL.GIF)
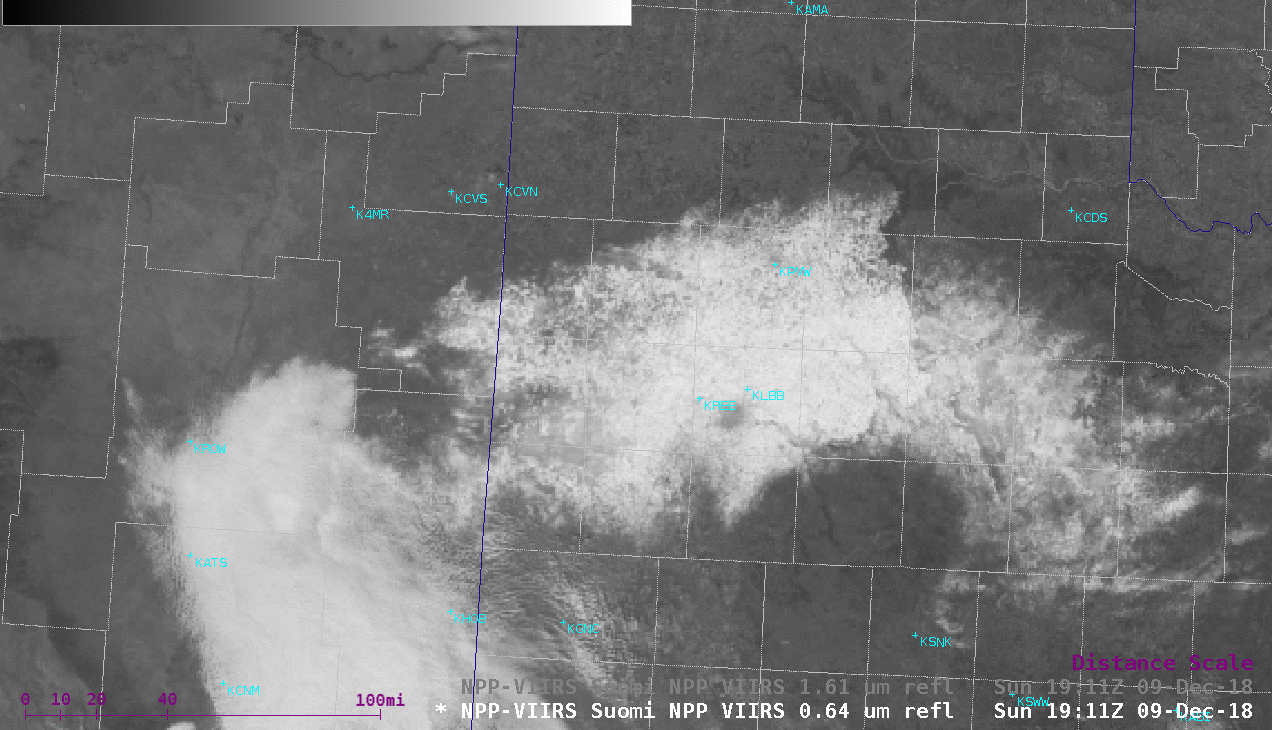
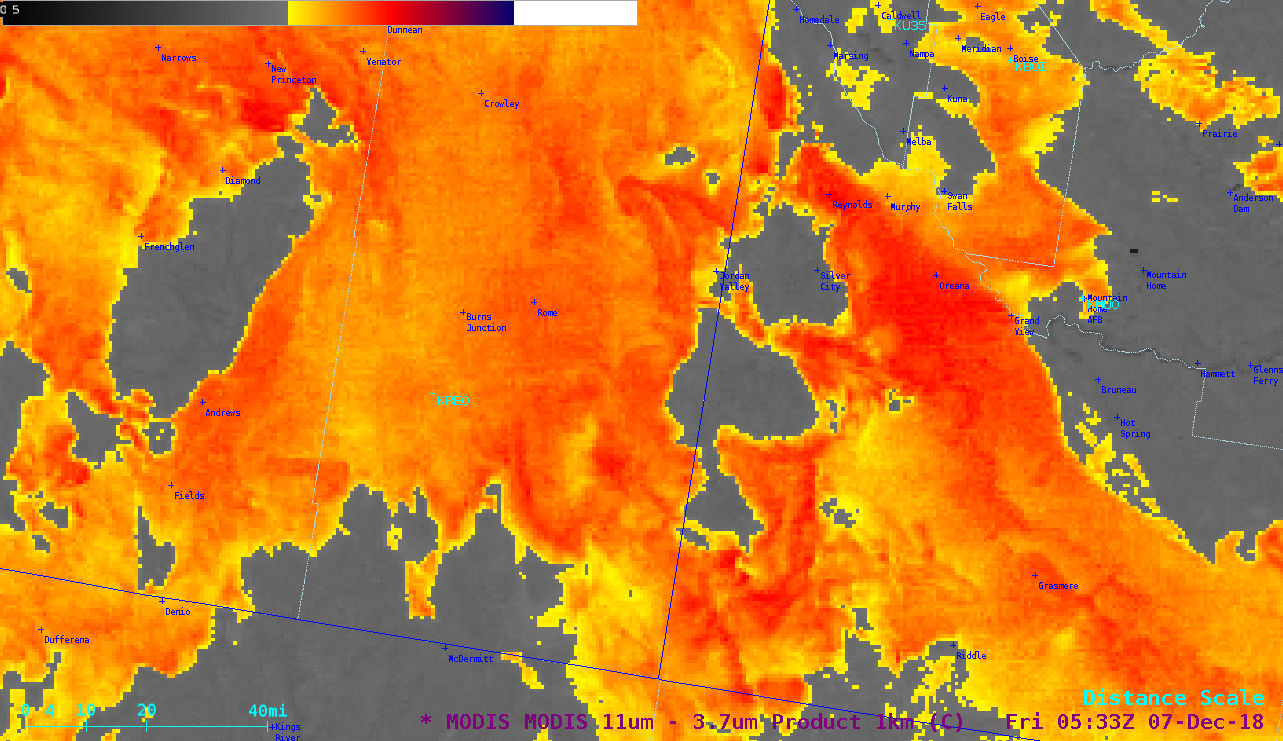
![Suomi NPP VIIRS Visible (0.64 µm) and Near-Infrared "Snow/Ice" (1.61 µm) images [click to enlarge]](https://cimss.ssec.wisc.edu/satellite-blog/wp-content/uploads/sites/5/2018/12/181209_viirs_visible_snowIce_AR_anim.gif)
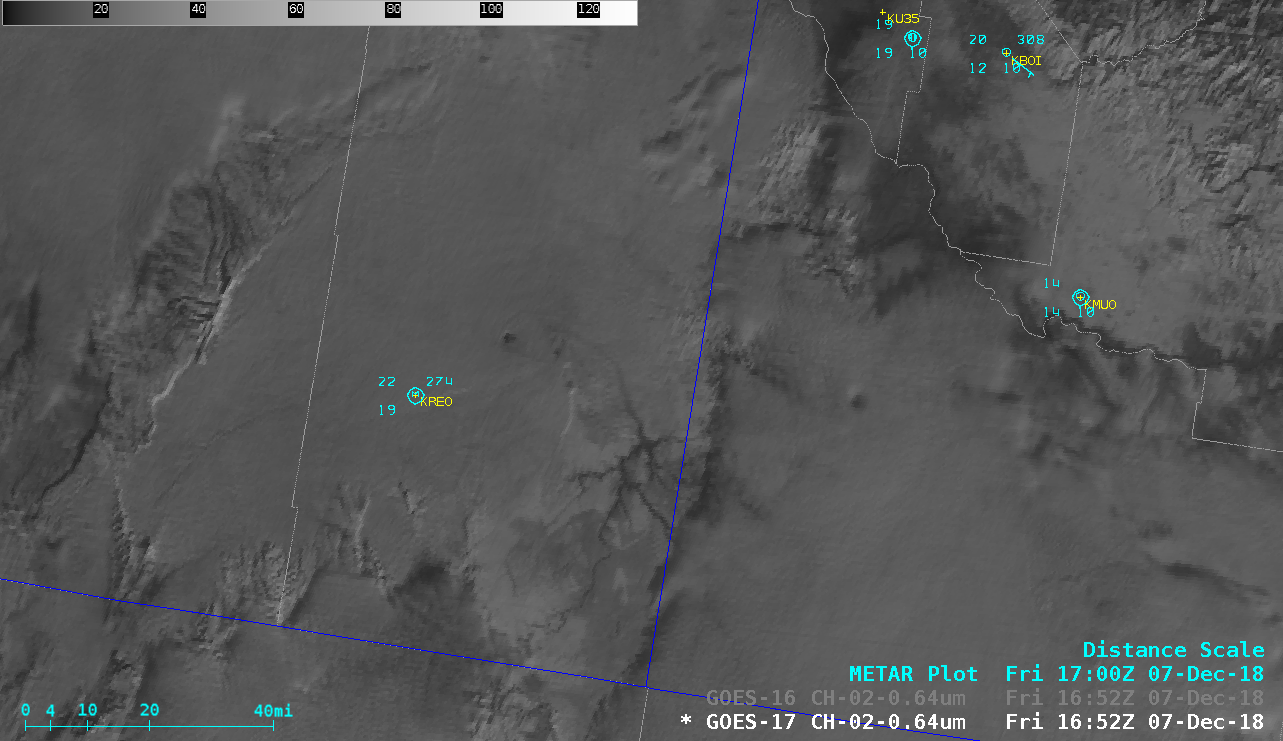
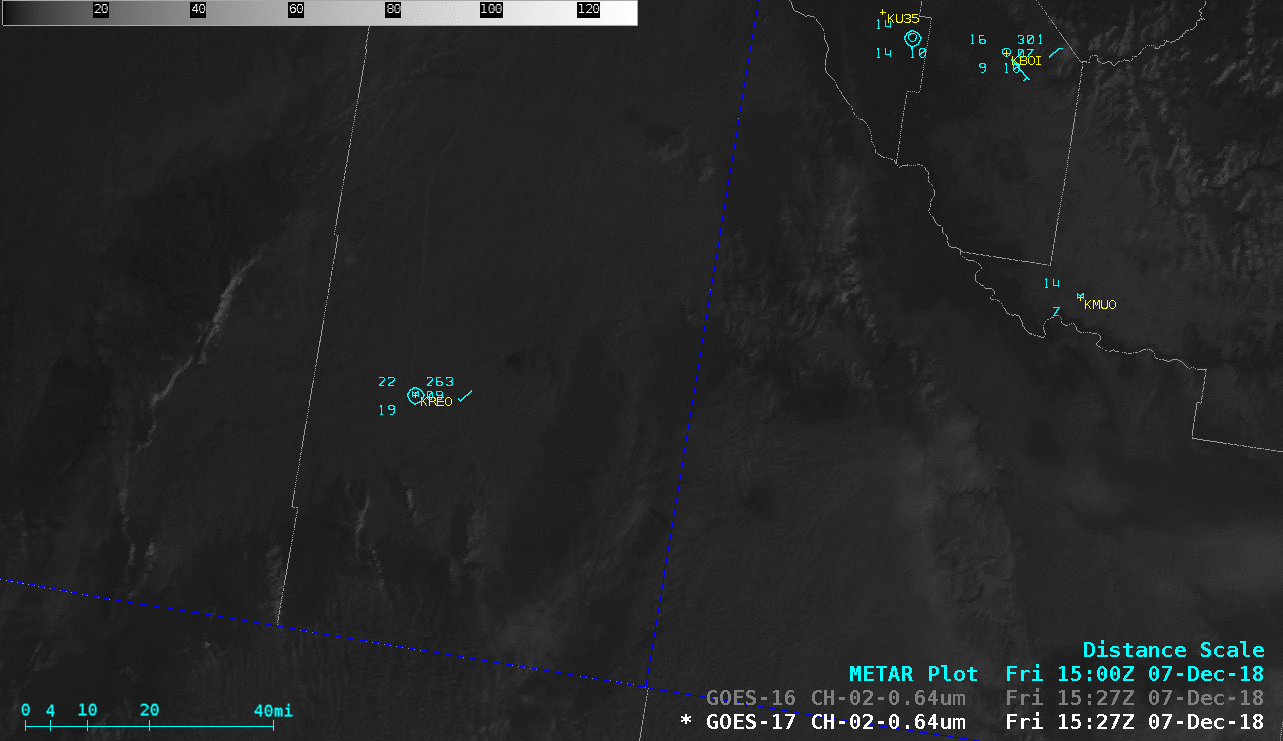
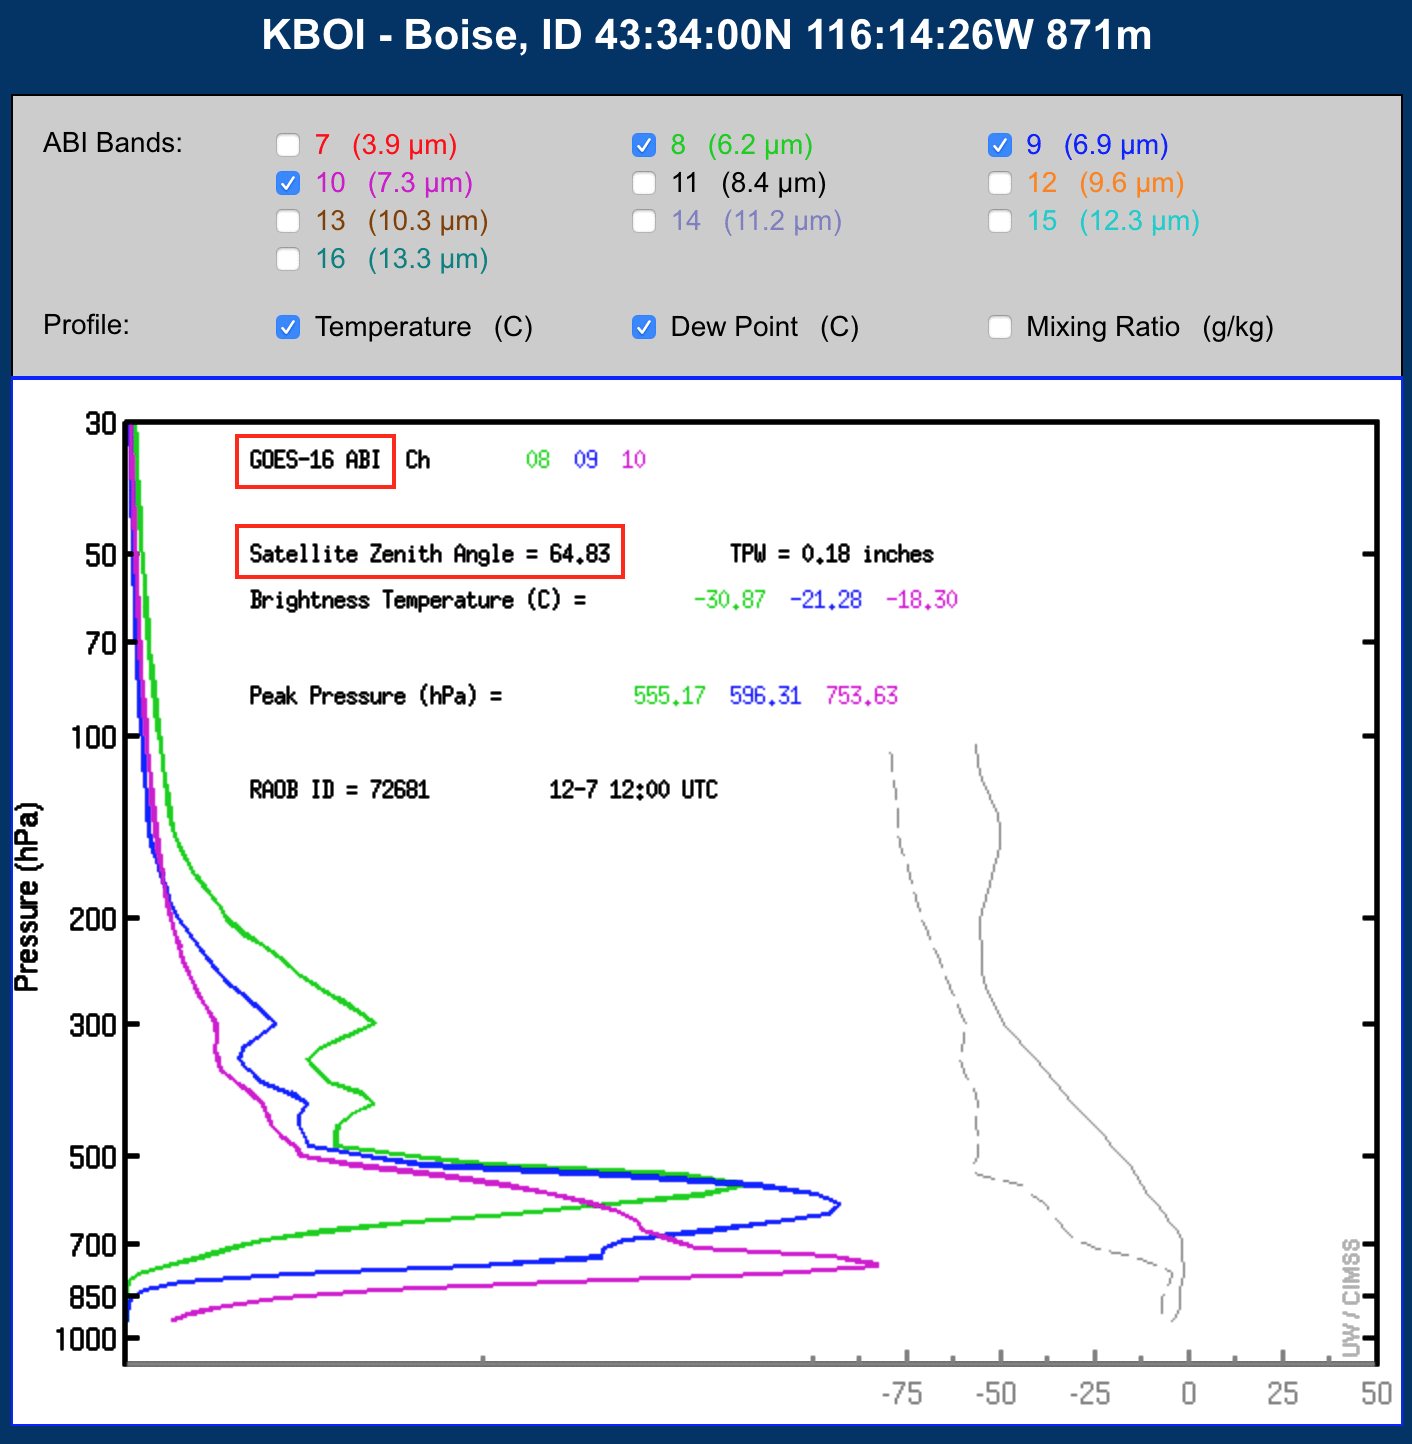
![Topography in feet [click to enlarge]](https://cimss.ssec.wisc.edu/satellite-blog/wp-content/uploads/sites/5/2018/12/or_id_vortex_topo.png)
![12 UTC rawinsonde data from Boise, Idaho [click to enlarge]](https://cimss.ssec.wisc.edu/satellite-blog/wp-content/uploads/sites/5/2018/12/181207_12utc_kboi_raob.png)
