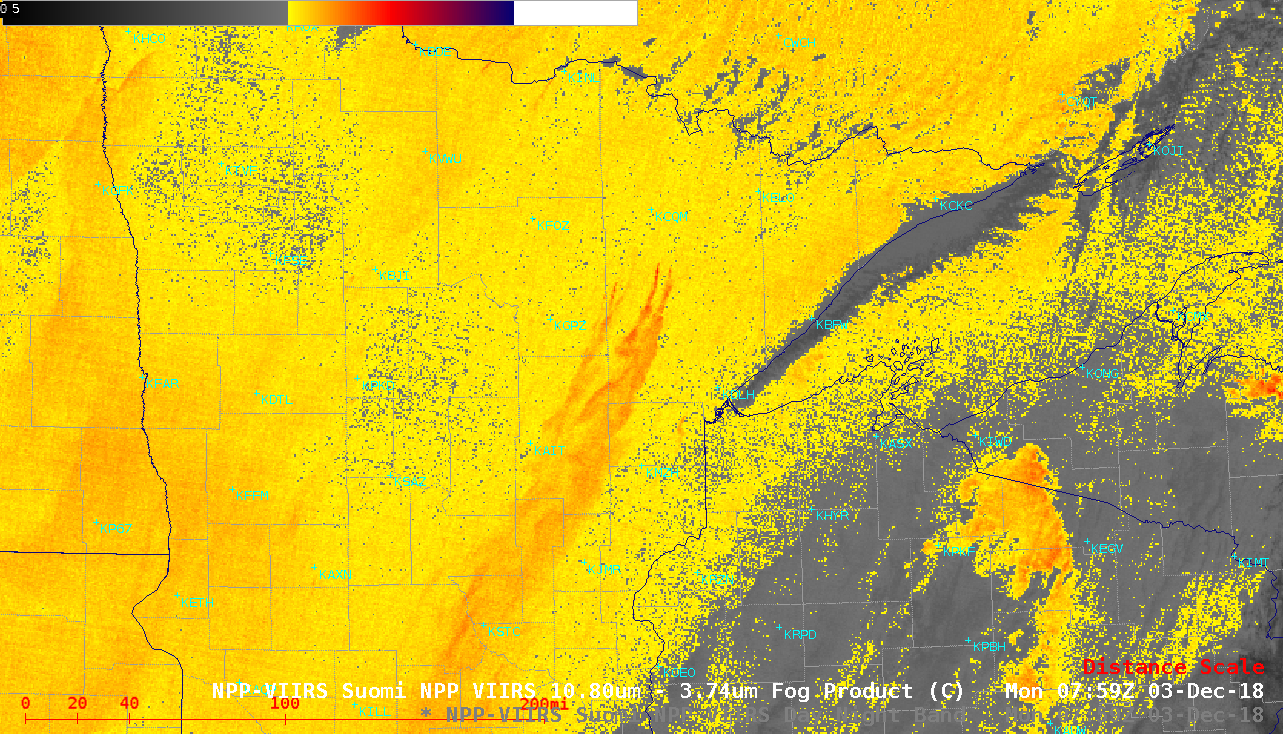
MODIS and VIIRS “Fog/stratus” BTD images [click to enlarge]
During the subsequent daytime hours, a comparison of GOES-16 (GOES-East) “Red” Visible (0.64 µm), Near-Infrared “Snow/Ice” (1.61 µm), Near-Infrared “Cloud Particle Size” (2.24 µm) and Shortwave Infrared (3.9 µm) images (below) showed signatures of these Mesabi Range plumes along with others emanating from industrial or power plant sources. A few ship tracks were also apparent across Lake Superior.
Particles emitted from the exhaust stacks at power plants and industrial sites (as well as ships) can act as efficient cloud condensation nuclei, which causes the formation of large numbers of supercooled water droplets having a smaller diameter than those found within the adjacent unperturbed supercooled clouds — and these smaller supercooled cloud droplets are better reflectors of incoming solar radiation, thereby appearing brighter in the Near-Infrared and warmer (darker gray) in the Shortwave Infrared images.
GOES-16 “Red” Visible (0.64 µm), Near-Infrared “Snow/Ice” (1.61 µm), Near-Infrared “Cloud Particle Size” (2.24 µm) and Shortwave Infrared (3.9 µm) images [click to play animation | MP4]
![MODIS and VIIRS "Fog/stratus" BTD images [click to enlarge]](https://cimss.ssec.wisc.edu/satellite-blog/wp-content/uploads/sites/5/2018/12/181204_modis_viirs_fogBTD_MN_WI_plumes_anim.gif)
MODIS and VIIRS “Fog/stratus” BTD images [click to enlarge]
VIIRS Visible (0.64 µm), Near-Infrared “Snow/Ice” (1.61 µm), Shortwave Infrared (3.74 µm) and Infrared Window (11.45 µm) images [click to enlarge]
It’s been confirmed that this snow band is originating from 2 plants in Norfolk. The steam produced there is essentially acting to add moisture and warmth to the clouds creating the snow. Had reports of large flake and up to 1in. If you live in that area how much have you seen? pic.twitter.com/mSiVcj6uH2
— NWS Omaha (@NWSOmaha) December 3, 2018
Farther to the east over Ohio and Pennsylvania, another example of the 2 plume types was seen (below) — one plume originating from an industrial site near Cleveland was glaciating/eroding the supercooled cloud and producing snowfall, while another bright/warm supercooled droplet plume was moving southeastward from a point source located west of Indiana County Airport KIDI.
#Weather #Nerd Moment! Seeing a very localized enhancement of a band of #snow from industries near downtown #Cleveland. The heat and steam from near downtown #CLE is causing localized snow southeastward towards Summit County. Seen from satellite and radar. #OHwx #PAwx #NWS #CLEwx pic.twitter.com/C1Ojwienqq
— NWS Cleveland (@NWSCLE) December 4, 2018
The Cleveland plume was captured by an overpass of the Landsat-8 satellite, with a False Color Red-Green-Blue (RGB) image viewed using RealEarth providing great detail with 30-meter resolution (below). A small “overshooting top” can even be seen above the industrial site southeast of Cleveland, with the swath of glaciated and eroding cloud extending downwind (to the southeast) from that point.
![Landsat-8 False Color RGB image [click to enlarge]](https://cimss.ssec.wisc.edu/satellite-blog/wp-content/uploads/sites/5/2018/12/181204_1604utc_landsat8_falsecolor_CLE_factory_plume_anim.gif)
Landsat-8 False Color RGB image [click to enlarge]
![Landsat-8 False Color RGB image [click to enlarge]](https://cimss.ssec.wisc.edu/satellite-blog/wp-content/uploads/sites/5/2018/12/181203_1658utc_landsat8_falsecolor_Minnesota_industrial_glaciation_plume_anim.gif)
Landsat-8 False Color RGB image [click to enlarge]
===== 08 December Update =====
Visible satellite loop of another industrial plant steam plume from Columbia City affecting clouds/weather. Snow reported in Marion IN about 45 miles south. #inwx #Weather pic.twitter.com/KkrTtzPBsd
— Sam Lashley (@Slashman_us) December 8, 2018
The effect of this industrial plume glaciating and eroding the supercooled water droplet clouds over northern Indiana was also seen in a comparison of Terra MODIS Visible (0.65 µm), Near-Infrared “Snow/Ice” (1.61 µm) and Infrared Window (11.0 µm) images (below).
Terra MODIS Visible (0.65 µm), Near-Infrared “Snow/Ice” (1.61 µm) and Infrared Window (11.0 µm) images [click to enlarge]
===== 09 December Update =====
Interesting looking plumes coming from the more industrial areas along the coast. Likely introducing particulates and condensation nuclei to enhance cloud formation. #txwx #GOES16 pic.twitter.com/LseHazkeoX
— NWS Houston (@NWSHouston) December 9, 2018
During the following daytime hours, GOES-16 “Red” Visible (0.64 µm), Near-Infrared “Snow/Ice” (1.61 µm), Near-Infrared “Cloud Particle Size” (2.24 µm), Shortwave Infrared (3.9 µm) and “Clean” Infrared Window (10.3 µm) images (below) showed a number of plumes from industrial sites (many of which were likely refineries) streaming southeastward and eastward over the Gulf of Mexico on 09 December. Note the lack of a plume signature in the 10.3 µm imagery.
![GOES-16 "Red" Visible (0.64 µm), Near-Infrared "Snow/Ice" (1.61 µm), Near-Infrared "Cloud Particle Size" (2.24 µm), Shortwave Infrared (3.9 µm) and "Clean" Infrared Window (10.3 µm) images [click to play MP4 animation]](https://cimss.ssec.wisc.edu/satellite-blog/wp-content/uploads/sites/5/2018/12/gom_nir225-20181209_183218.png)
GOES-16 “Red” Visible (0.64 µm), Near-Infrared “Snow/Ice” (1.61 µm), Near-Infrared “Cloud Particle Size” (2.24 µm), Shortwave Infrared (3.9 µm) and “Clean” Infrared Window (10.3 µm) images [click to play MP4 animation]
View only this post Read Less

![Plot of 00 UTC Lincoln, Illinois rawinsonde data [click to enlarge]](https://cimss.ssec.wisc.edu/satellite-blog/wp-content/uploads/sites/5/2018/12/181201_18utc_181202_00utc_kilx_raobs_anim.gif)
![Terra/Aqua MODIS and Suomi NPP/NOAA-20 VIIRS Visible and Infrared images [click to enlarge]](https://cimss.ssec.wisc.edu/satellite-blog/wp-content/uploads/sites/5/2018/12/181201_modis_viirs_visible_infraredWindow_IL_anim.gif)
![Comparison of GOES-16 ABI and NOAA-20 VIIRS Infrared Window images at 2007 UTC [click to enlarge]](https://cimss.ssec.wisc.edu/satellite-blog/wp-content/uploads/sites/5/2018/12/181201_2007utc_goes16_abi_vs_noaa20_viirs_infrared_IL.png)

![GCOM-W! AMSR2 Total Precipitable Water and Wind Speed products, from 2256 UTC on 28 November to 1692 UTC on 30 November [click to play animation]](https://cimss.ssec.wisc.edu/satellite-blog/wp-content/uploads/sites/5/2018/11/181128_181130_amsr2_totalPrecipitableWater_windSpeed_global_anim.gif)
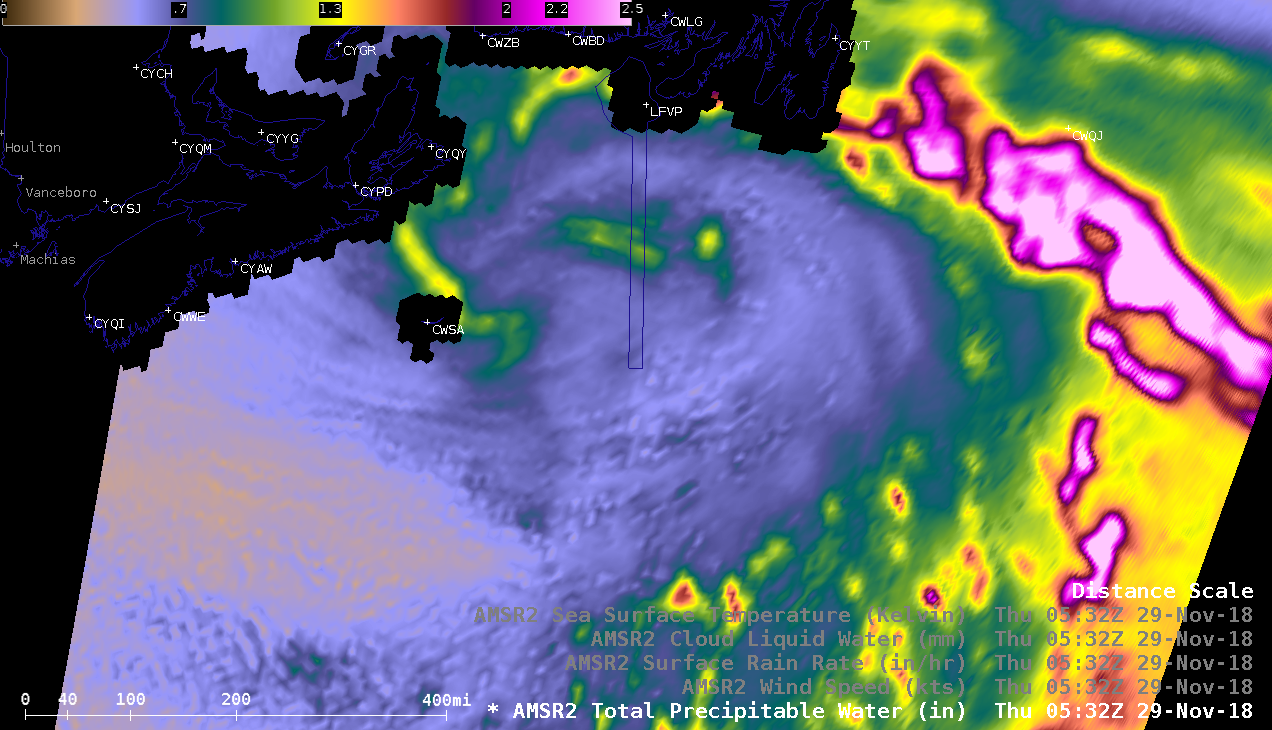
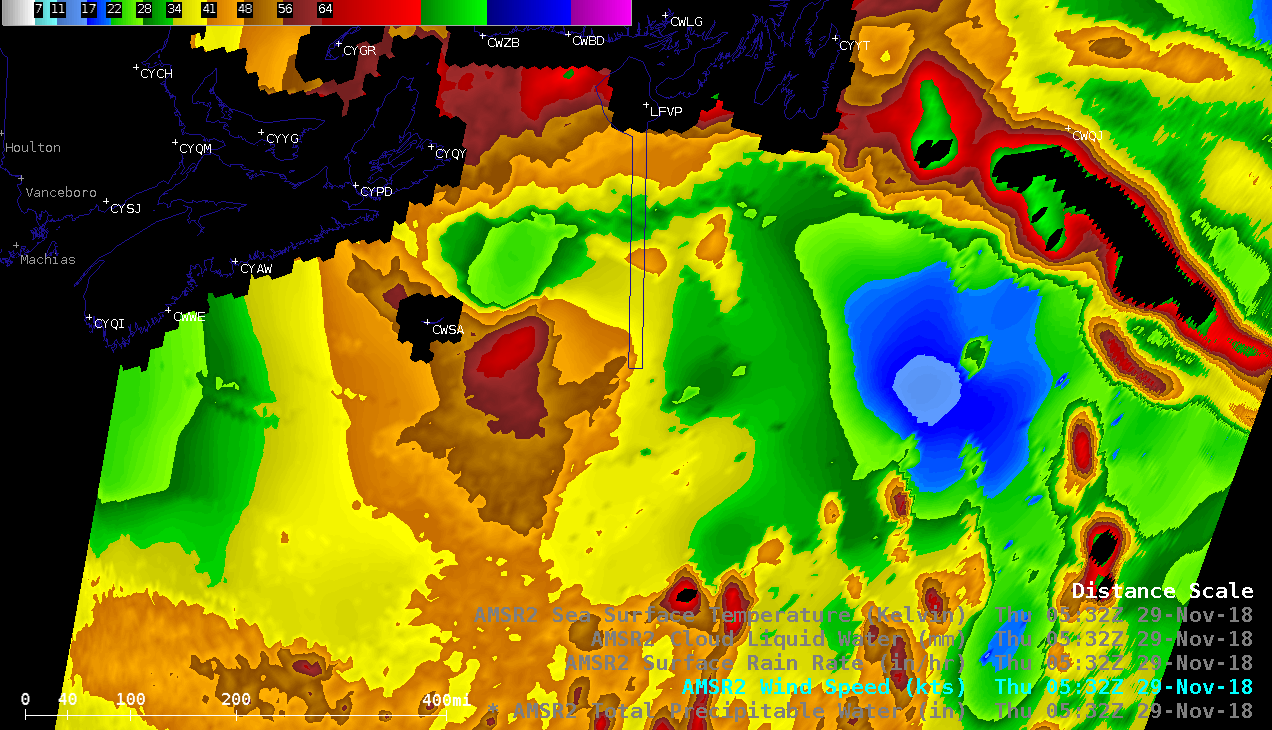
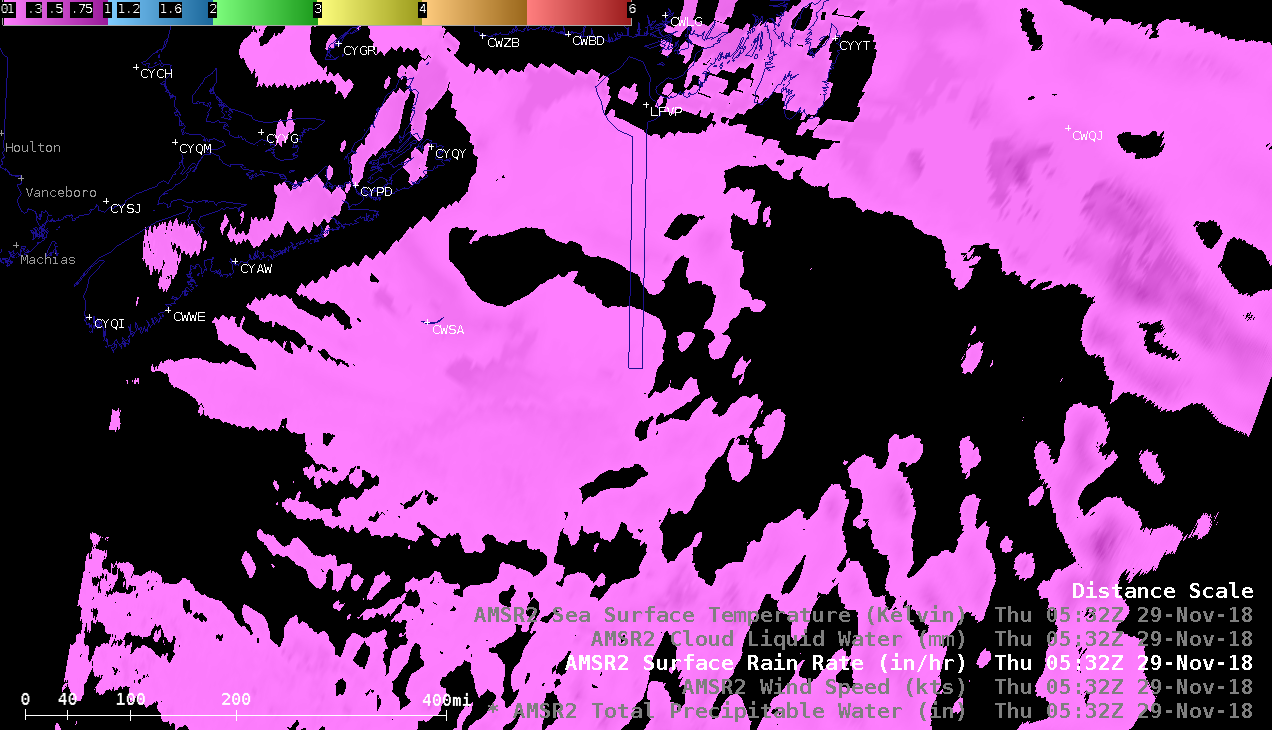
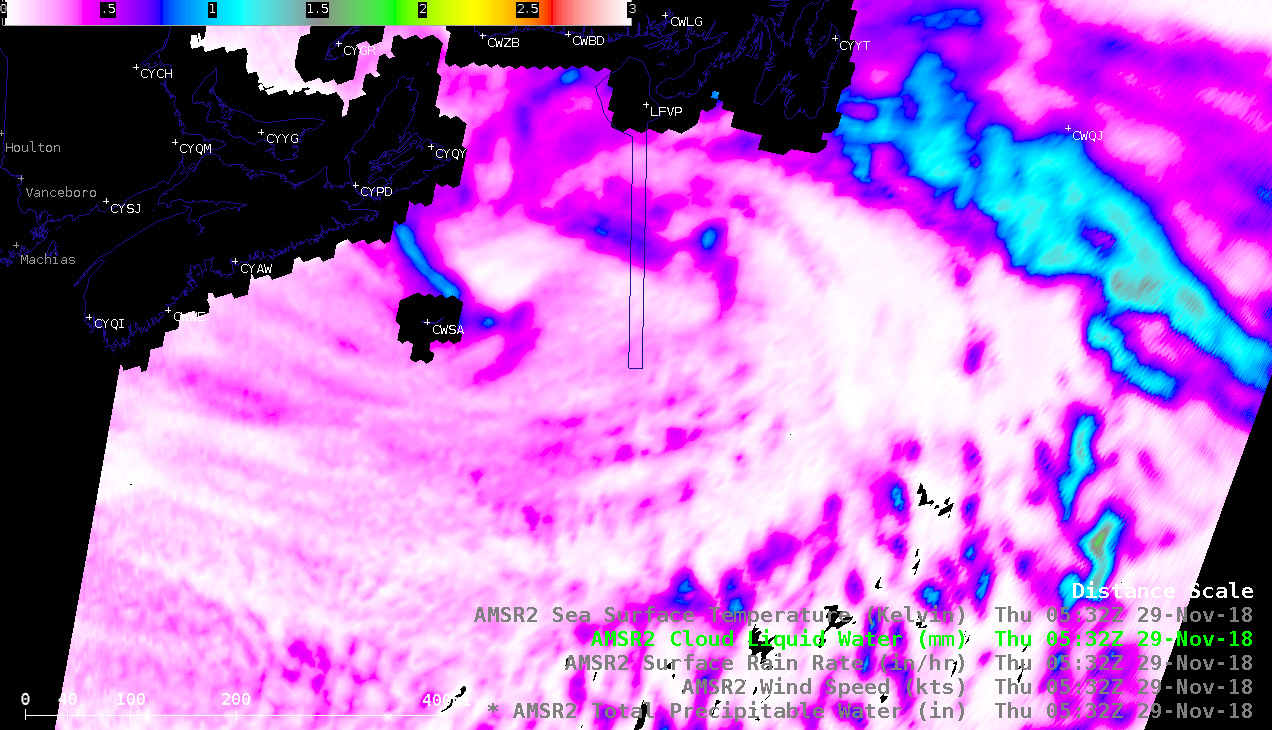
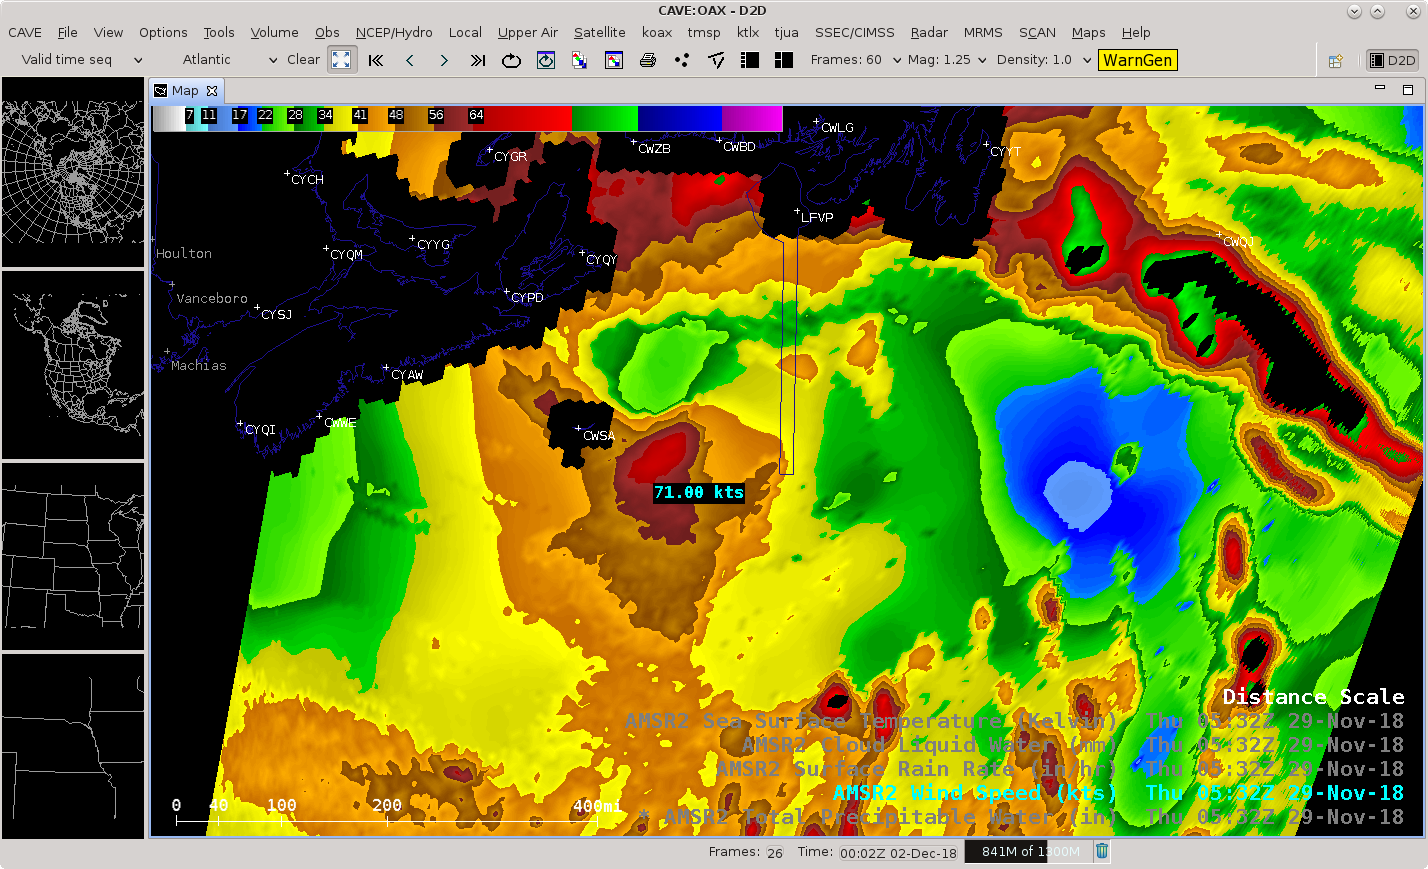
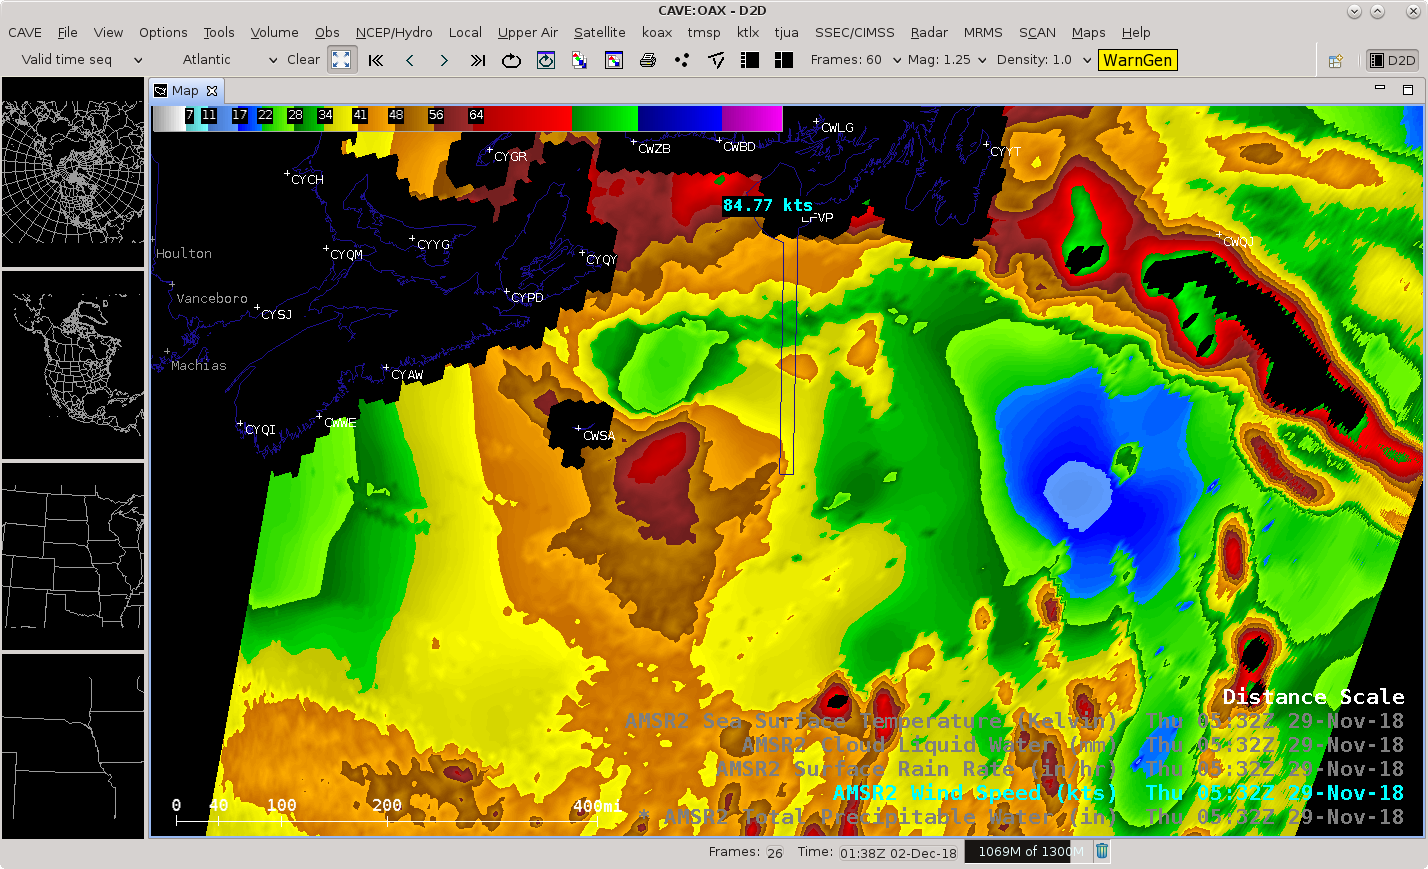
![GCOM-W1 AMSR2 Total Precipitable Water, Wind Speed, Surface Rain Rate and Cloud Liquid Water products [click to enlarge]](https://cimss.ssec.wisc.edu/satellite-blog/wp-content/uploads/sites/5/2018/11/181129_0532utc_gcomW1_amsr2_tpw_windspeed_rainRate_cloudLiquidWater_Canadian_Maritimes_anim.gif)
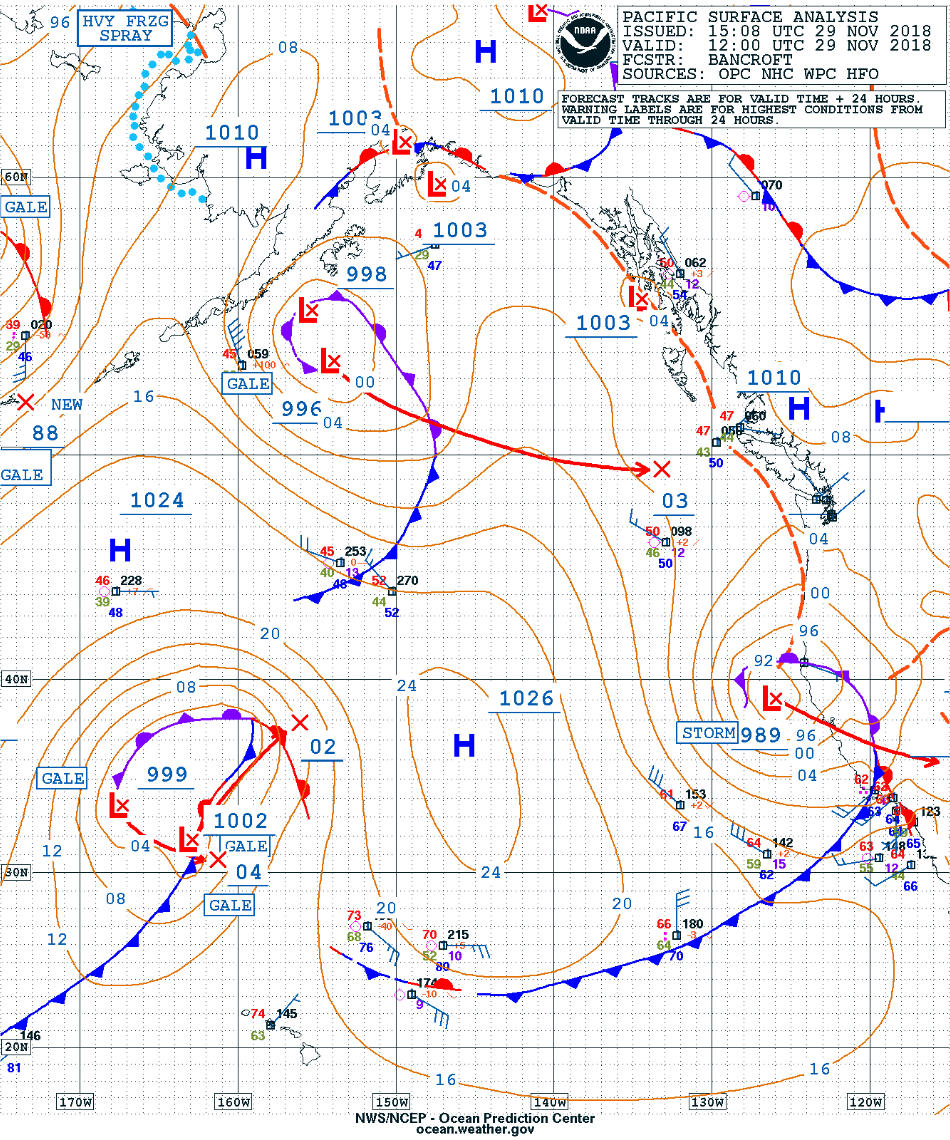
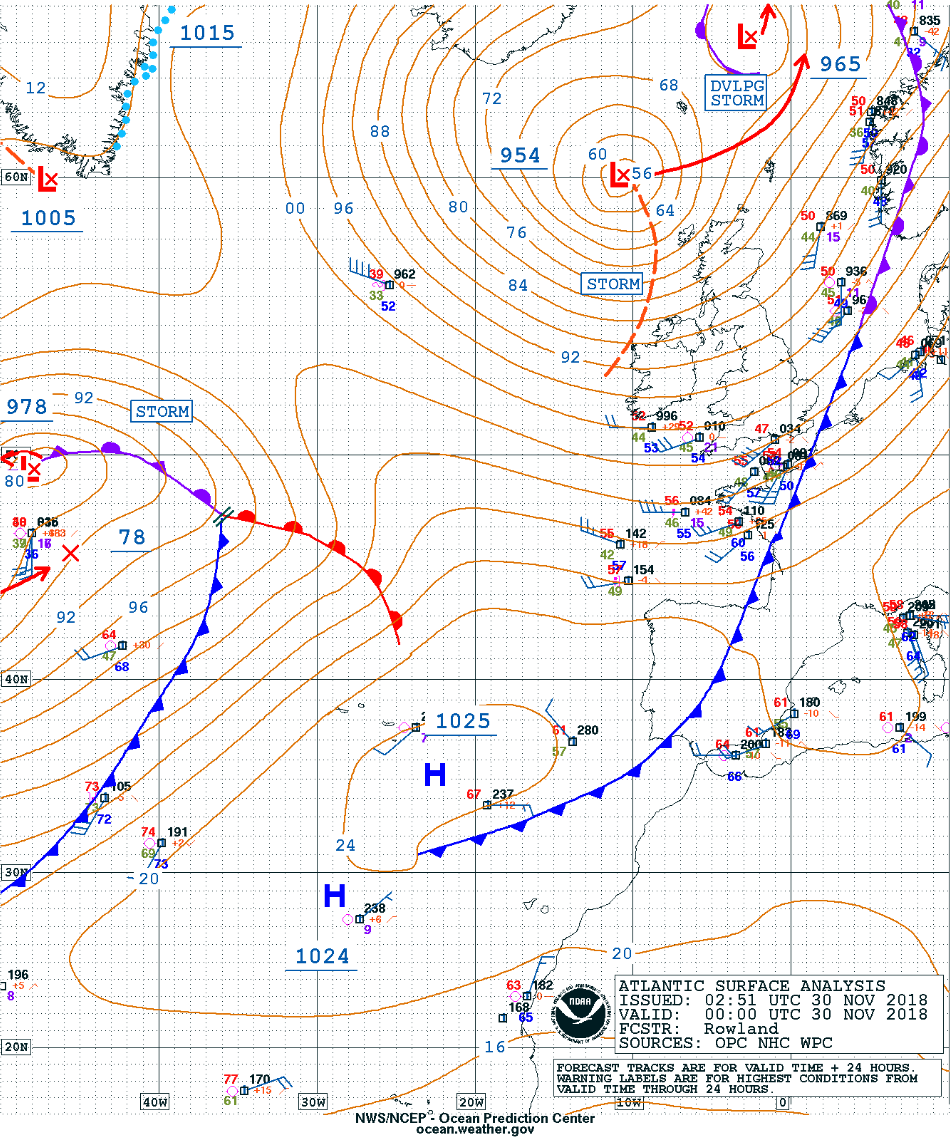
![Surface analyses at 00 UTC and 06 UTC [click to enlarge]](https://cimss.ssec.wisc.edu/satellite-blog/wp-content/uploads/sites/5/2018/11/181129_00utc_06utc_surface_analyses_anim.gif)
![Aqua MODIS Water Vapor (6.7 µm) and Infrared Window (11.0 µm) images at 0543 UTC [click to enlarge]](https://cimss.ssec.wisc.edu/satellite-blog/wp-content/uploads/sites/5/2018/11/181129_0543utc_aqua_modis_waterVapor_infraredWindow_Canadian_Maritimes_anim.gif)
![NOAA-20 VIIRS Day/Night Band (0.7 µm) and Infrared Window (11.45 µm) images at 0557 UTC [click to enlarge]](https://cimss.ssec.wisc.edu/satellite-blog/wp-content/uploads/sites/5/2018/11/181129_0557utc_noaa20_viirs_dayNightBand_infraredWindow_Canadian_Maritimes_anim.gif)
![GCOM-W1 AMSR2 Total Precipitable Water, Wind Speed at 0532 and 1529 UTC [click to enlarge]](https://cimss.ssec.wisc.edu/satellite-blog/wp-content/uploads/sites/5/2018/11/181129_0532utc_1520utc_gcomW1_amsr2_totalPrecipitableWater_windSpeed_Atlantic_anim.gif)
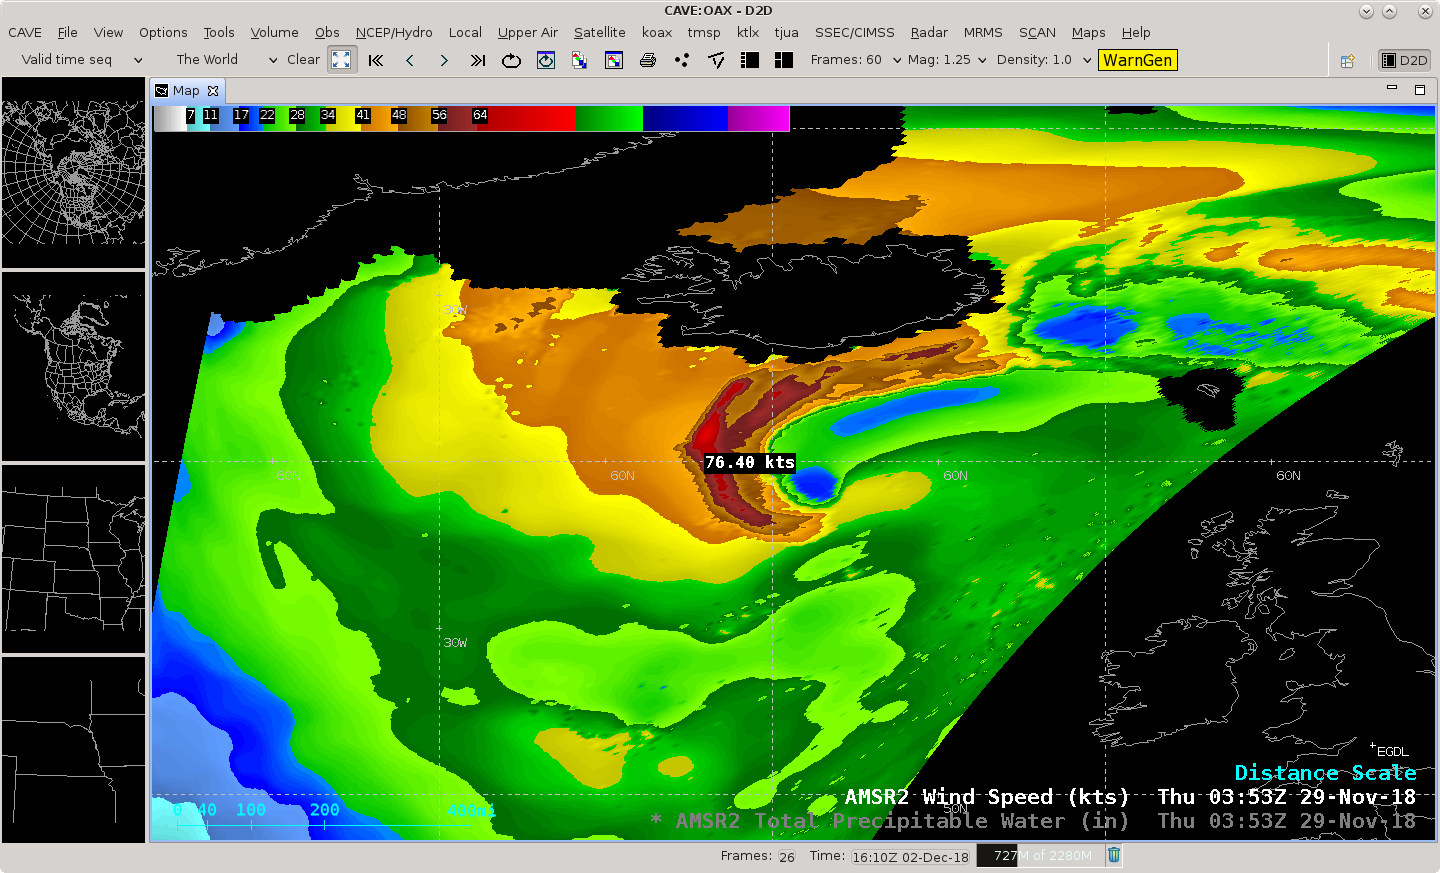
![GCOM-W1 AMSR2 Total Precipitable Water and Wind Speed products at 0353 UTC on 29 November [click to enlarge]](https://cimss.ssec.wisc.edu/satellite-blog/wp-content/uploads/sites/5/2018/11/181129_0353utc_gcomW1_amsr2_totalPrecipitableWater_windSpeed_Iceland_anim.gif)
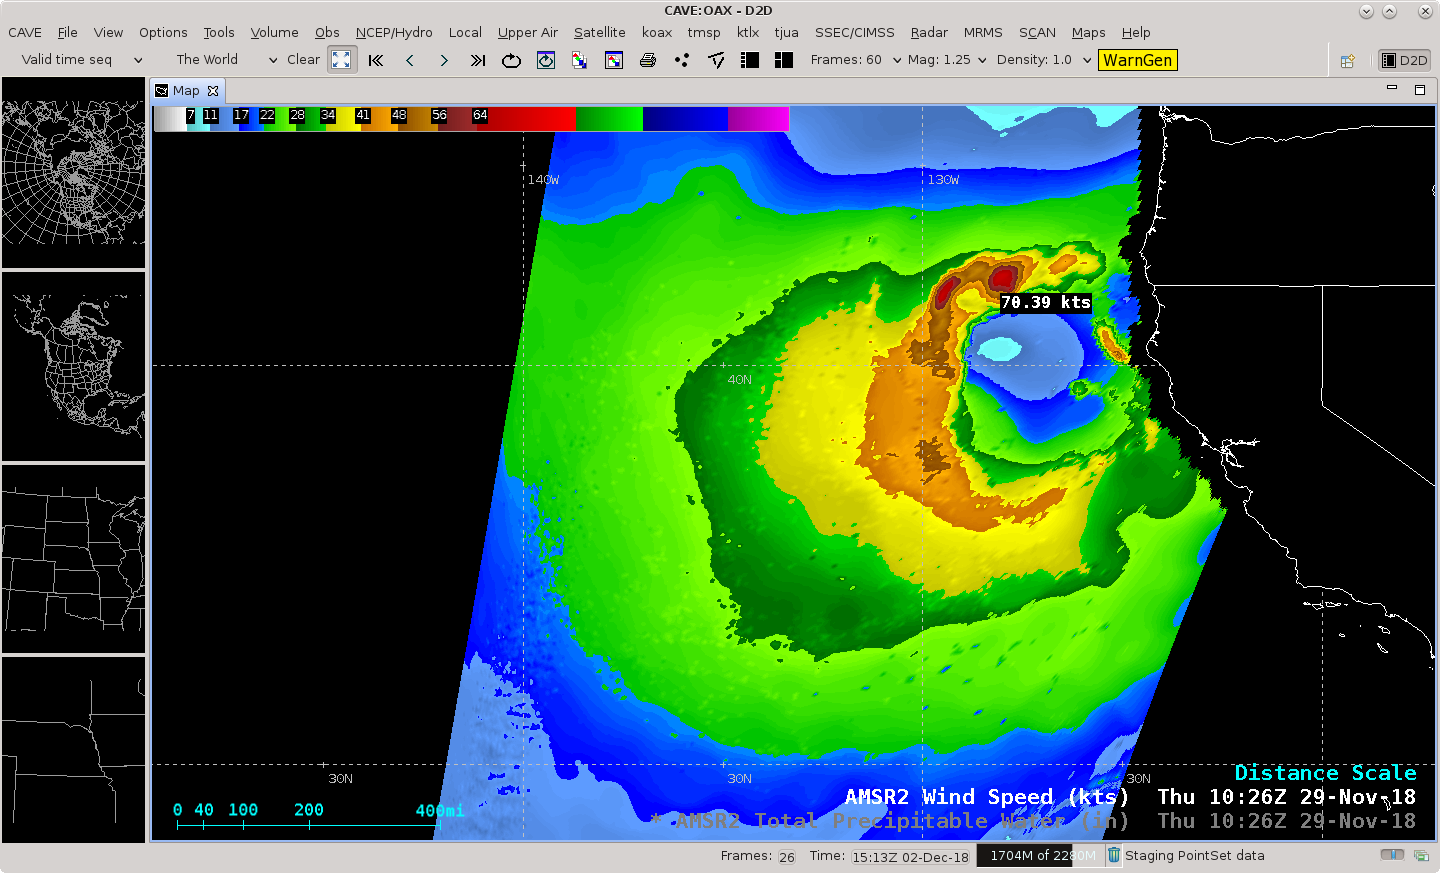
![GCOM-W1 AMSR2 Total Precipitable Water and Wind Speed products off the US West Coast at 1026 UTC on 29 November [click to enlarge]](https://cimss.ssec.wisc.edu/satellite-blog/wp-content/uploads/sites/5/2018/11/181129_1026utc_gcomW1_amsr2_totalPrecipitableWater_windSpeed_US_West_Coast_anim.gif)
![GCOM-W1 AMSR2 Total Precipitable Water and Wind Speed products north of Hawai'i at 1202 UTC on 29 November [click to enlarge]](https://cimss.ssec.wisc.edu/satellite-blog/wp-content/uploads/sites/5/2018/11/181129_1202utc_gcomW1_amsr2_totalPrecipitableWater_windSpeed_Hawaii_anim.gif)
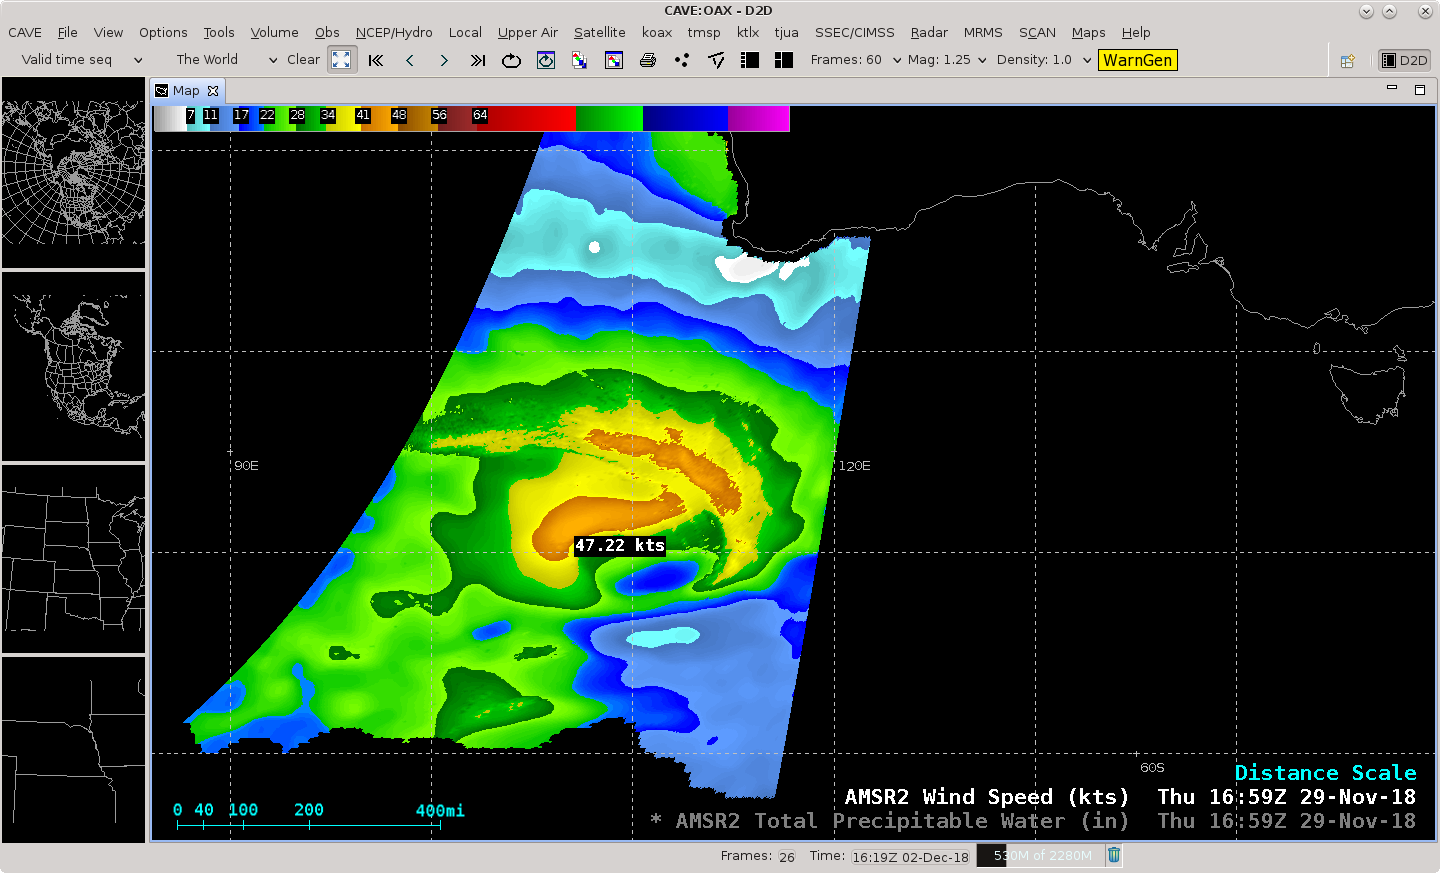
![GCOM-W1 AMSR2 Total Precipitable Water and Wind Speed products southwest of Australia at 1659 UTC on 29 November [click to enlarge]](https://cimss.ssec.wisc.edu/satellite-blog/wp-content/uploads/sites/5/2018/11/181129_1659utc_gcomW1_amsr2_totalPrecipitableWater_windSpeed_Australia_anim.gif)
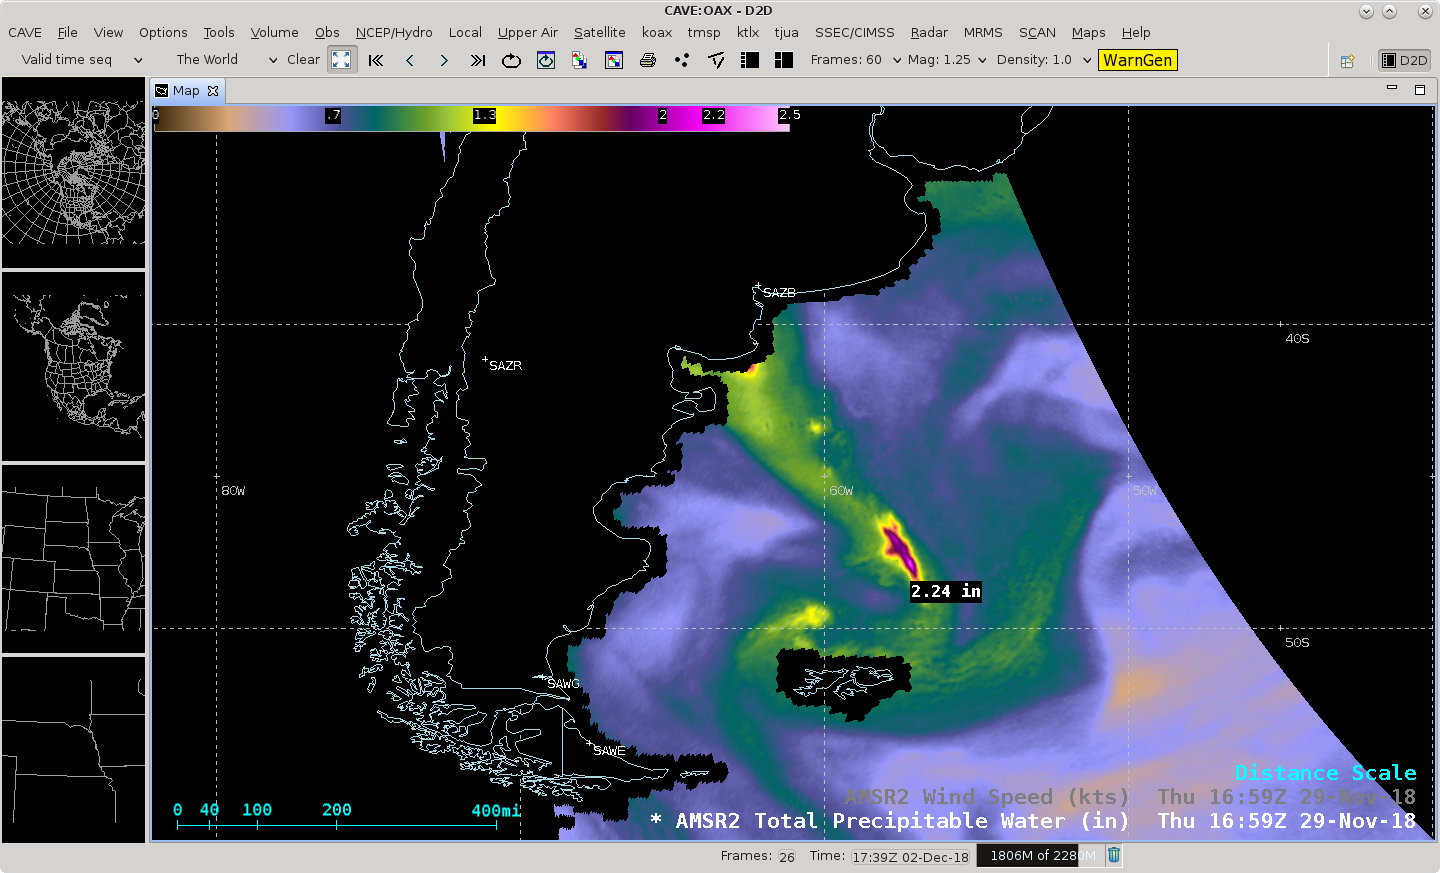
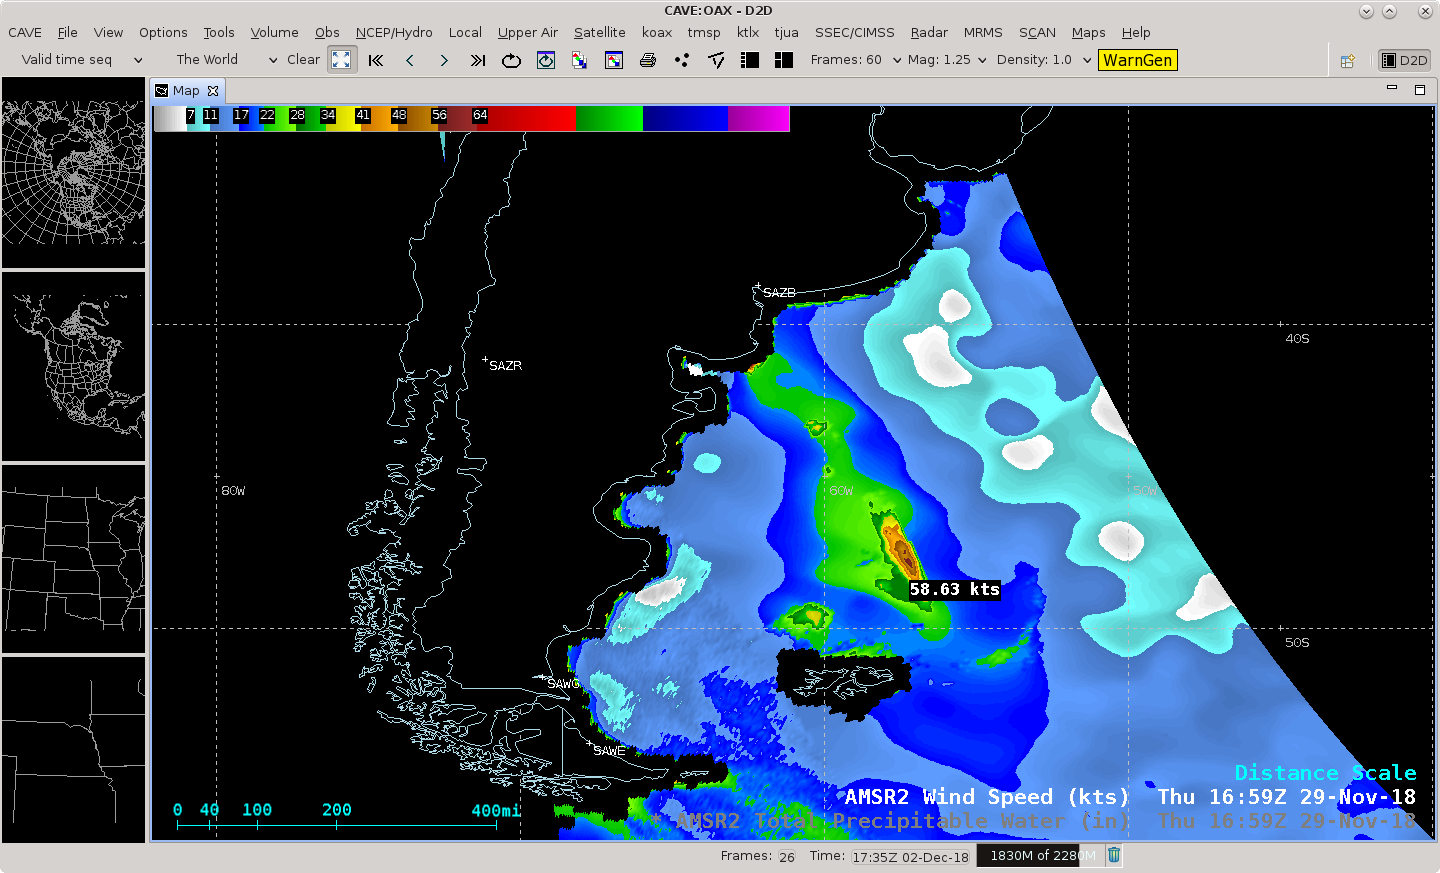
![GCOM-W1 AMSR2 Total Precipitable Water and Wind Speed products southeast of Argentina at 1659 UTC on 29 November [click to enlarge]](https://cimss.ssec.wisc.edu/satellite-blog/wp-content/uploads/sites/5/2018/11/181129_1659utc_181129_1659utc_gcomW1_amsr2_totalPrecipitableWater_windSpeed_Argentina_anim.gif)
![GCOM-W1 AMSR2 Total Precipitable Water and Wind Speed products over the North Sea at 0259 UTC on 30 November [click to enlarge]](https://cimss.ssec.wisc.edu/satellite-blog/wp-content/uploads/sites/5/2018/11/181130_0259utc_gcomW1_amsr2_totalPrecipitableWater_windSpeed_North_Sea_anim.gif)
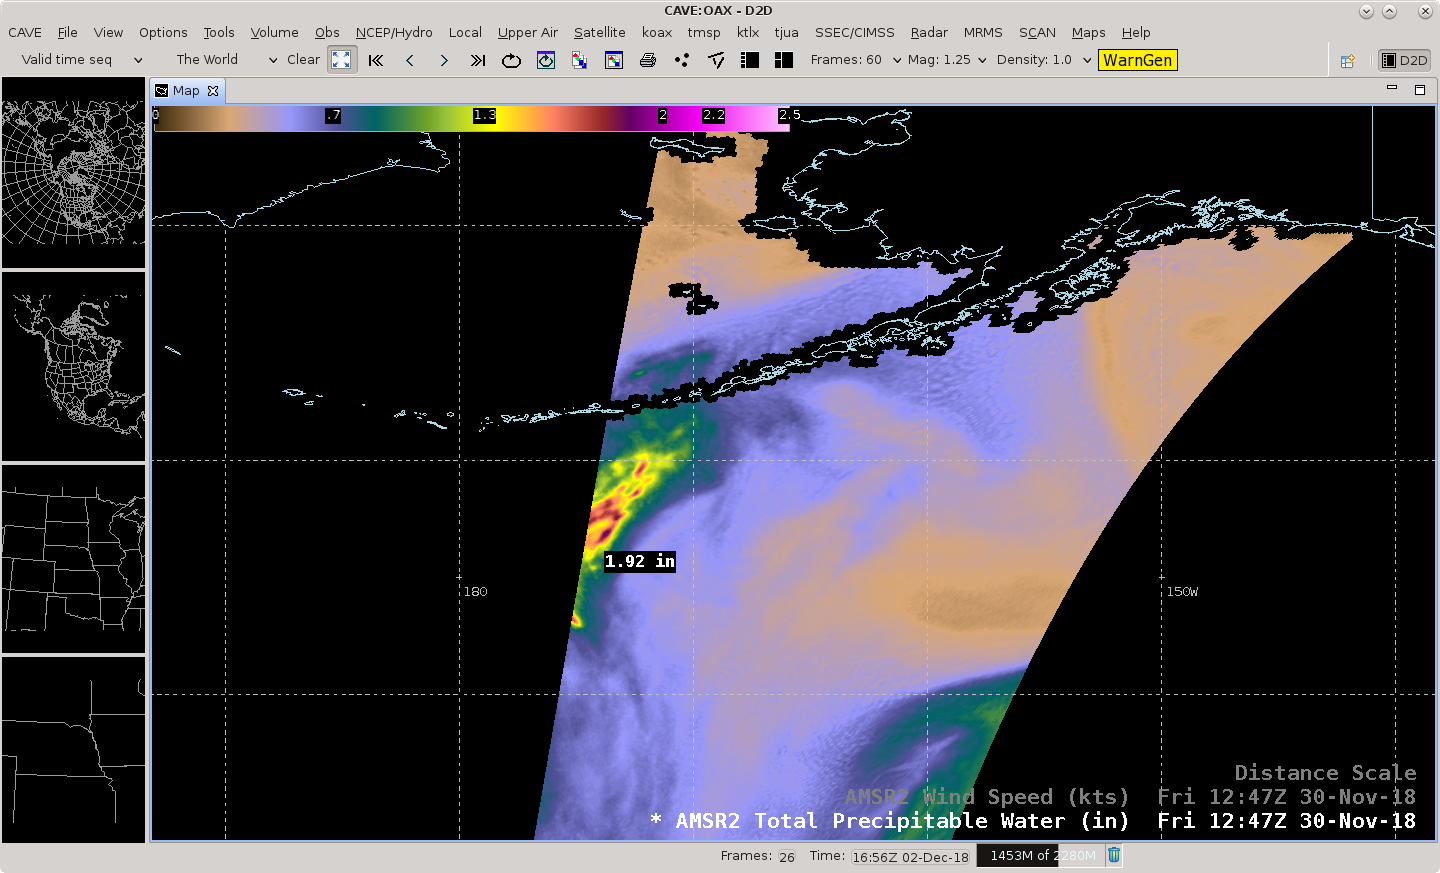
![GCOM-W1 AMSR2 Total Precipitable Water and Wind Speed products over the Aleutian Islands at 1247 UTC on 30 November [click to enlarge]](https://cimss.ssec.wisc.edu/satellite-blog/wp-content/uploads/sites/5/2018/11/181130_1247utc_gcomW1_amsr2_totalPrecipitableWater_windSpeed_Aleutians_anim.gif)
![GCOM-W1 AMSR2 Total Precipitable Water and Wind Speed products over the Barents Sea from 2256 UTC on 28 November to 0847 UTC on 29 November [click to enlarge]](https://cimss.ssec.wisc.edu/satellite-blog/wp-content/uploads/sites/5/2018/11/181128_181129_gcomW1_amsr2_totalPrecipitableWater_windSpeed_Barents_Sea_anim.gif)

/na2018_12_01_335.gif)