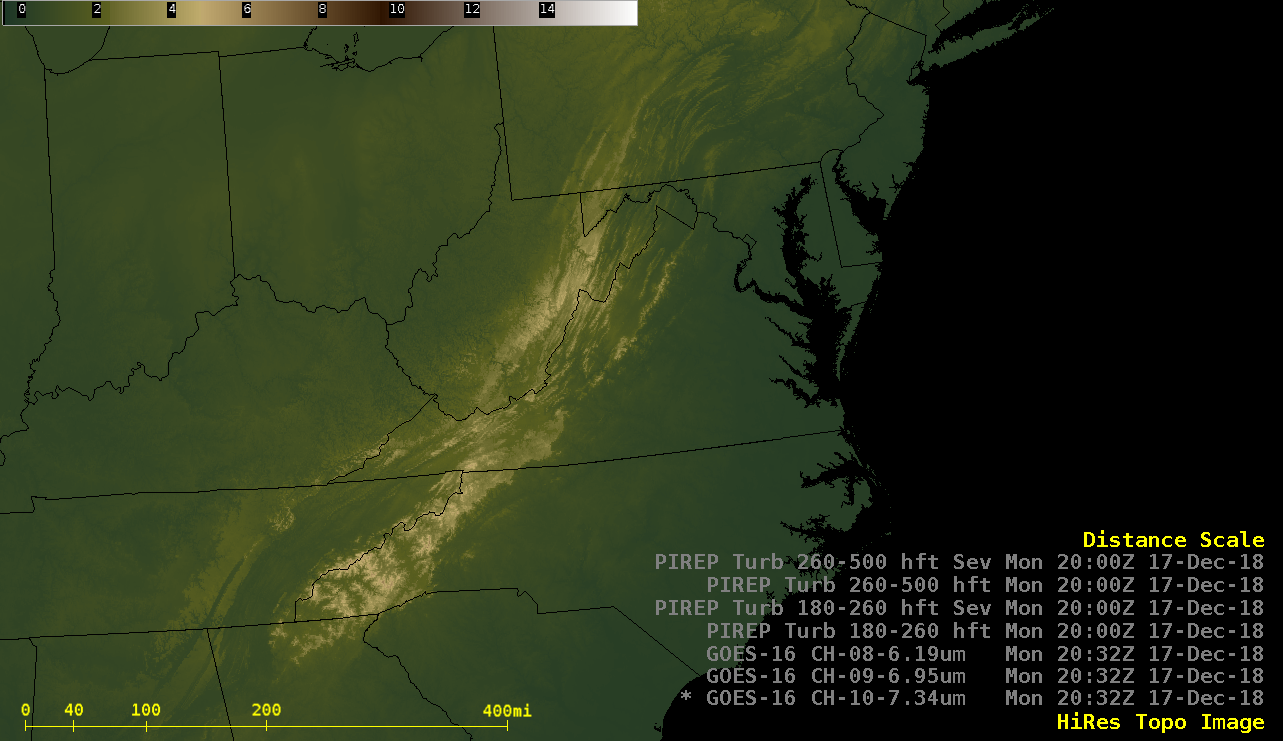
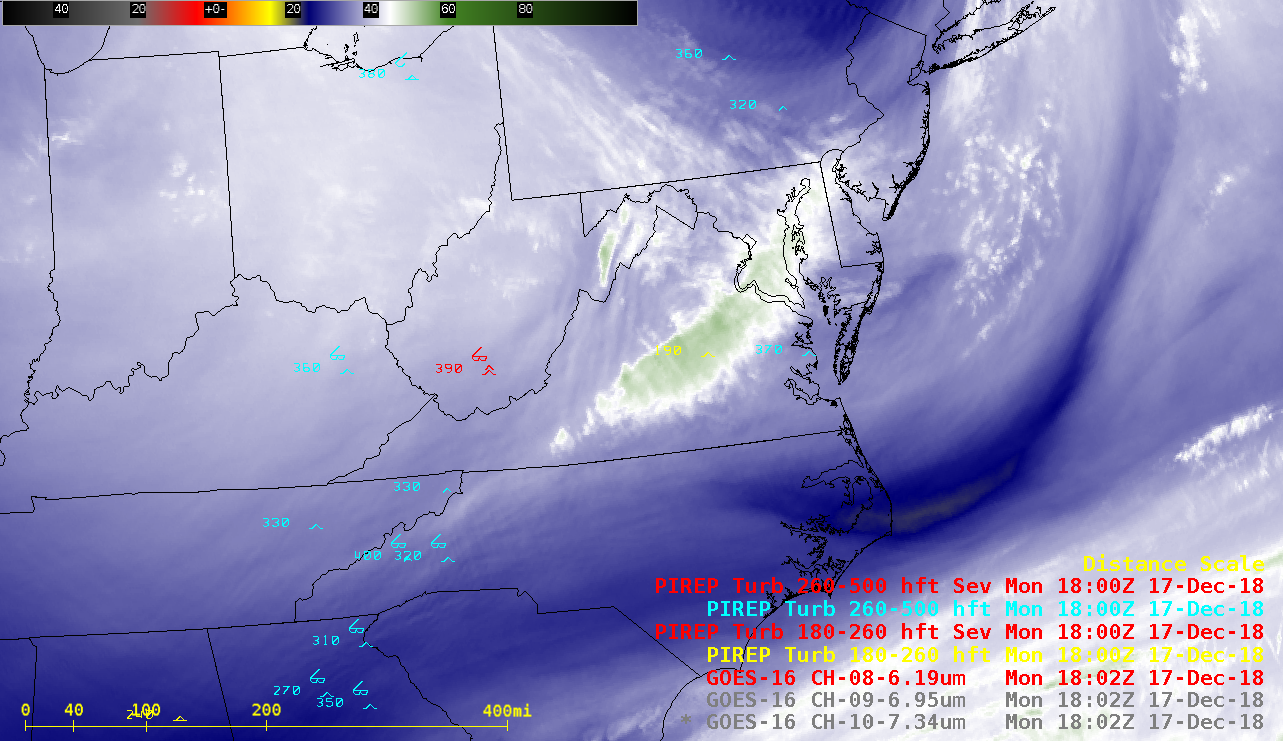
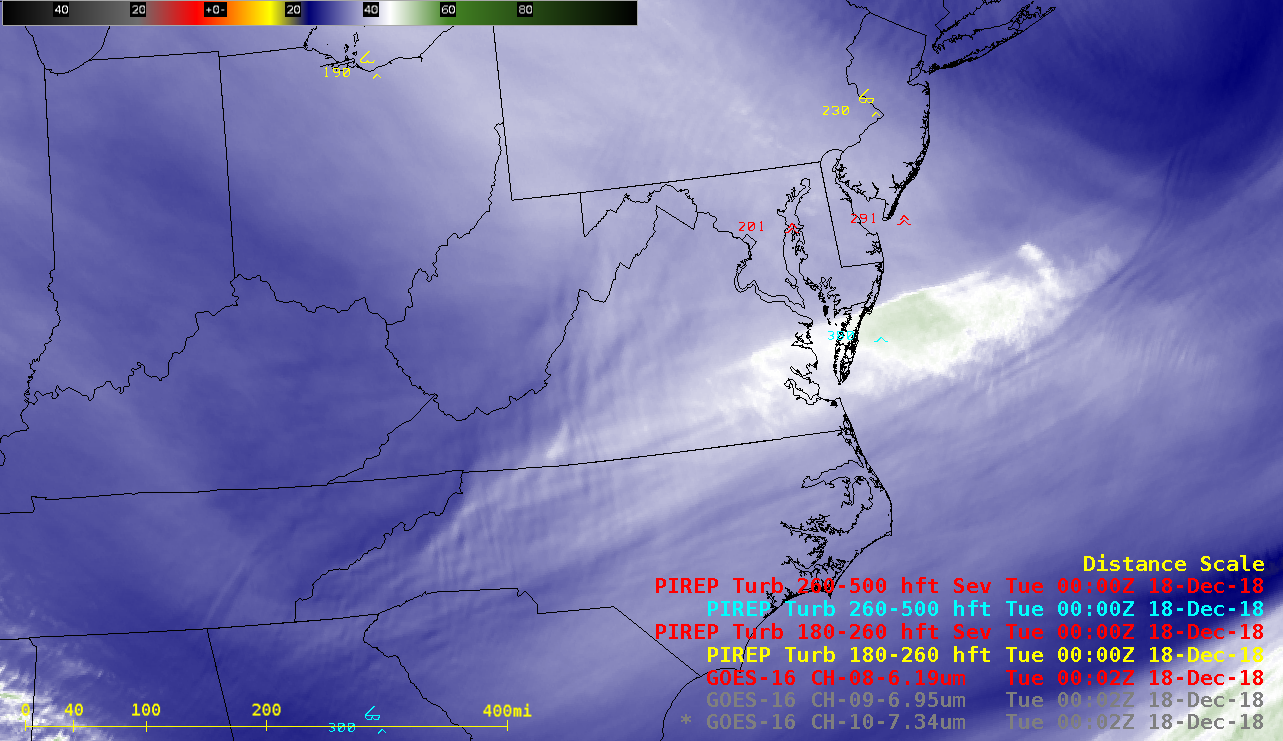
GOES-16 (GOES-East) Low-level (7.3 µm), Mid-level (6.9 µm) and Upper-level (6.2 µm) Water Vapor images (above) showed the development of an orographic standing wave cloud — downwind of the Appalachian Mountains (topography) — over the Mid-Atlantic states on 17 December 2018. North of the wave cloud, widespread short-wavelength mountain waves were seen at lower elevations... Read More
![Topography + GOES-16 Low-level (7.3 µm), Mid-level (6.9 µm) and Upper-level (6.2 µm) Water Vapor images, with pilot reports of turbulence [click to play MP4 animation]](https://cimss.ssec.wisc.edu/satellite-blog/wp-content/uploads/sites/5/2018/12/va_wv9-20181217_181216.png)
Topography + GOES-16 Low-level (7.3 µm), Mid-level (6.9 µm) and Upper-level (6.2 µm) Water Vapor images, with pilot reports of turbulence [click to play MP4 animation]
GOES-16
(GOES-East) Low-level (
7.3 µm), Mid-level (
6.9 µm) and Upper-level (
6.2 µm) Water Vapor images
(above) showed the development of an orographic standing wave cloud — downwind of the Appalachian Mountains (
topography) — over the Mid-Atlantic states on
17 December 2018. North of the wave cloud, widespread short-wavelength mountain waves were seen at lower elevations over and to the lee of the high terrain (even extending out over the Atlantic Ocean off the coast of New Jersey and New York). There were scattered pilot reports of turbulence across the region, with Severe turbulence being reported around
18 UTC and
00 UTC.
A comparison of GOES-16 Mid-level Water Vapor, Cloud Top Phase and Cloud Top Height products at 2007 UTC (below) indicated that this wave cloud was composed of Cirrus with maximum cloud tops around 30,000 feet.
![GOES-16 Mid-level Water Vapor (6.9 µm), Cloud Top Phase and Cloud Top Height products [click to enlarge]](https://cimss.ssec.wisc.edu/satellite-blog/wp-content/uploads/sites/5/2018/12/181217_2007utc_goes16_waterVapor_cloudTopPhase_cloudTopHeight_anim.gif)
GOES-16 Mid-level Water Vapor (6.9 µm), Cloud Top Phase and Cloud Top Height products [click to enlarge]
![GOES-16 Mid-level Water Vapor (6.9 µm) image at 2102 UTC, showing the orientation of a nortwest-southeast cross section [click to enlarge]](https://cimss.ssec.wisc.edu/satellite-blog/wp-content/uploads/sites/5/2018/12/va_wv9_xsec_baseline-20181217_210216.png)
GOES-16 Mid-level Water Vapor (6.9 µm) image at 2102 UTC, showing the orientation of a northwest-southeast cross section [click to enlarge]
A GOES-16 Water Vapor image at 2102 UTC
(above) showed the orientation of a northwest-to-southeast cross section of RUC40 model Relative Humidity, Wind Speed and Adiabatic Omega fields
(below). In the middle of the cross section, a couplet of downward/upward motion aloft was seen over the Glen Allen VA area, with higher relative humidity values
(shades of blue) above the 500 hPa pressure level corresponding to the wave cloud.
![Northwest-southeast cross section of RUC40 model Relative Humidity, Wind Speed and Adiabatic Omega [click to enlarge]](https://cimss.ssec.wisc.edu/satellite-blog/wp-content/uploads/sites/5/2018/12/va_ruc_xsec-20181217_210000.png)
Northwest-southeast cross section of RUC40 model Relative Humidity, Wind Speed and Adiabatic Omega [click to enlarge]
The standing wave cloud developed in the exit region of a branch of the polar jet stream that was diving southeastward across the Great Lakes — strong deceleration created an axis of deformation oriented from southwest to northeast
(below), helping the stretch the wave cloud feature as it slowly pivoted toward the southeast and along the coast. The strong downward motion component of the Omega couplet seen in the cross section was responsible for the relatively sharp upwind (northwest) edge exhibited by the wave cloud.
![GOES-16 Mid-level Water Vapor (6.9 µm) images, with RAP40 model 250 hPa isotachs and deformation vectors [click to play animation | MP4]](https://cimss.ssec.wisc.edu/satellite-blog/wp-content/uploads/sites/5/2018/12/va_wv9_250wind-20181217_210216.png)
GOES-16 Mid-level Water Vapor (6.9 µm) images, with RAP40 model 250 hPa isotachs and deformation vectors [click to play animation | MP4]
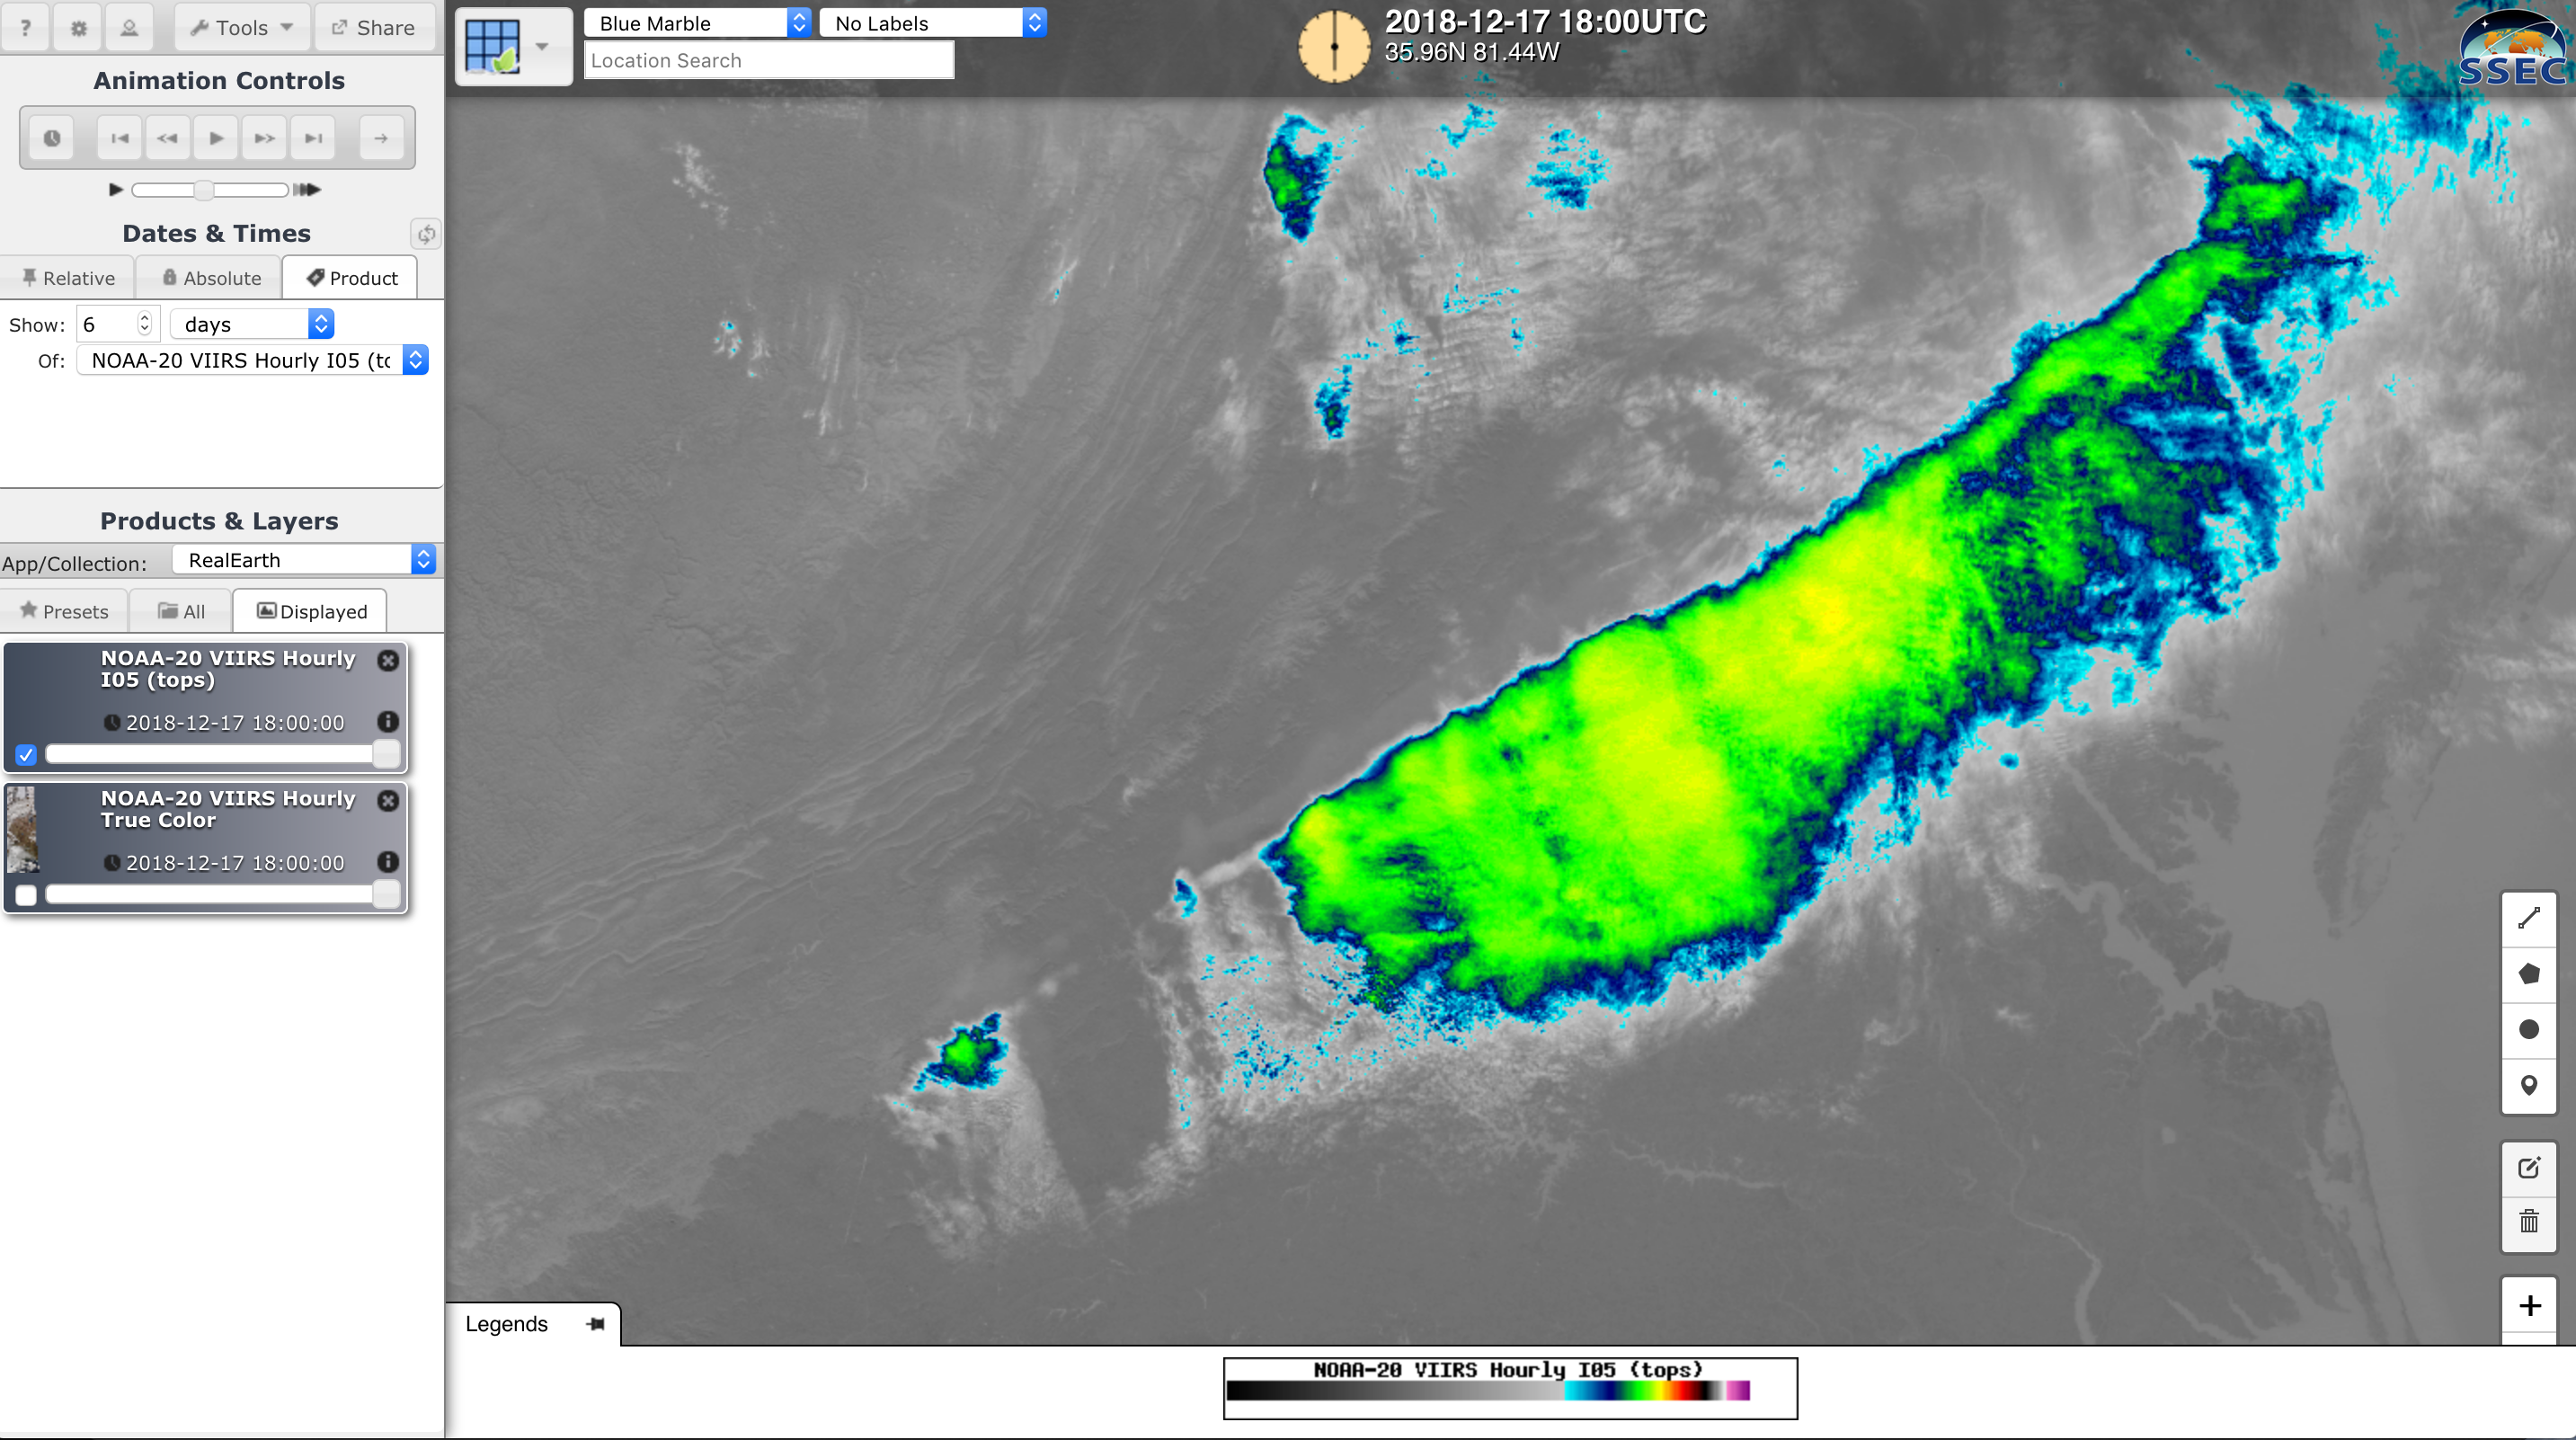
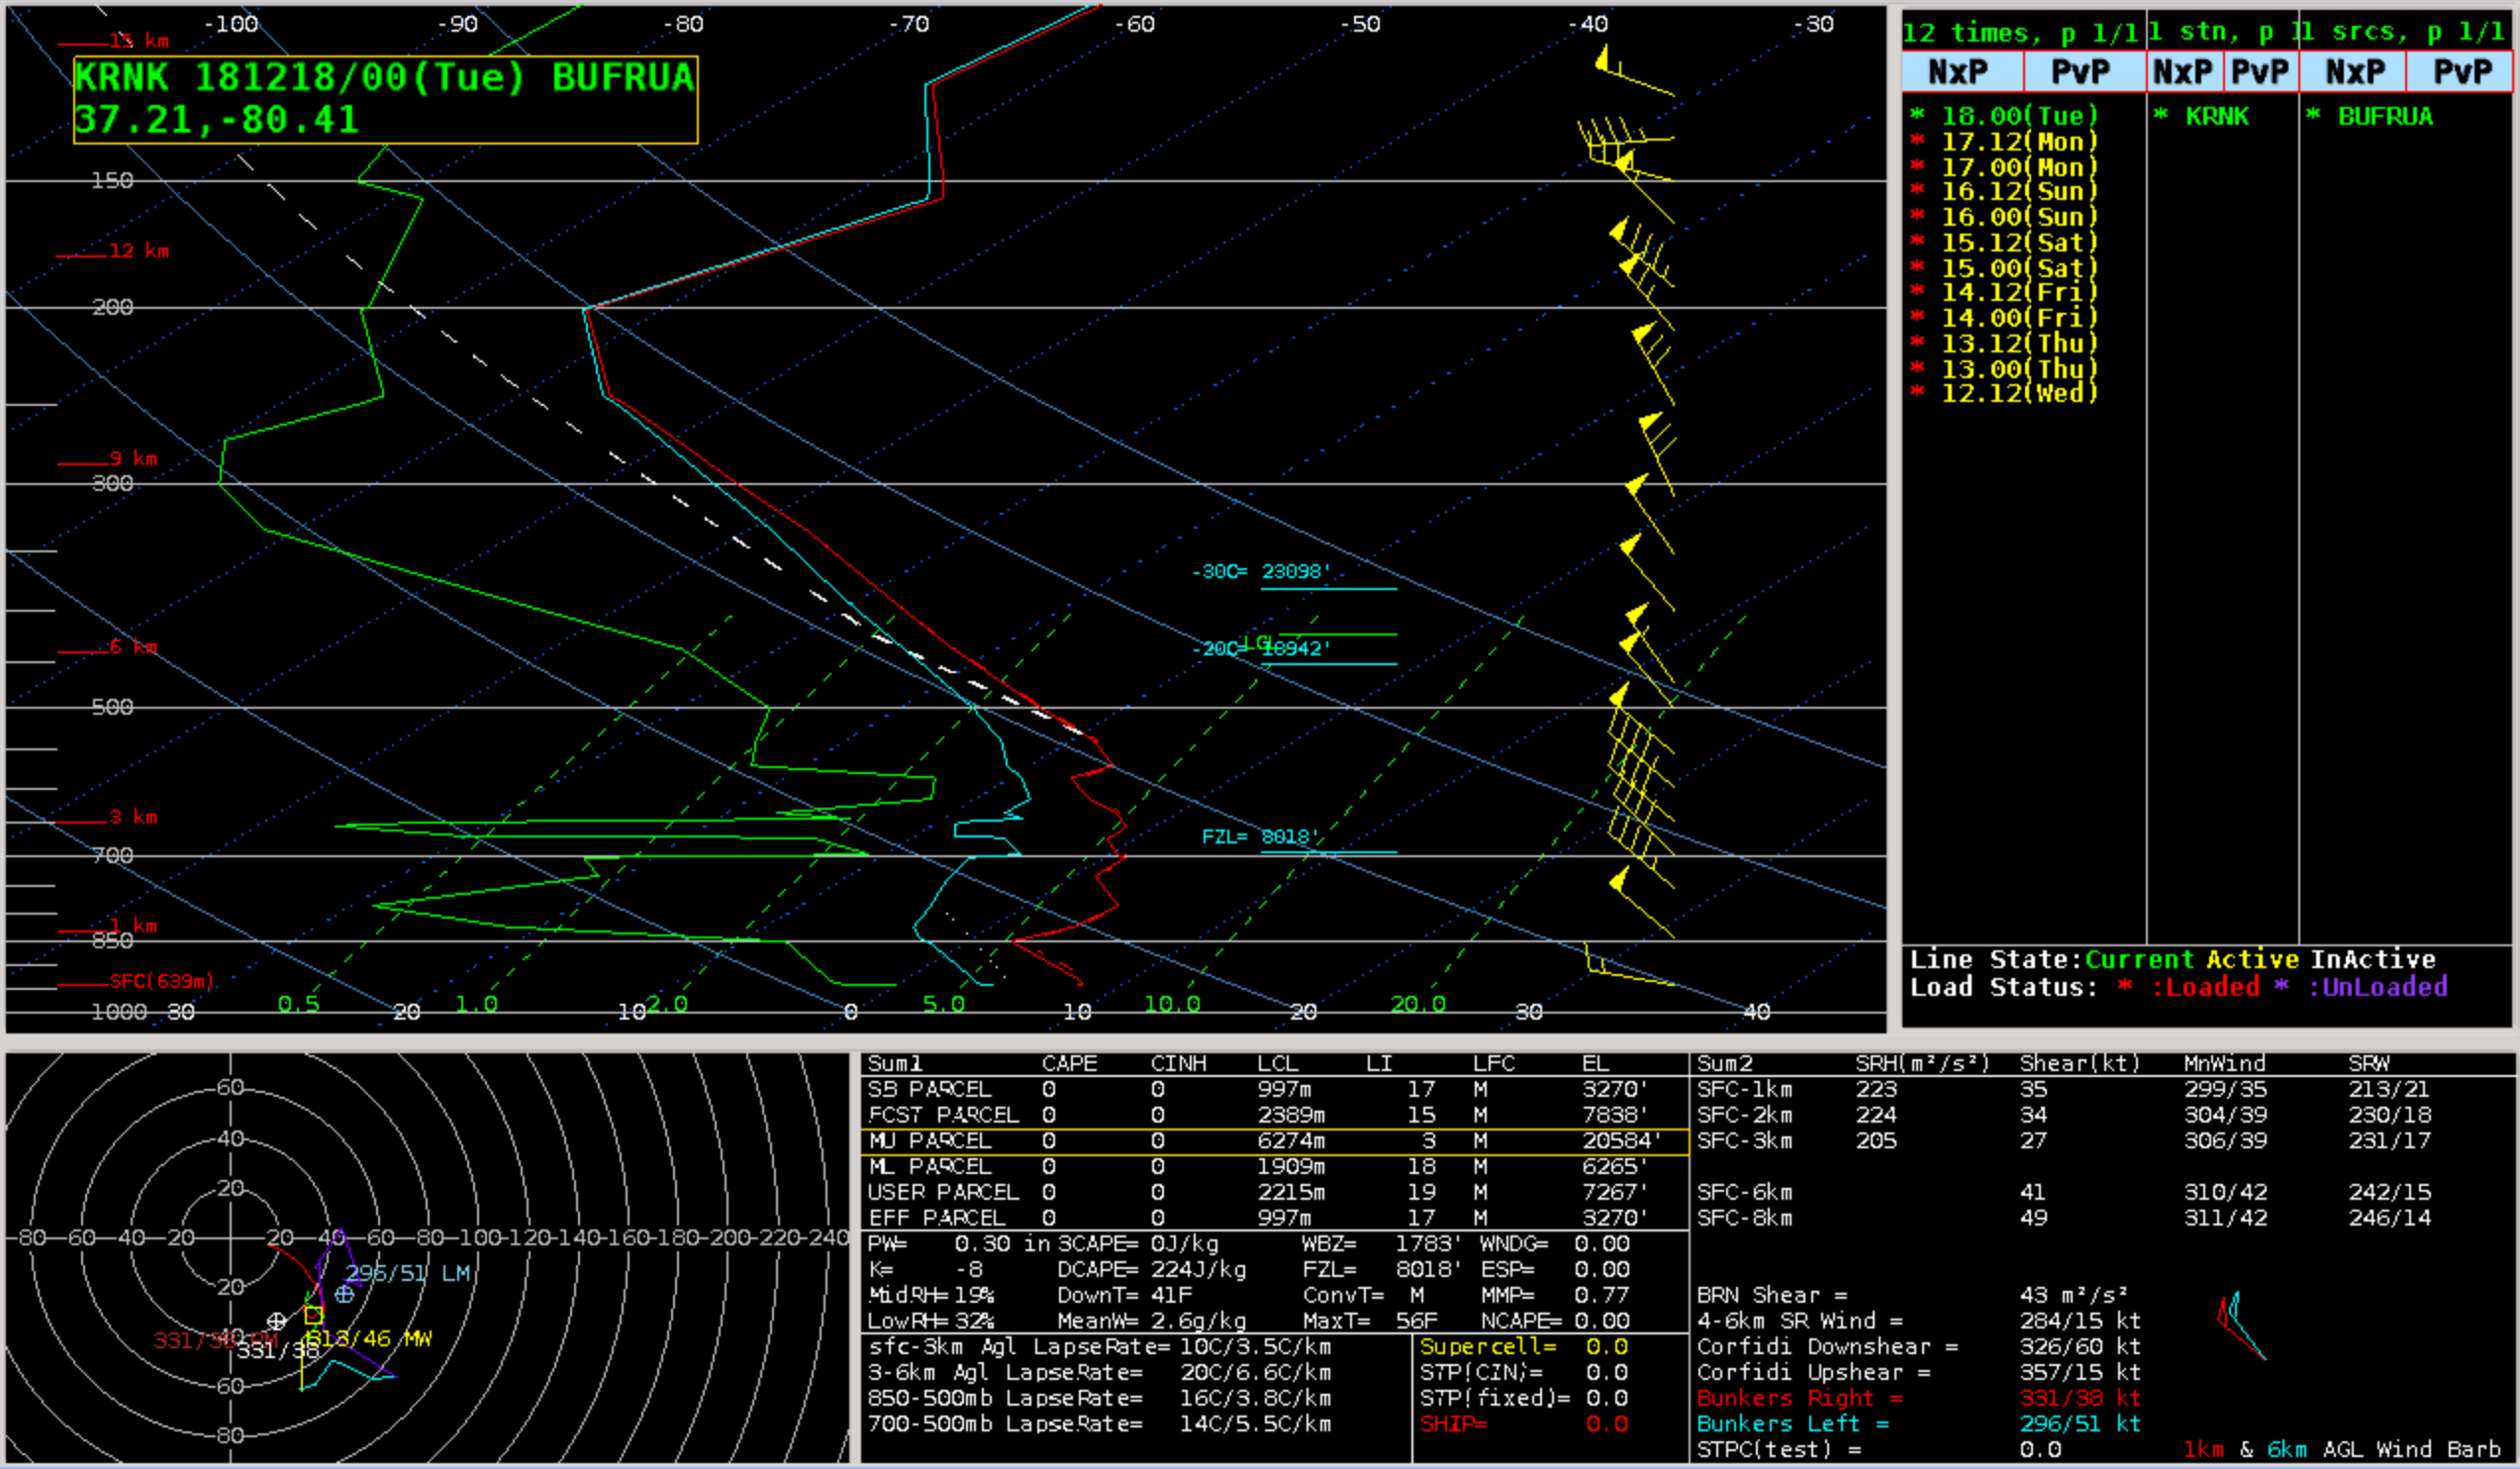
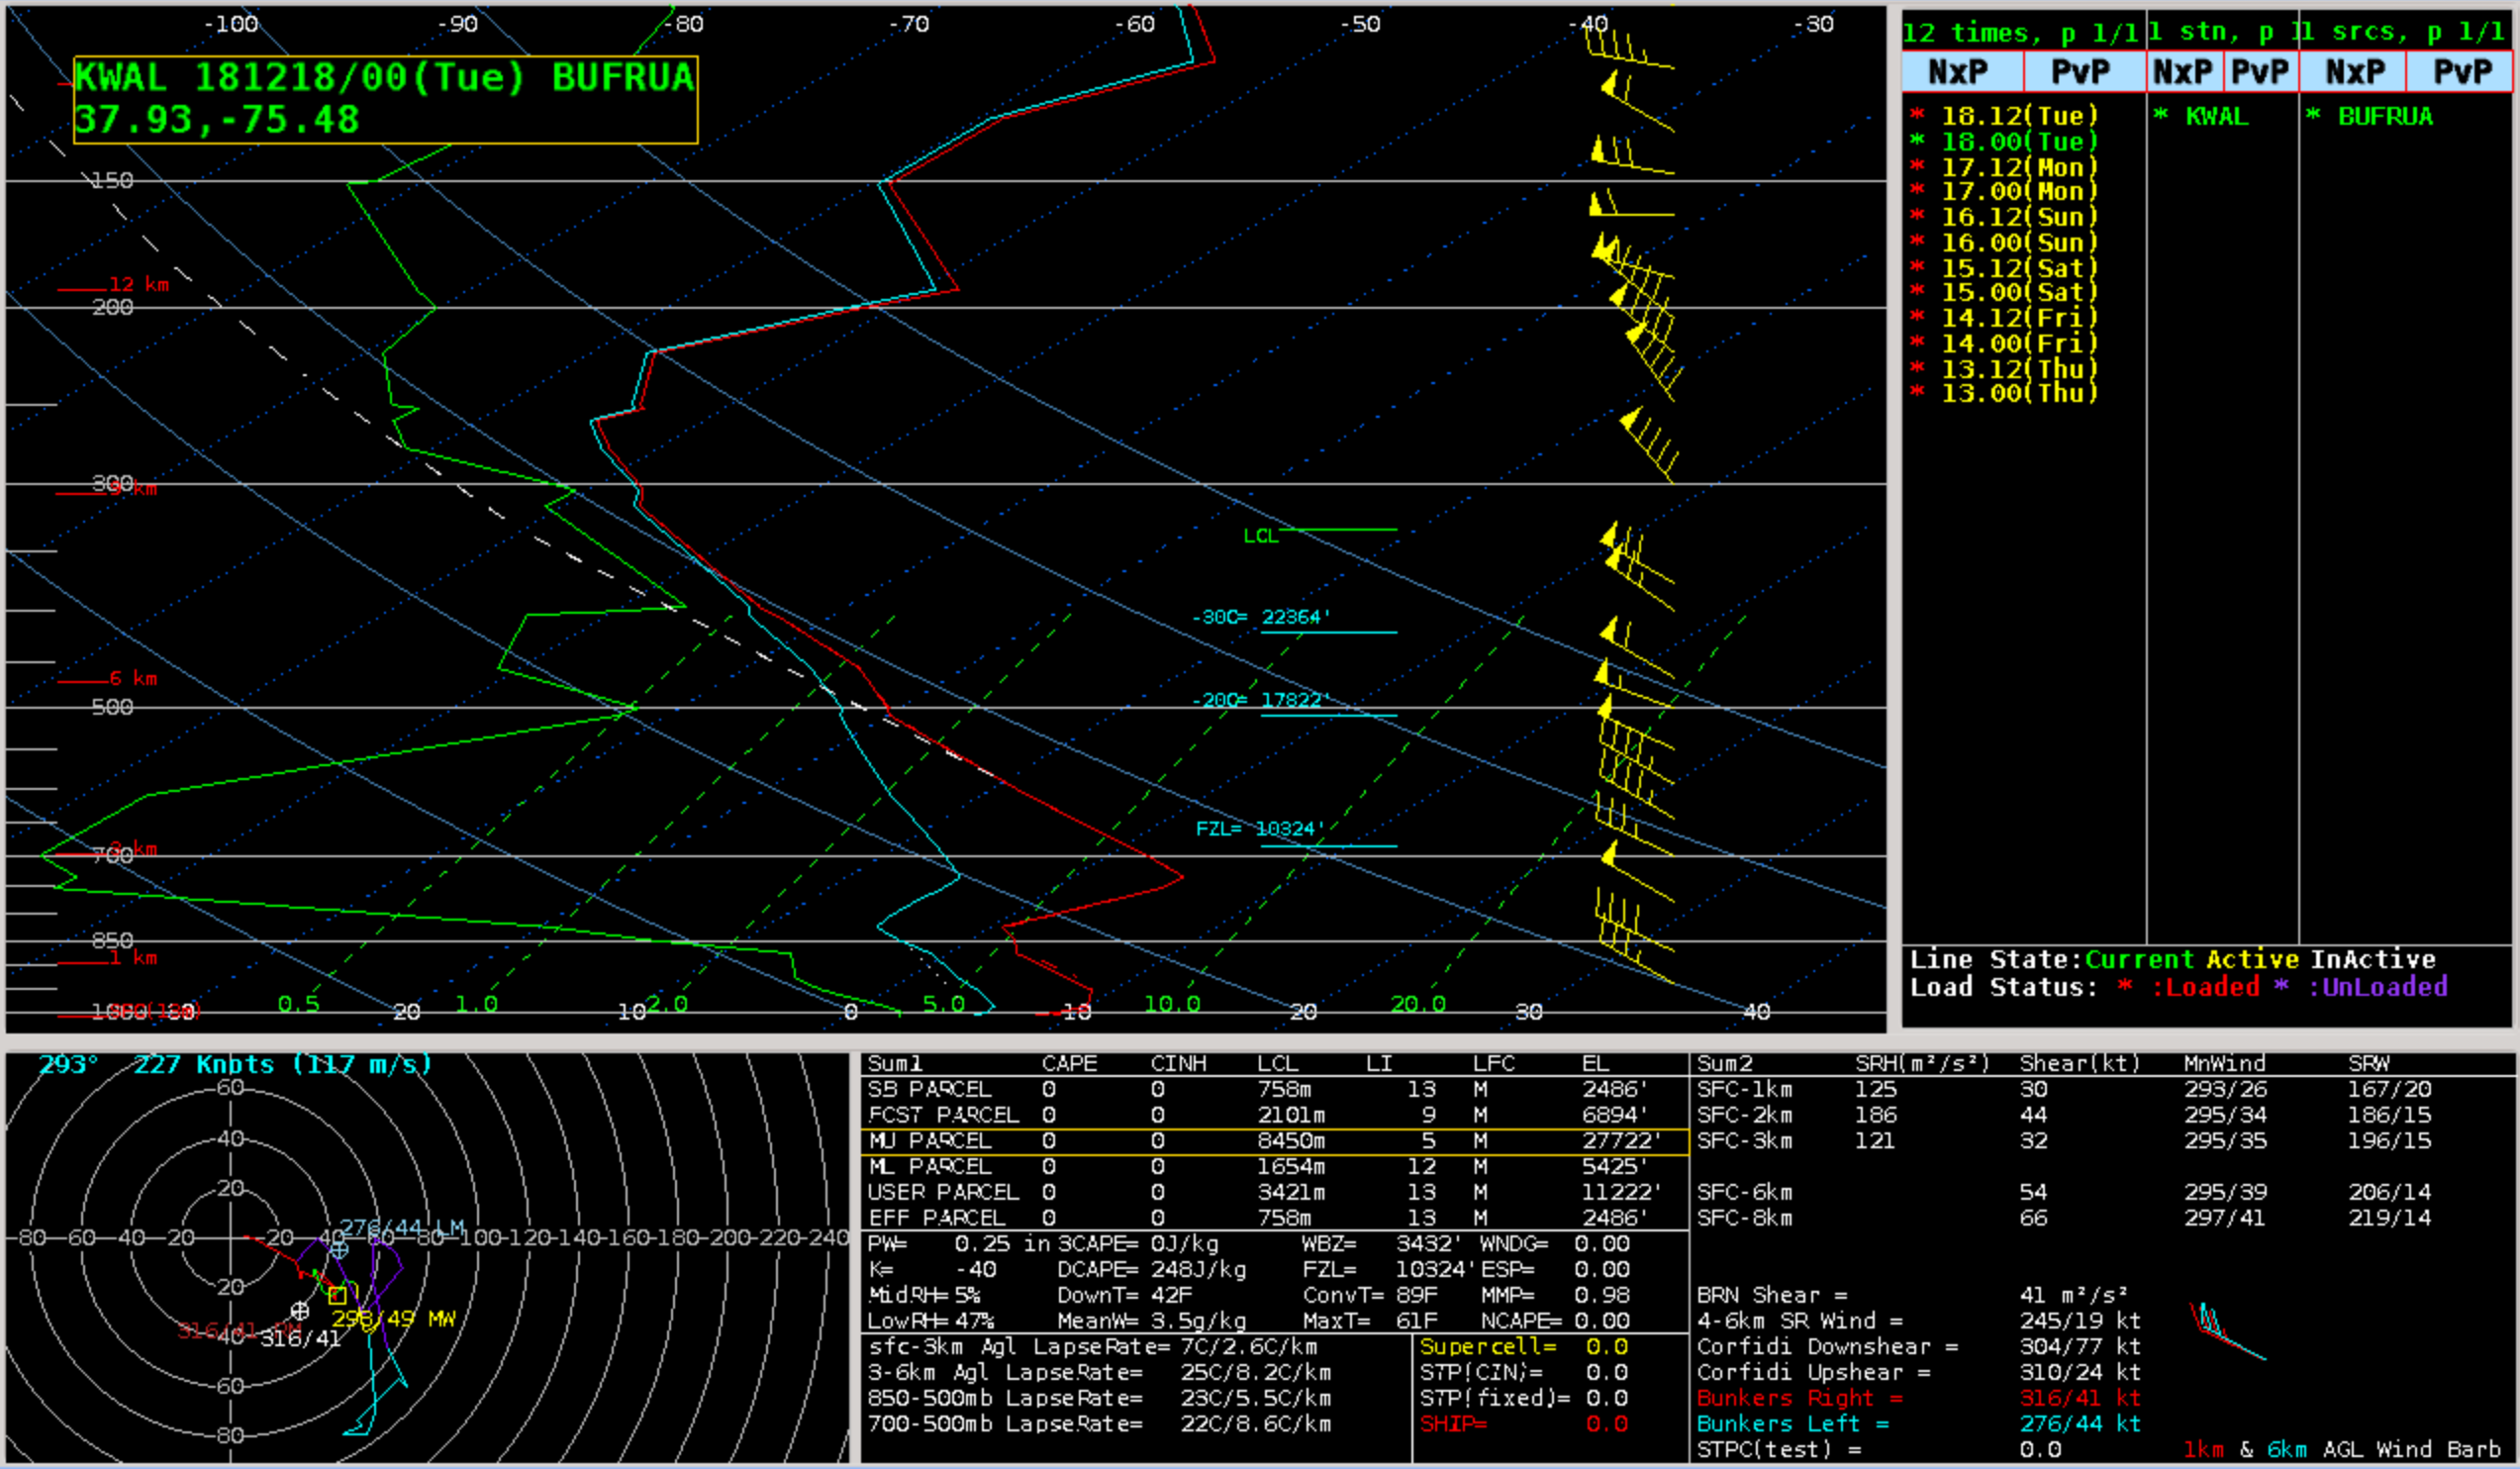
A toggle between NOAA-20 VIIRS True Color Red-Green-Blue (RGB) and Infrared Window (11.45 µm) images viewed using
RealEarth (
below) provided a detailed view of the wave cloud at 1825 UTC. The coldest cloud-top infrared brightness temperatures were around -50ºC
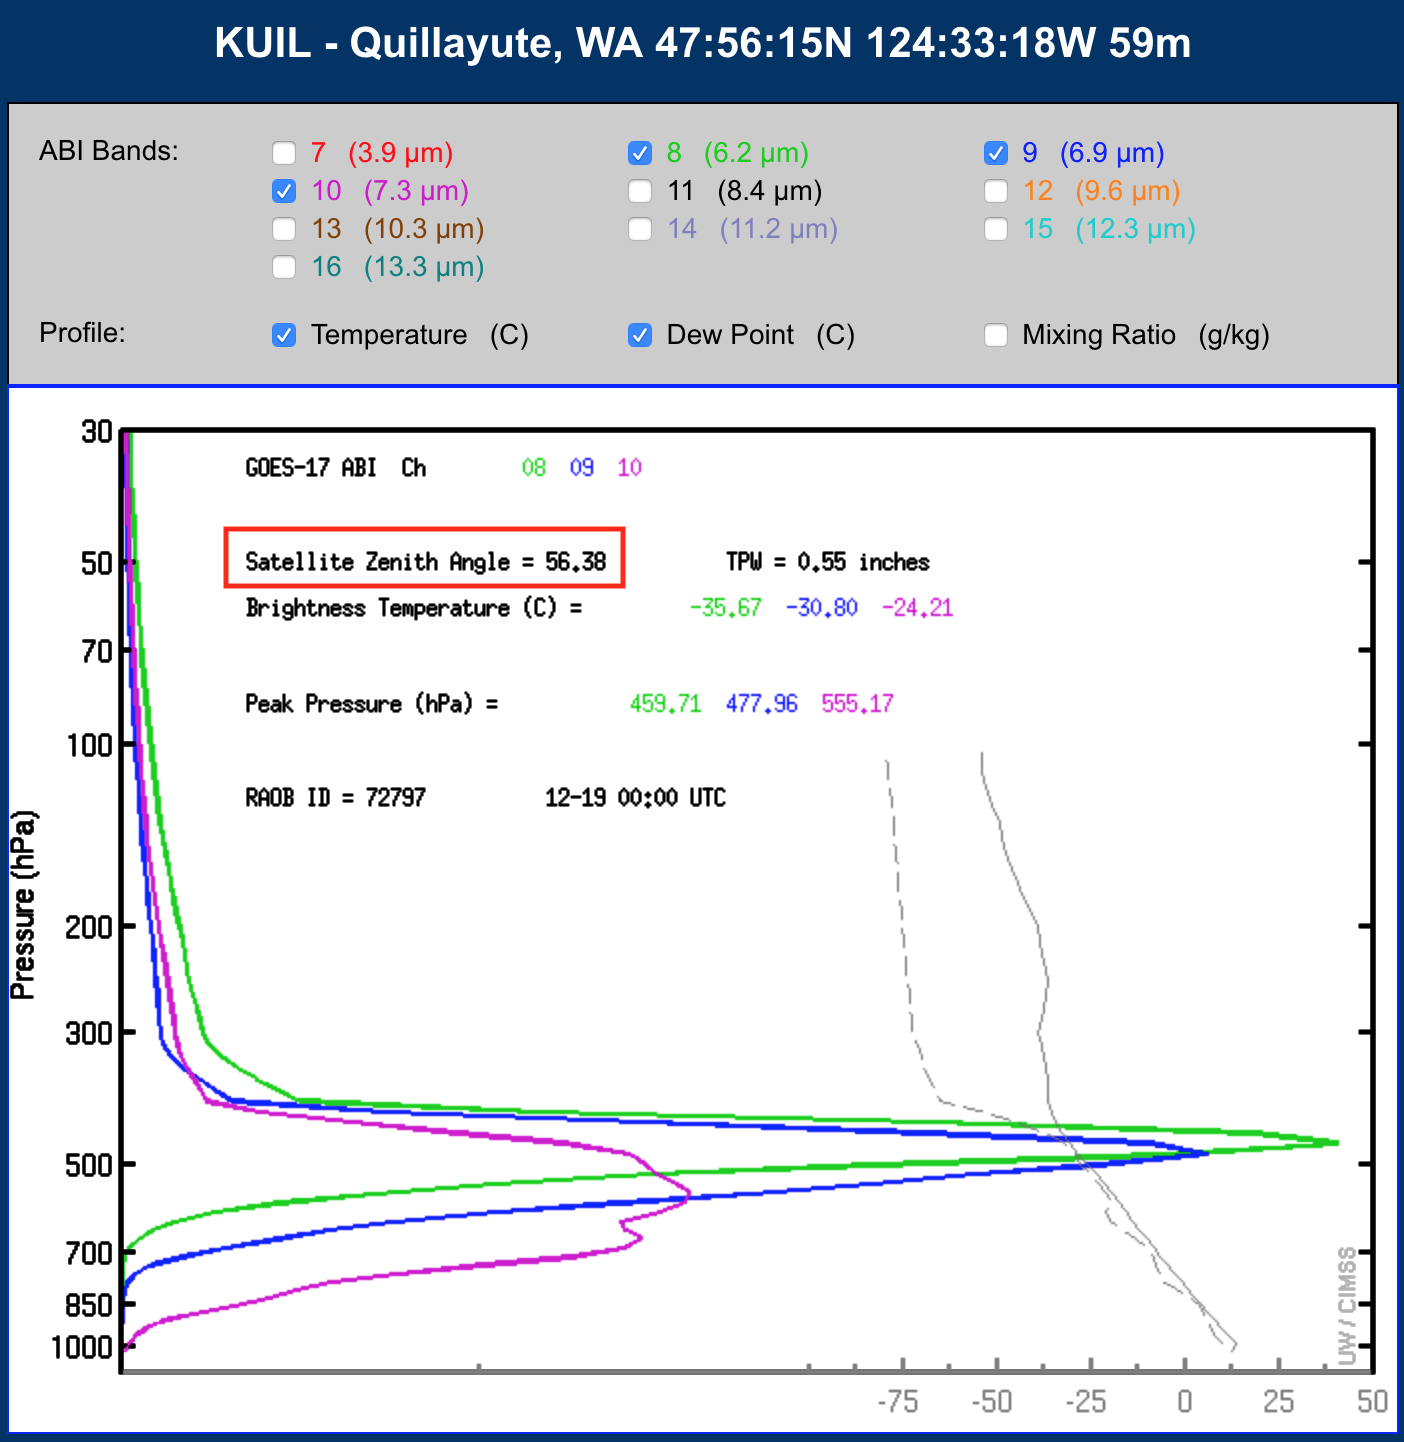
(bright yellow enhancement), which was just above the 300 hPa pressure level on 00 UTC soundings at
Roanoke/Blacksburg and
Wallops Island Virginia.
![NOAA-20 VIIRS True Color RGB and Infrared Window (11.45 µm) images [click to enlarge]](https://cimss.ssec.wisc.edu/satellite-blog/wp-content/uploads/sites/5/2018/12/181217_1825utc_noaa20_viirs_truecolor_infraredWindow_VA_anim.gif)
NOAA-20 VIIRS True Color RGB and Infrared Window (11.45 µm) images [click to enlarge]
As pointed out by Jonathan Blaes (
NWS Raleigh), these standing wave clouds can have an effect on surface temperatures beneath the feature:
A comparison of 1812 UTC Aqua MODIS Visible (0.65 µm), Infrared Window (11.0 µm), Near-Infrared “Cirrus” (1.37 µm) and Water Vapor (6.7 µm) images with plots of maximum temperatures on 17 December
(below) revealed that high temperatures were confined to the upper 50s F beneath the wave cloud, in contrast to low 60s F on either side where incoming solar radiation was not diminished.
![Aqua MODIS Visible (0.65 µm), Infrared Window (11.0 µm), Near-Infrared "Cirrus" (1.37 µm) and Water Vapor (6.7 µm) images, with plots of maximum temperatures on 17 December [click to enlarge]](https://cimss.ssec.wisc.edu/satellite-blog/wp-content/uploads/sites/5/2018/12/181217_1812utc_aqua_modis_visible_infrared_cirrus_waterVapor_MaxTemperatures_anim.gif)
Topography + Aqua MODIS Visible (0.65 µm), Infrared Window (11.0 µm), Near-Infrared “Cirrus” (1.37 µm) and Water Vapor (6.7 µm) images, with plots of maximum temperatures on 17 December [click to enlarge]
View only this post
Read Less
![Himawari-8 "Red" Visible (0.64 µm) and Shortwave Infrared (3.9 µm) images at 2350 UTC [click to enlarge]](https://cimss.ssec.wisc.edu/satellite-blog/wp-content/uploads/sites/5/2018/12/181218_2350utc_himawari8_visible_shortwaveInfrared_Bering_Sea_meteor_anim.gif)
![GOES-17 "Red" Visible (0.64 µm) images [click to play MP4 animation | MP4]](https://cimss.ssec.wisc.edu/satellite-blog/wp-content/uploads/sites/5/2018/12/181218_goes17_visible_Bering_Sea_meteor_anim.gif)
![GOES-17 "Clean" Infrared Window (10.3 µm) images, with plots of hourly surface reports and SPC storm reports [click to play animation | MP4]](https://cimss.ssec.wisc.edu/satellite-blog/wp-content/uploads/sites/5/2018/12/181218_goes17_infrared_spcStormReports_WA_tornado_anim.gif)
![GOES-17 "Red" Visible (0.64 µm) image at 2147 UTC, with SPC tornado report plots at their actual and "parallax-corrected" locations [click to enlarge]](https://cimss.ssec.wisc.edu/satellite-blog/wp-content/uploads/sites/5/2018/12/181218_2147utc_goes17_visible_spcStormReport_parallax_WA_tornado_anim.gif)
![GOES-17 "Clean" Infrared Window (10.3 µm) image at 2147 UTC, with SPC tornado report plots at their actual and "parallax-corrected" locations [click to enlarge]](https://cimss.ssec.wisc.edu/satellite-blog/wp-content/uploads/sites/5/2018/12/181218_2147utc_goes17_infrared_spcStormReport_parallax_WA_tornado_anim.gif)
![VIIRS Infrared Window (11.45 µm) images from Suomi NPP (overpass time 2042 UTC) and NOAA-20 (overpass time 2132 UTC) [click to enlarge]](https://cimss.ssec.wisc.edu/satellite-blog/wp-content/uploads/sites/5/2018/12/181218_suomiNPP_noaa20_viirs_infrared_WA_tornado_anim.gif)
![NOAA-20 VIIRS Infrared Window (11.45 µm) images at 1952 UTC and 2032 UTC [click to enlarge]](https://cimss.ssec.wisc.edu/satellite-blog/wp-content/uploads/sites/5/2018/12/181218_noaa20_viirs_infraredWindow_WA_anim.gif)
![Water Vapor weighting functions derived using 12 UTC rawinsonde data from Tallahassee, Florida [click to enlarge]](https://cimss.ssec.wisc.edu/satellite-blog/wp-content/uploads/sites/5/2018/12/181218_12utc_ktae_wv_wf.png)
![Plot of 12 UTC rawinsonde data from Tallahassee, Florida [click to enlarge]](https://cimss.ssec.wisc.edu/satellite-blog/wp-content/uploads/sites/5/2018/12/181218_12utc_ktae_raob.png)
![GOES-16 Infrared and Water Vapor winds [click to play animation]](https://cimss.ssec.wisc.edu/satellite-blog/wp-content/uploads/sites/5/2018/12/181218_goes16_infrared_waterVapor_derivedMotionWinds_Atlantic_anim.gif)
![GOES-16 Mid-level Water Vapor (6.9 µm) images, with RAP40 model 250 hPa isotachs and deformation vectors [click to play animation | MP4]](https://cimss.ssec.wisc.edu/satellite-blog/wp-content/uploads/sites/5/2018/12/181217_goes16_waterVapor_250windSpeed_250Deformation_anim.gif)
