A major outbreak of severe thunderstorms (SPC Storm Reports) occurred across the Deep South on 12 April 2020. 1-minute Mesoscale Domain Sector GOES-16 (GOES-East) “Red” Visible (0.64 µm) images (above) showed the development and propagation of deep convection during the 1200-2359 UTC period. The corresponding GOES-16 “Clean” Infrared Window (10.35 µm) images are shown below.Some of the strongest... Read More
![GOES-16 "Red" Visible (0.64 µm) images [click to play animation | MP4]](https://cimss.ssec.wisc.edu/satellite-blog/images/2020/04/es_vis-20200412_210121.png)
GOES-16 “Red” Visible (0.64 µm) images [click to play animation | MP4]
A major outbreak of severe thunderstorms (
SPC Storm Reports) occurred across the Deep South on
12 April 2020. 1-minute
Mesoscale Domain Sector GOES-16
(GOES-East) “Red” Visible (
0.64 µm) images
(above) showed the development and propagation of deep convection during the 1200-2359 UTC period. The corresponding GOES-16 “Clean” Infrared Window (
10.35 µm) images are shown below.
GOES-16 “Clean” Infrared Window (10.35 µm) images [click to play animation | MP4]
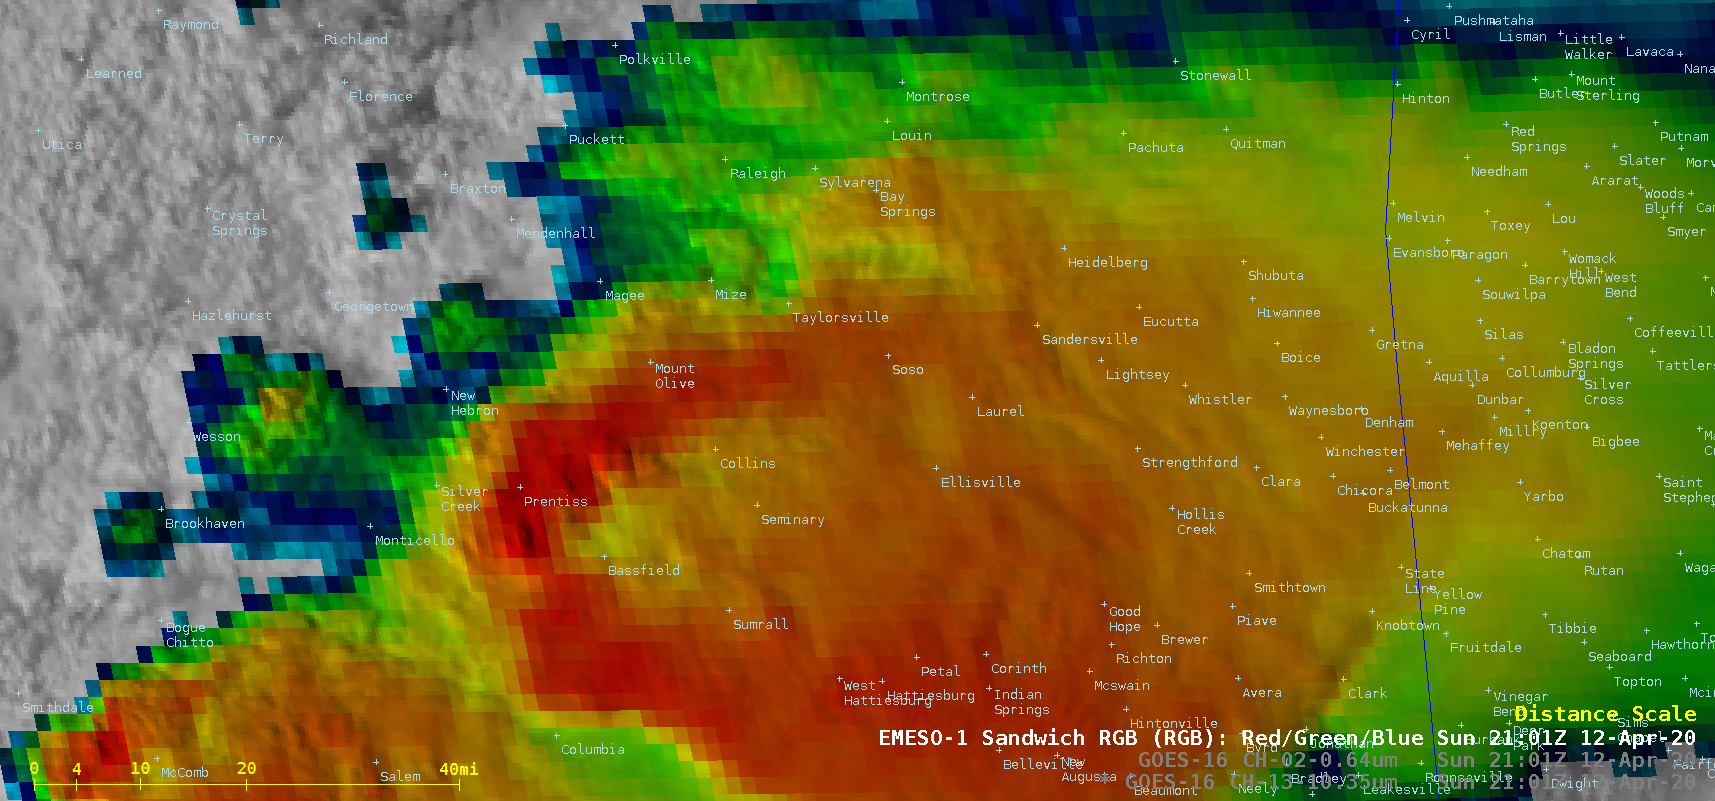
Some of the strongest long-track tornadoes occurred in southern Mississippi — a closer view of GOES-16 Visible, Infrared and Visible/Infrared Sandwich Red-Green-Blue (RGB) images
(below) revealed the pulsing nature of overshooting tops — which exhibited cloud-top infrared brightness temperatures as cold as -7
7ºC at 2038-2039 UTC, about 35 minutes prior to the destructive tornado that moved through Bassfield — and well defined “enhanced-v” signatures were apparent in the Infrared and RGB imagery, with that signature’s warm wake immediate downwind (east) of the overshooting tops indicating the likely presence of Above-Anvil Cirrus Plumes.
![GOES-16 "Red" Visible (0.64 µm ), "Clean" Infrared Window (10.35 µm), and Visible/Infrared Sandwich RGB images [click to play animation | MP4]](https://cimss.ssec.wisc.edu/satellite-blog/images/2020/04/es_ms_rgb-20200412_210121.png)
GOES-16 “Red” Visible (0.64 µm ), “Clean” Infrared Window (10.35 µm) and Visible/Infrared Sandwich RGB images [click to play animation | MP4]
![GOES-16 "Red" Visible (0.64 µm) images, with time-matched SPC Storm Reports plotted in red [click to play animation | MP4]](https://cimss.ssec.wisc.edu/satellite-blog/images/2020/04/G16_VIS_GULF_SVR_12APR2020_B2_2020103_211421_GOES-16_0001PANEL_FRAME00555.GIF)
GOES-16 “Red” Visible (0.64 µm) images, with time-matched SPC Storm Reports plotted in red [click to play animation | MP4]
1-minute GOES-16 Visible images
(above) and Infrared images
(below) include plots of time-matched SPC Storm Reports.
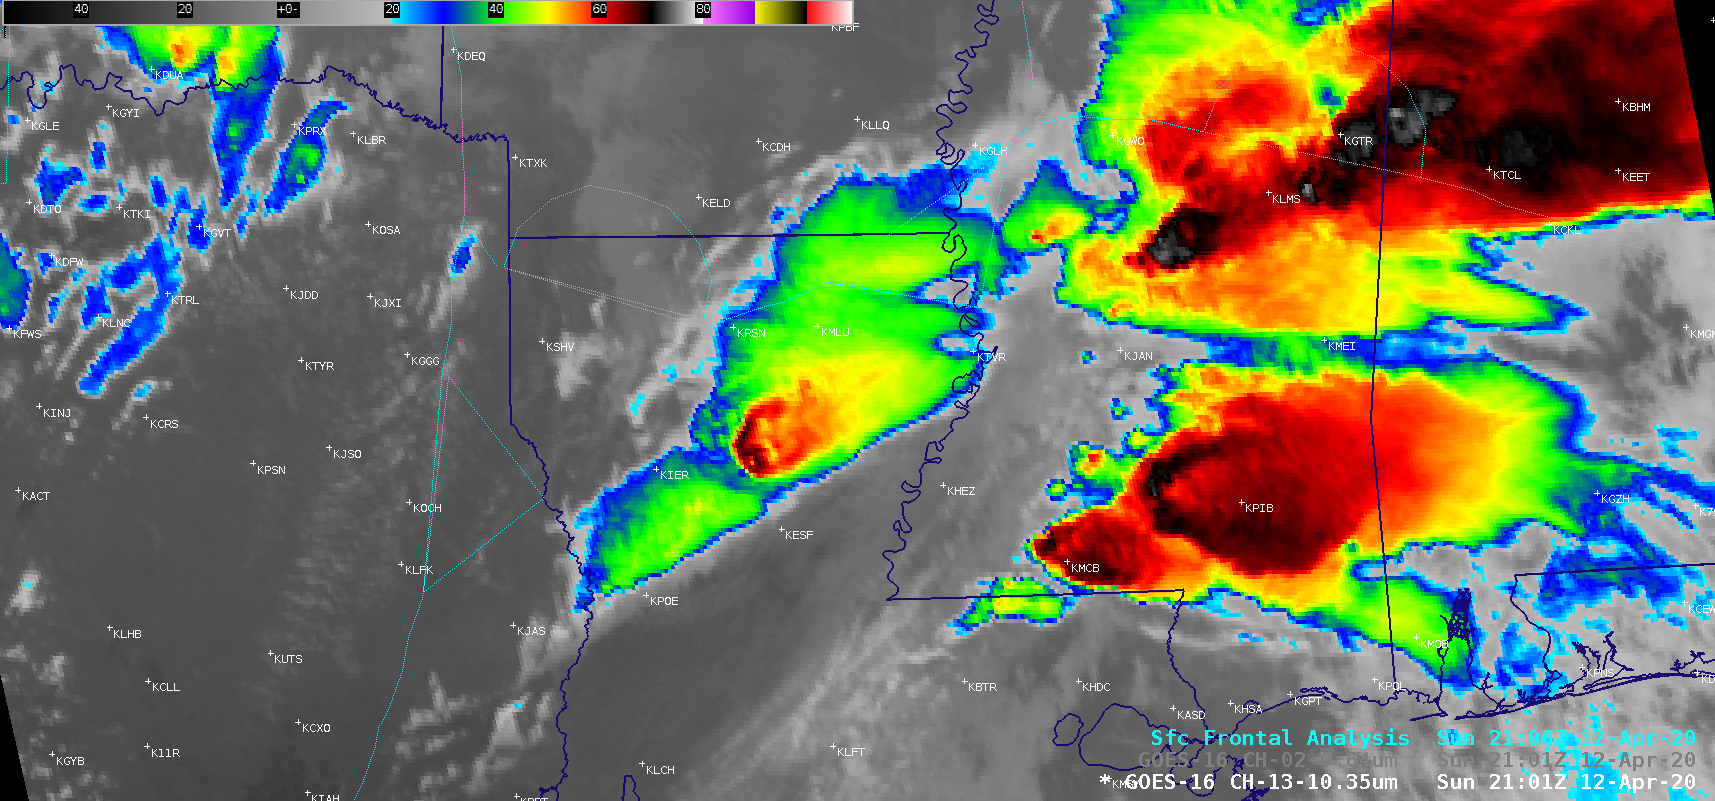
![GOES-16 "Clean" Infrared Window (10.35 µm) images, with time-matched SPC Storm Reports plotted in cyan [click to play animation | MP4]](https://cimss.ssec.wisc.edu/satellite-blog/images/2020/04/G16_IR_GULF_SVR_12APR2020_B13_2020103_211421_GOES-16_0001PANEL_FRAME00555.GIF)
GOES-16 “Clean” Infrared Window (10.35 µm) images, with time-matched SPC Storm Reports plotted in cyan [click to play animation | MP4]
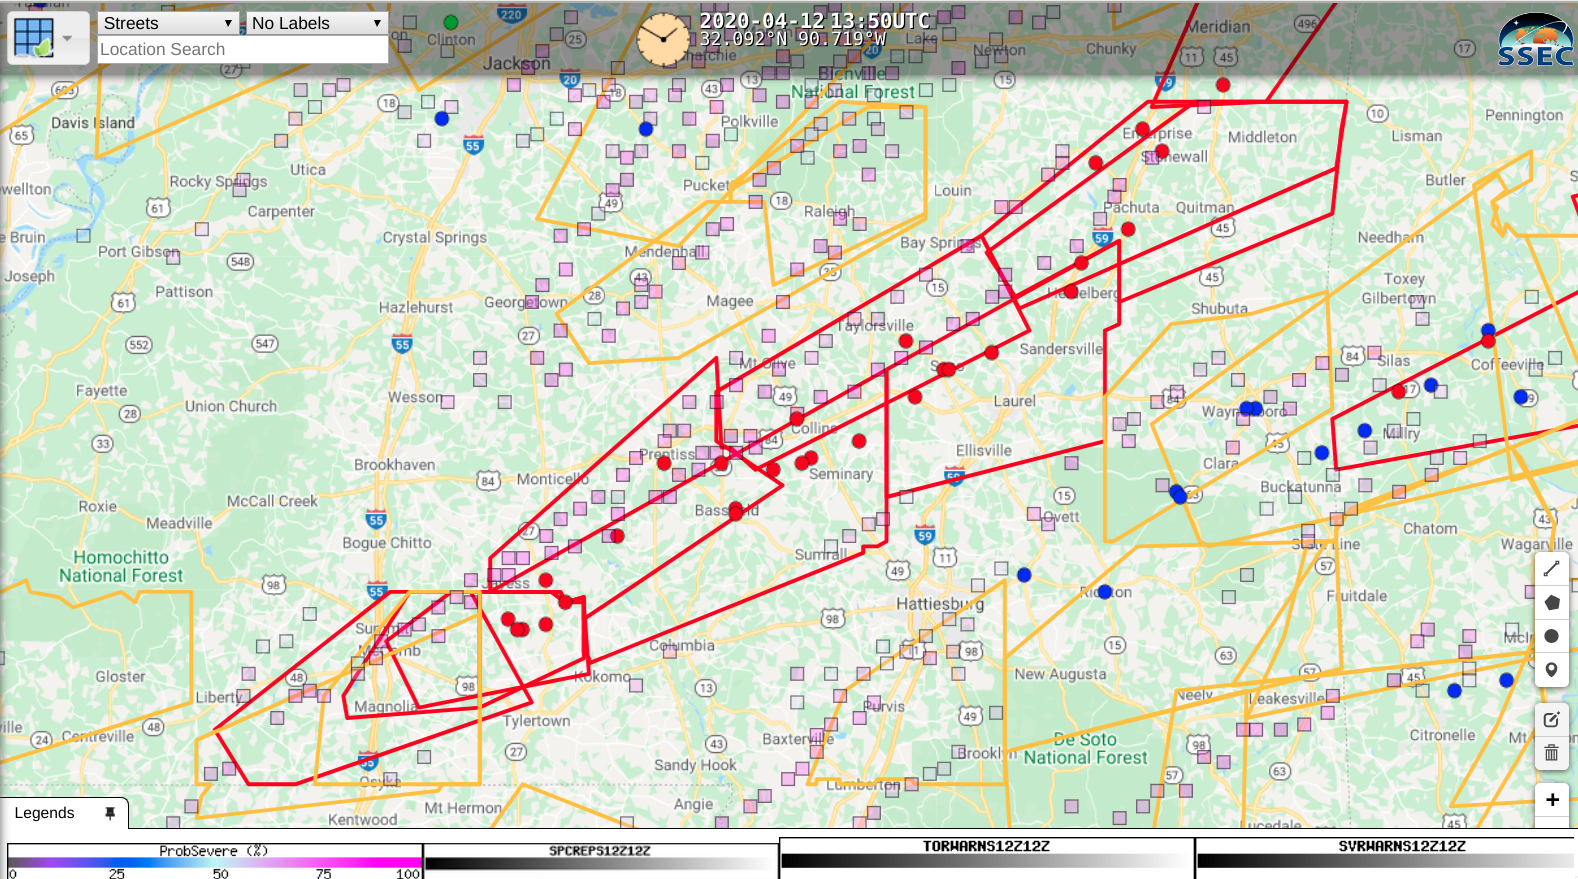
is a tool that could have been used during this outbreak to identify which radar cells were most likely to produce severe weather. The image below, from
here, shows the reports of severe weather, the warning polygons, and ProbSevere locations (a closer view of the Mississippi tornadoes can be seen
here).
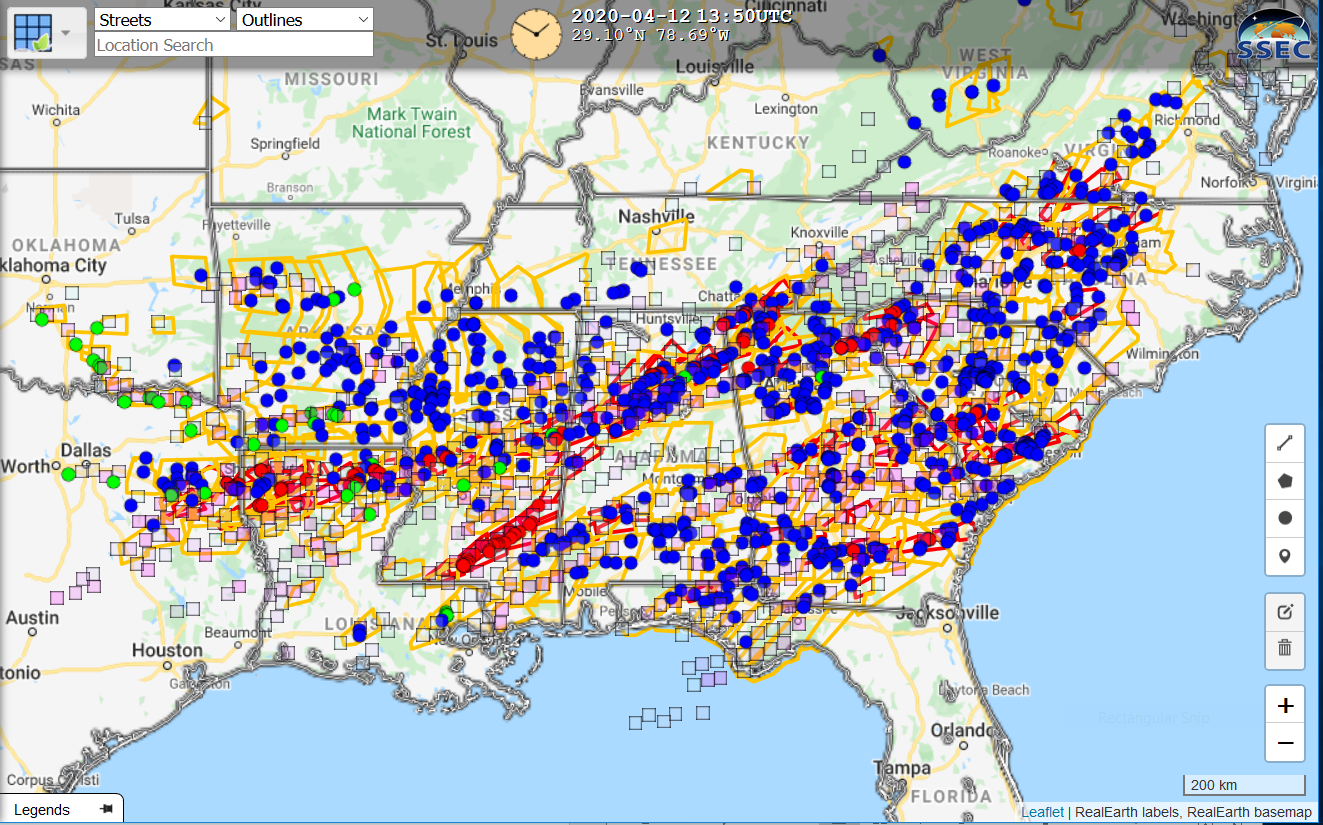
Severe weather reports from 12 April 2020 (Green: Hail; Blue: Wind; Red: Tornado), NWS Warning Polygons and ProbSevere locations (plotted as boxes when ProbSevere exceeded 50% (Click to enlarge)
===== 14 April Update =====
GOES-16 “Red” Visible (0.64 µm) and Normalized Difference Vegetation Index images [click to enlarge]
Southwest-to-northeast oriented tornado damage paths in southern Mississippi were evident in a toggle between GOES-16 Visible and Normalized Difference Vegetation Index (NDVI) images
(above). NDVI values within the damage path were generally 0.6, compared to 0.7-0.8 in adjacent areas. According the the NWS Jackson
storm survey, the maximum path width of the longest-track (~67 mile) EF-4 tornado that began near Bassfield was about 2 miles — the widest ever measured in Mississippi, and one of the widest tornado damage paths ever measured in the US.
In a toggle between Aqua MODIS NDVI and Land Surface Temperature (LST) images (below), LST values were 5-10ºF warmer — low 80s F, darker shades of red — within the tornado damage path, compared to areas adjacent to the path.
![Aqua MODIS Normalized Difference Vegetation Index and Land Surface Temperature images [click to enlarge]](https://cimss.ssec.wisc.edu/satellite-blog/images/2020/04/200414_1926utc_aqua_modis_normalizedDifferenceVegetationIndex_landSurfaceTemperature_MS_tornado_damage_paths_anim.gif)
Aqua MODIS Normalized Difference Vegetation Index and Land Surface Temperature images [click to enlarge]
The tornado damage paths were also apparent in a comparison of before (26 March) and after (14 April) Aqua MODIS True Color RGB images
(below) from the
MODIS Today site. Note that 2 smoke plumes were seen on the 26 March image.
![Aqua MODIS True Color RGB images from 26 March and 14 April [click to enlarge]](https://cimss.ssec.wisc.edu/satellite-blog/images/2020/04/200326_200414_aqua_modis_trueColorRGB_MS_tornado_damage_path_v2_anim.gif)
Aqua MODIS True Color RGB images from 26 March and 14 April [click to enlarge]
and
False-color imagery from NOAA-20 (from
this (temporary) website) also show the damage path.

True- and False-Color imagery from the afternoon NOAA-20 overpass on 14 April 2020 (Click to enlarge)
NOAA-20 True Color RGB imagery of the Mississippi EF-4 tornado damage path that had a maximum with of 2 miles is shown below, using RealEarth.
![NOAA-20 VIIRS True Color RGB image, including county outlines and map labels [click to enlarge]](https://cimss.ssec.wisc.edu/satellite-blog/images/2020/04/200414_1850utc_noaa20_viirs_trueColorRGB_MS_EF4_tornado_damage_path_anim.gif)
NOAA-20 VIIRS True Color RGB image, including county outlines and map labels [click to enlarge]
A StoryMap of this event in South Carolina, created by the NWS in Columbia SC, is here.
View only this post
Read Less
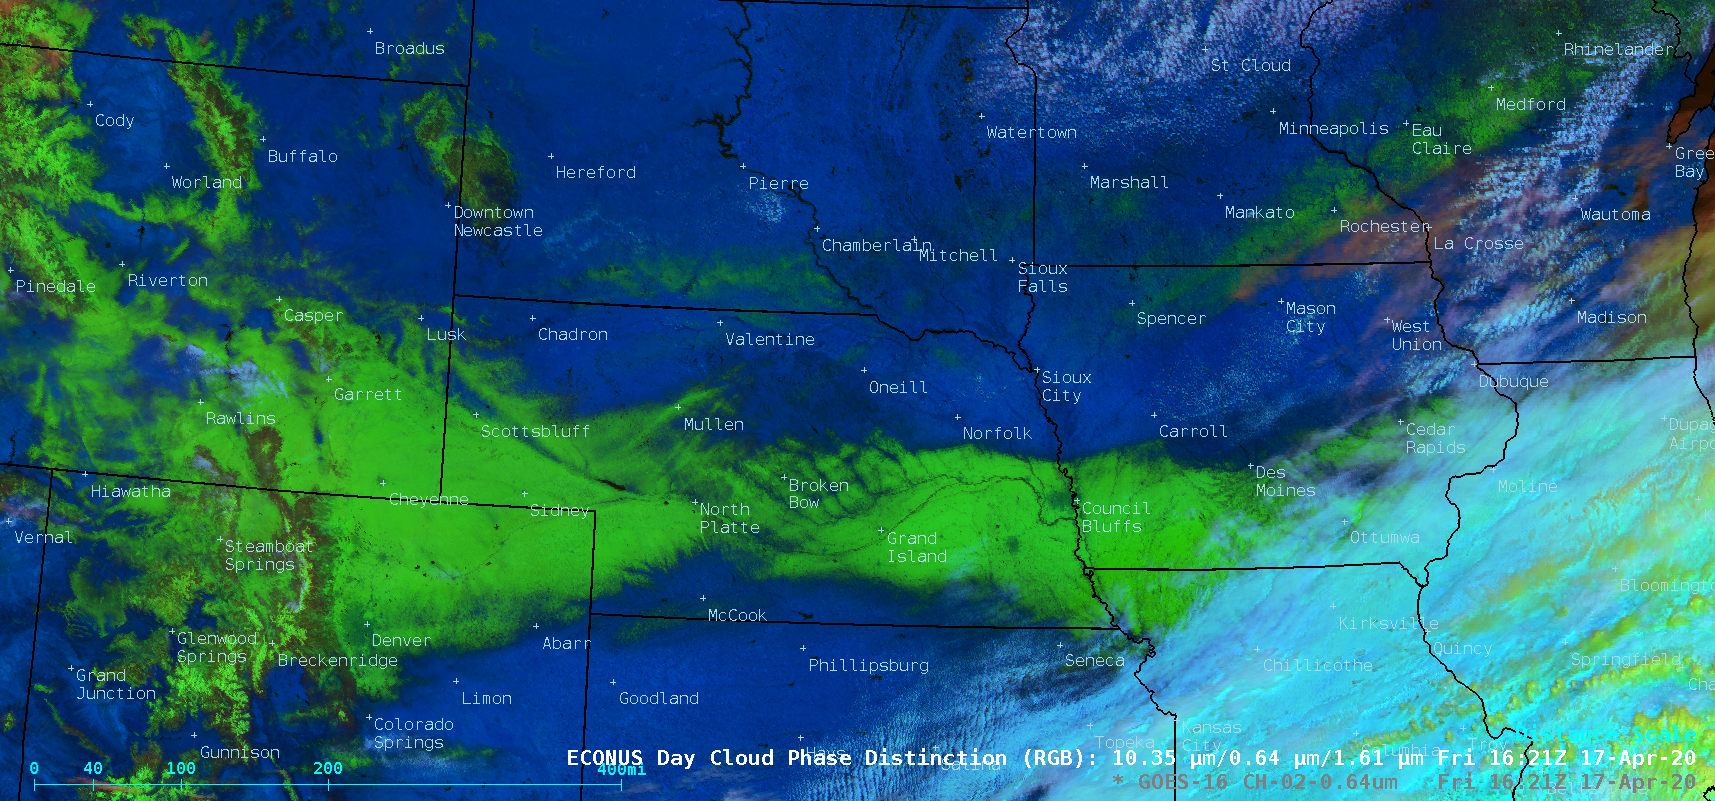

![GOES-16 Day Cloud Phase Distinction RGB images [click to play animation | MP4]](https://cimss.ssec.wisc.edu/satellite-blog/images/2020/04/200417_goes16_dayCloudPhaseDistinctionRGB_NE_KS_IA_MO_snowmelt_anim.gif)
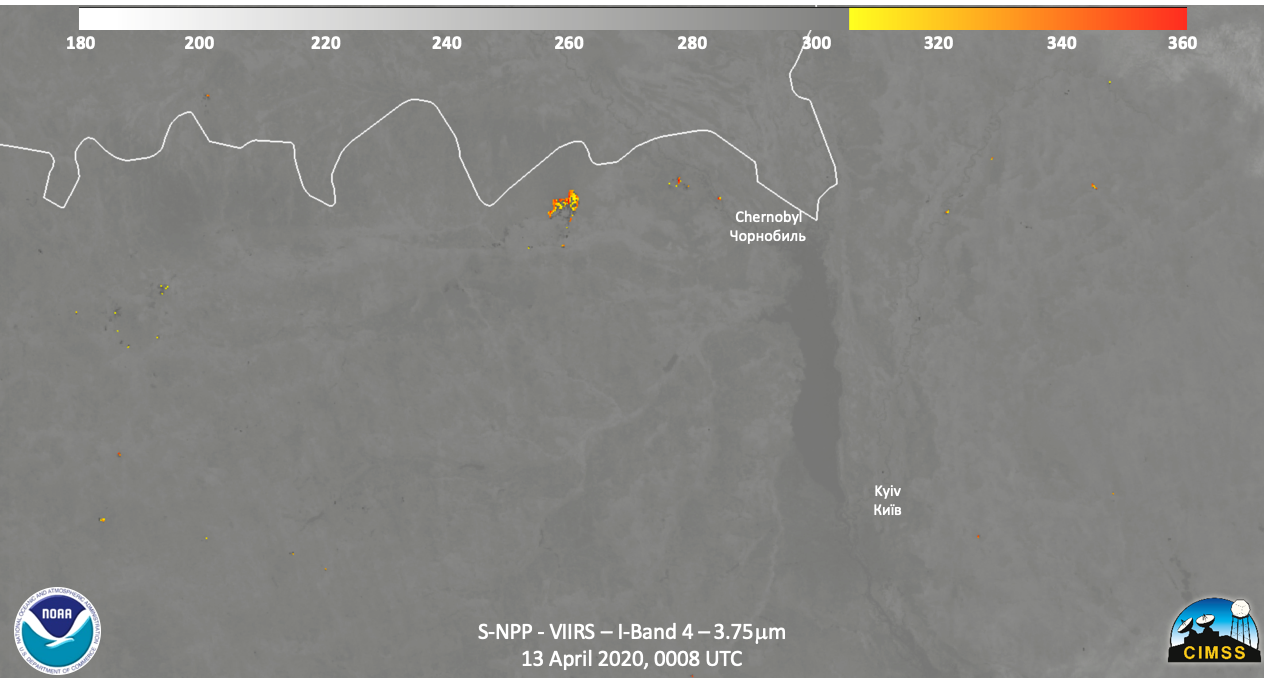
![Suomi NPP VIIRS Day/Night Band (0.7 µm), Near-Infrared (1.61 µm and 2.25 µm) and Shortwave Infrared (3.74 µm) images (credit: William Straka, CIMSS) [click to enlarge]](https://cimss.ssec.wisc.edu/satellite-blog/images/2020/04/200413_0008utc_suomiNPP_viirs_dayNightBand_nearInfrared_shortwaveInfrared_Chernobyl_wildfires_anim.gif)
![GOES-16 "Red" Visible (0.64 µm) images [click to play animation | MP4]](https://cimss.ssec.wisc.edu/satellite-blog/images/2020/04/200412_goes16_visible_awips_Deep_South_anim.gif)

![GOES-16 "Red" Visible (0.64 µm ), "Clean" Infrared Window (10.35 µm), and Visible/Infrared Sandwich RGB images [click to play animation | MP4]](https://cimss.ssec.wisc.edu/satellite-blog/images/2020/04/200412_goes16_visible_infrared_sandwichRGB_MS_anim.gif)
![GOES-16 "Red" Visible (0.64 µm) images, with time-matched SPC Storm Reports plotted in red [click to play animation | MP4]](https://cimss.ssec.wisc.edu/satellite-blog/images/2020/04/200412_goes16_visible_Deep_South_anim.gif)
![GOES-16 "Clean" Infrared Window (10.35 µm) images, with time-matched SPC Storm Reports plotted in cyan [click to play animation | MP4]](https://cimss.ssec.wisc.edu/satellite-blog/images/2020/04/200412_goes16_infrared_Deep_South_anim.gif)
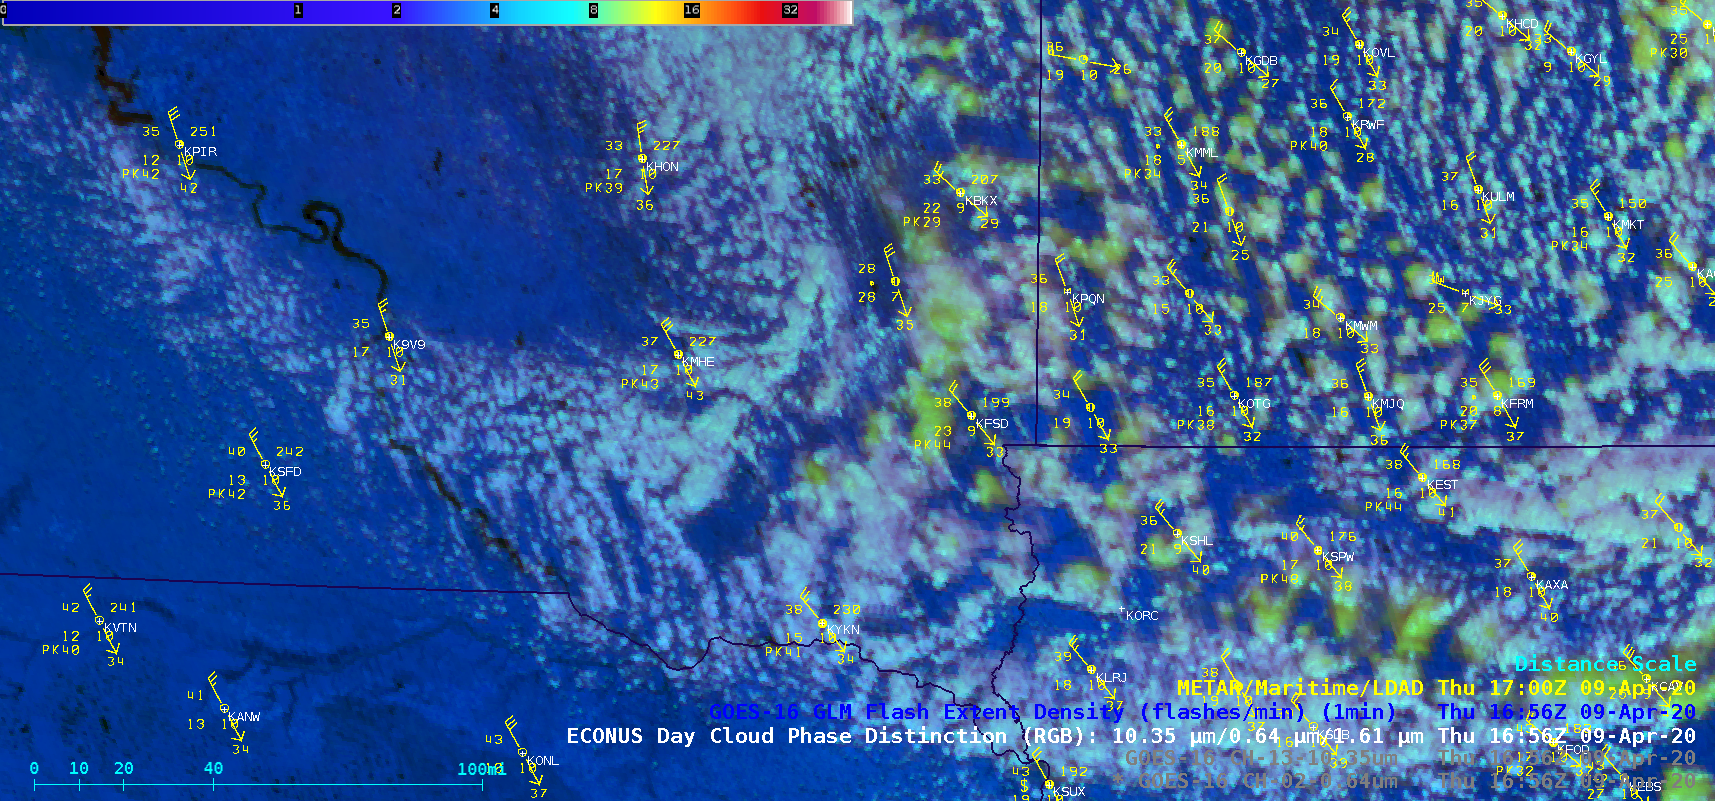
![GOES-16 "Red Visible (0.64 µm), "Clean" Infrared Window (10.35 µm) and Day Cloud Phase Distinction RGB images [click to play animation | MP4]](https://cimss.ssec.wisc.edu/satellite-blog/images/2020/04/200409_goes16_visible_infrared_dayCloudPhaseDistinction_FSD_snow_squalls_anim.gif)
![GOES-16 "Red Visible (0.64 µm), "Clean" Infrared Window (10.35 µm) and Day Cloud Phase Distinction RGB images [click to play animation | MP4]](https://cimss.ssec.wisc.edu/satellite-blog/images/2020/04/200409_goes16_visible_infrared_dayCloudPhaseDistinction_DLH_snow_squalls_anim.gif)
![Plots of 12 UTC rawinsonde data from Aberdeen, South Dakota and International Falls, Minnesota [click to enlarge]](https://cimss.ssec.wisc.edu/satellite-blog/images/2020/04/200409_12UTC_KABR_KINL_RAOBS.GIF)
