
GOES-16 Clean Window (10.3 µm) infrared imagery, 0346 – 1021 UTC, 22 April 2020 (click to animate)
GOES-16 Clean Window (10.3 µm) infrared imagery, above (click to animate) shows two regions of convection over the southern Plains, one moving through central/southern Oklahoma, one developing over the Texas Panhandle and moving east). A similar (but slightly later) animation of GOES-16 Low-Level water vapor infrared imagery (7.34 µm) is below.
GOES-16 Low-Level water vapor (7.3 µm) infrared imagery, 0456 – 1441 UTC, 22 April 2020 (click to animate)
At 0821 UTC, two distinct mesoscale convective complexes are apparent, with a clear region between. This time approximated an overpass by NOAA-20; data from the Cross-track Infrared Sounder (CrIS) and the Advanced Technology Microwave Sounder (ATMS) are combined to create NUCAPS soundings.
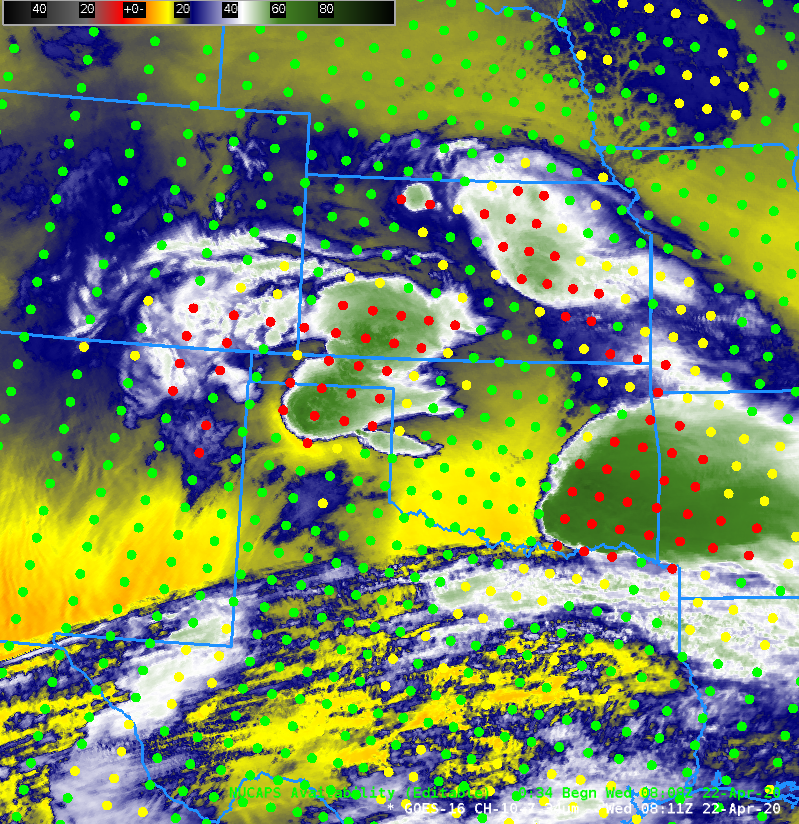
GOES-16 Low-Level water vapor (7.3 µm) infrared imagery, 0826 UTC, 22 April 2020, along with NUCAPS sounding points (click to enlarge)
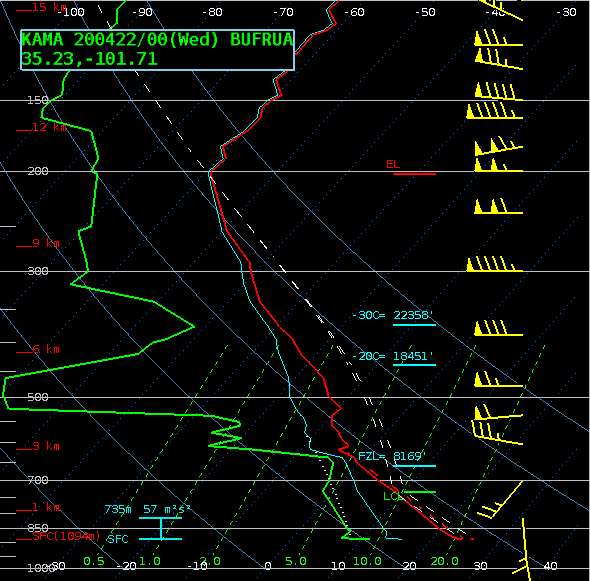
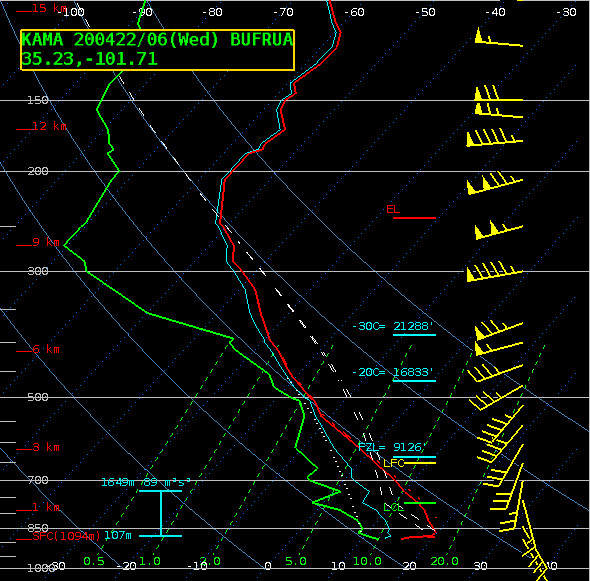
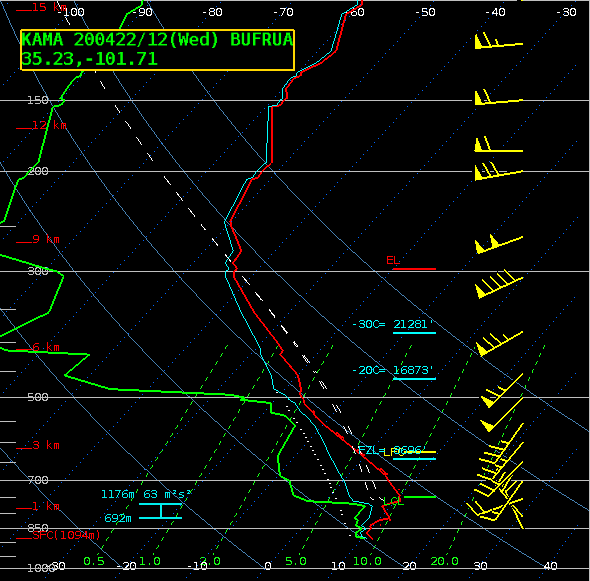
During this time, there were three soundings launched at Amarillo — at 0000, 0600 and 1200 UTC. They are shown below and all three suggest steep mid-level lapse rates.

Radiosonde from Amarillo TX at 0000, 0600 and 1200 UTC on 22 April 2020 (Click to enlarge)
The NUCAPS profile south of Amarillo (in the water vapor image above, the ‘green’ point just south of the ‘red’ point just south of the convective system over Amarillo) is shown below. It also shows fairly steep mid-level lapse rates. Click here to see a toggle between the NUCAPS profile below and the 0600 UTC Amarillo Radiosonde.

NUCAPS Profile at 35 N, 101 W, 0821 UTC on 22 April 2020 (Click to enlarge)
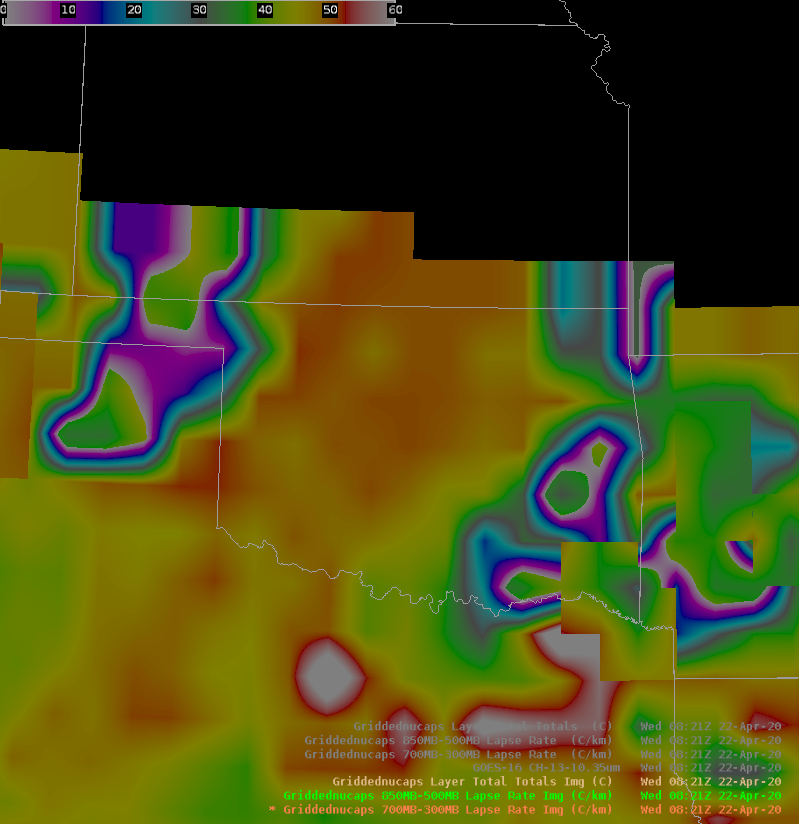
Gridded NUCAPS fields allow a forecaster to view thermodynamic information from the entire pass more easily than can be achieved by examination of individual soundings, or by viewing soundings via the pop-up SkewT. The animation below shows the Total Totals index, the 850-500-mb lapse rate, and the lapse rate from 700-300 mb. Strong instability (Total Totals values around 50) is indicated downstream of the system over the Texas panhandle; also, lapse rates are steeper between 700 and 300 mb (about 7.5º C/km) compared to those between 850 and 500 mb (about 6.8º C/km).
Gridded NUCAPS data gives timely satellite-derived (and model-independent) estimates of the thermodynamic state of the atmosphere.

Gridded NOAA-20 NUCAPS estimates of Total Totals index, 850-500 mb Lapse Rate and 700-300 mb Lapse Rate (Click to enlarge)
View only this post Read Less
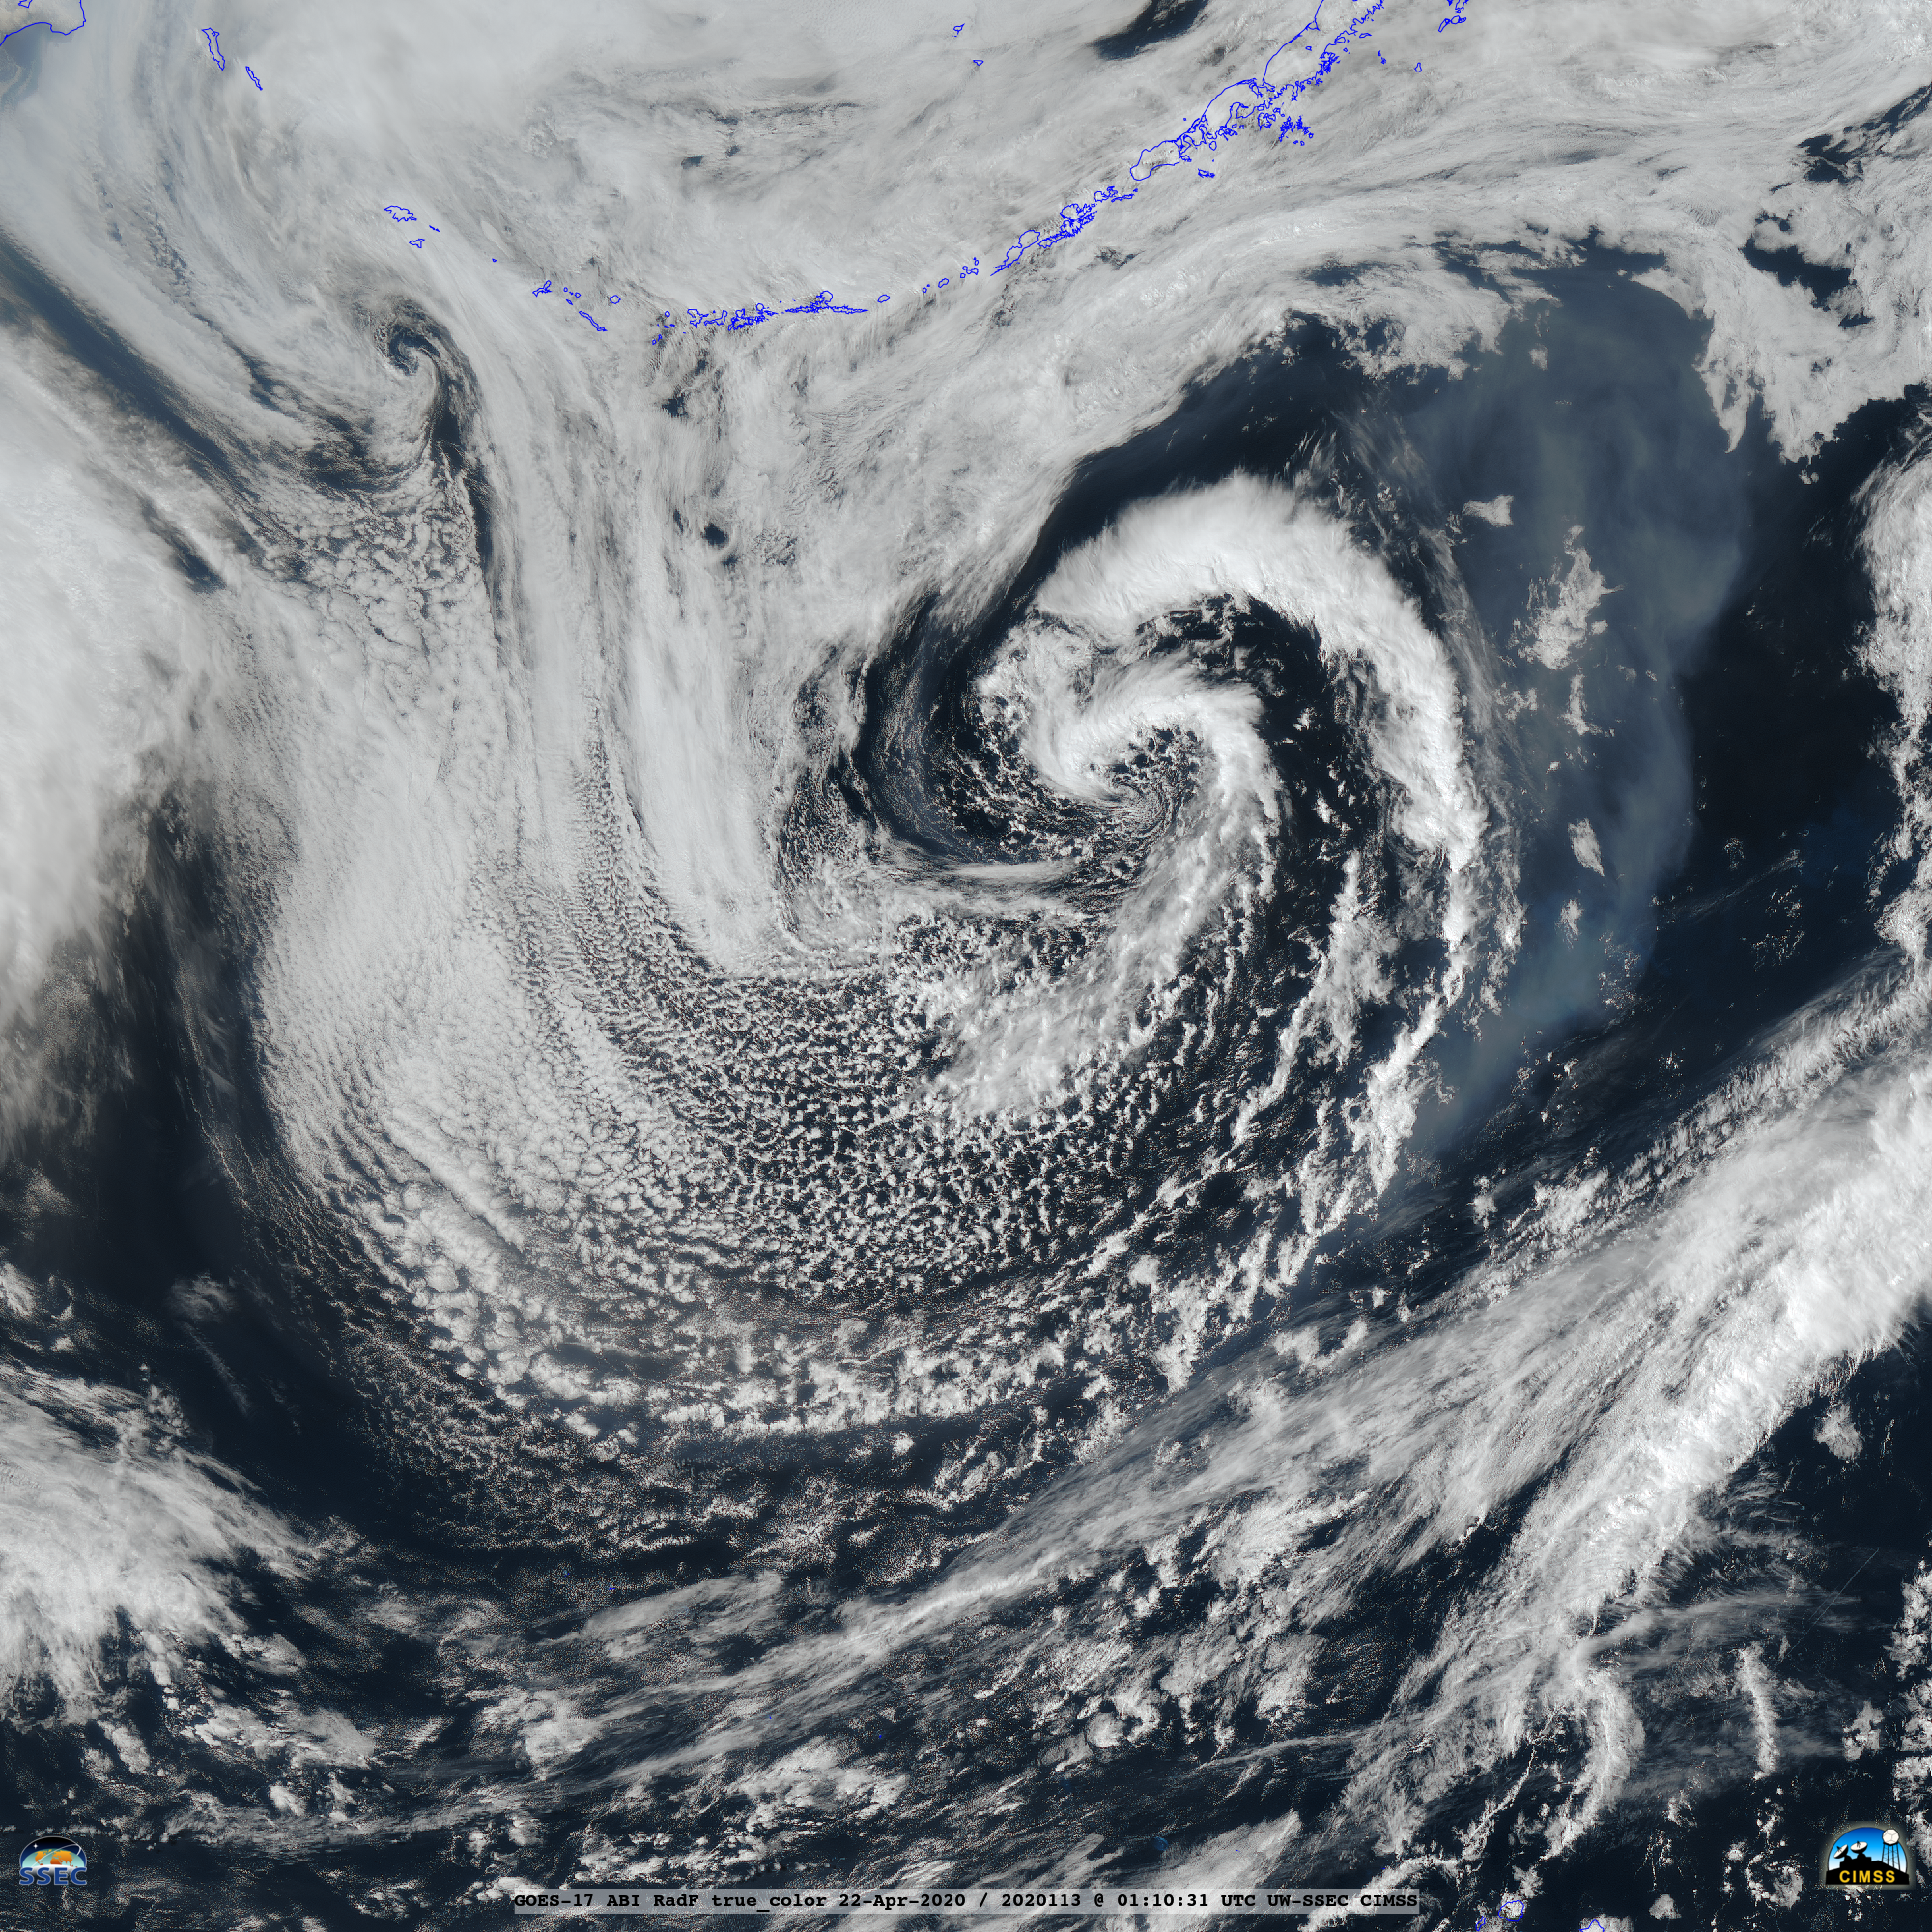
![GOES-17 True Color RGB images [click to play animation | MP4]](https://cimss.ssec.wisc.edu/satellite-blog/images/2020/04/200421_goes17_trueColorRGB_North_Pacific_anim.gif)
![GOES-17 Dust RGB images [click to play animation | MP4]](https://cimss.ssec.wisc.edu/satellite-blog/images/2020/04/200421_goes17_dustRGB_North_Pacific_anim.gif)
![Comparison of GOES-17 True Color RGB and Dust RGB images at 0110 UTC {click to enlarge]](https://cimss.ssec.wisc.edu/satellite-blog/images/2020/04/200422_0110utc_goes17_trueColorRGB_dustRGB_North_Pacific_anim.gif)
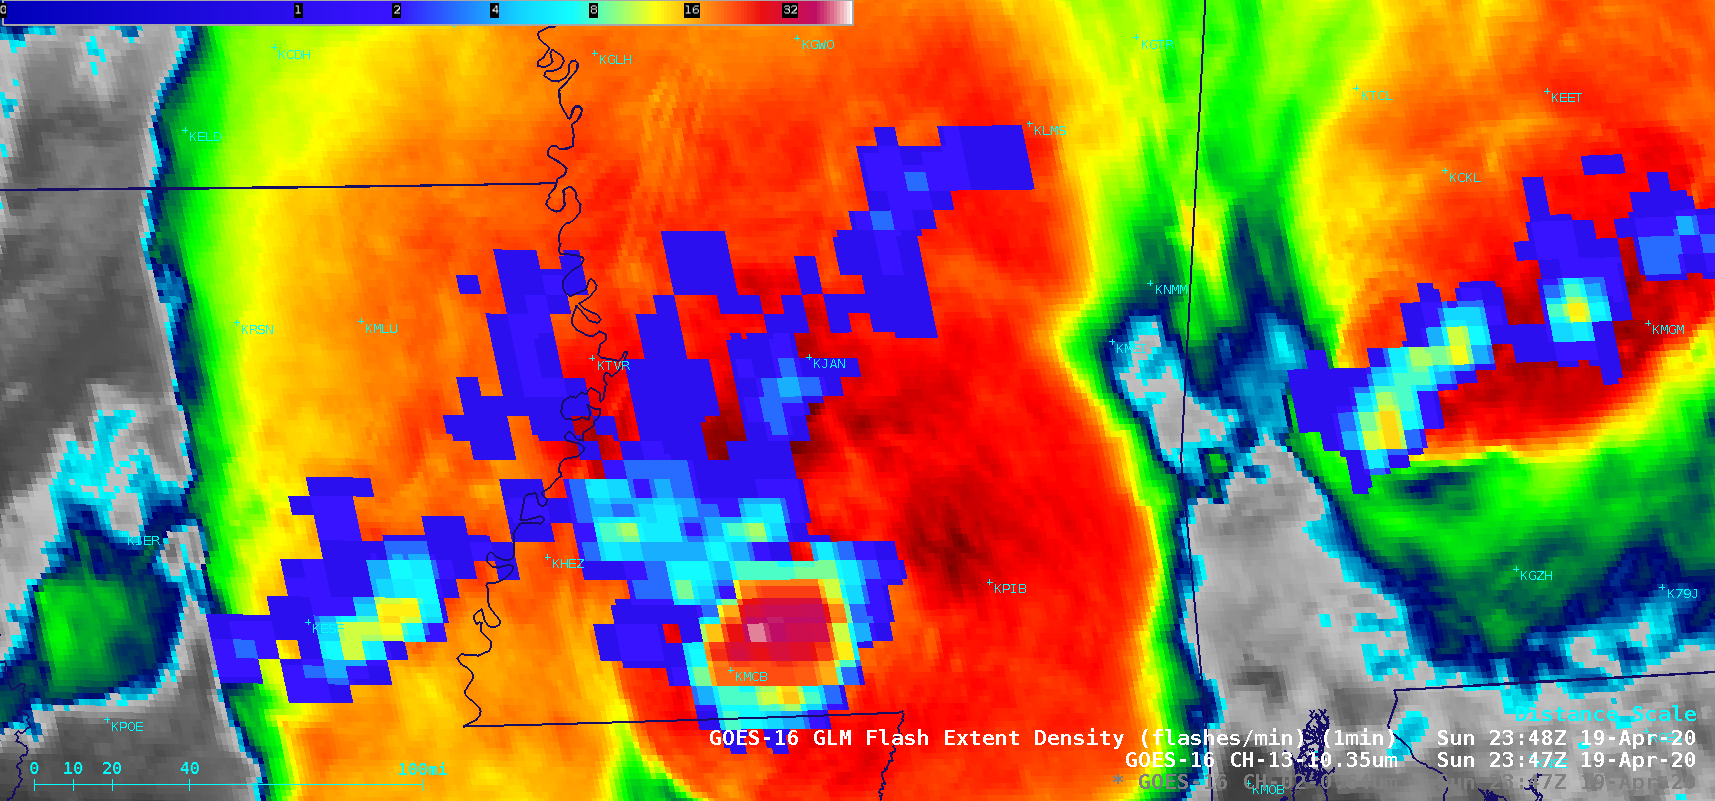
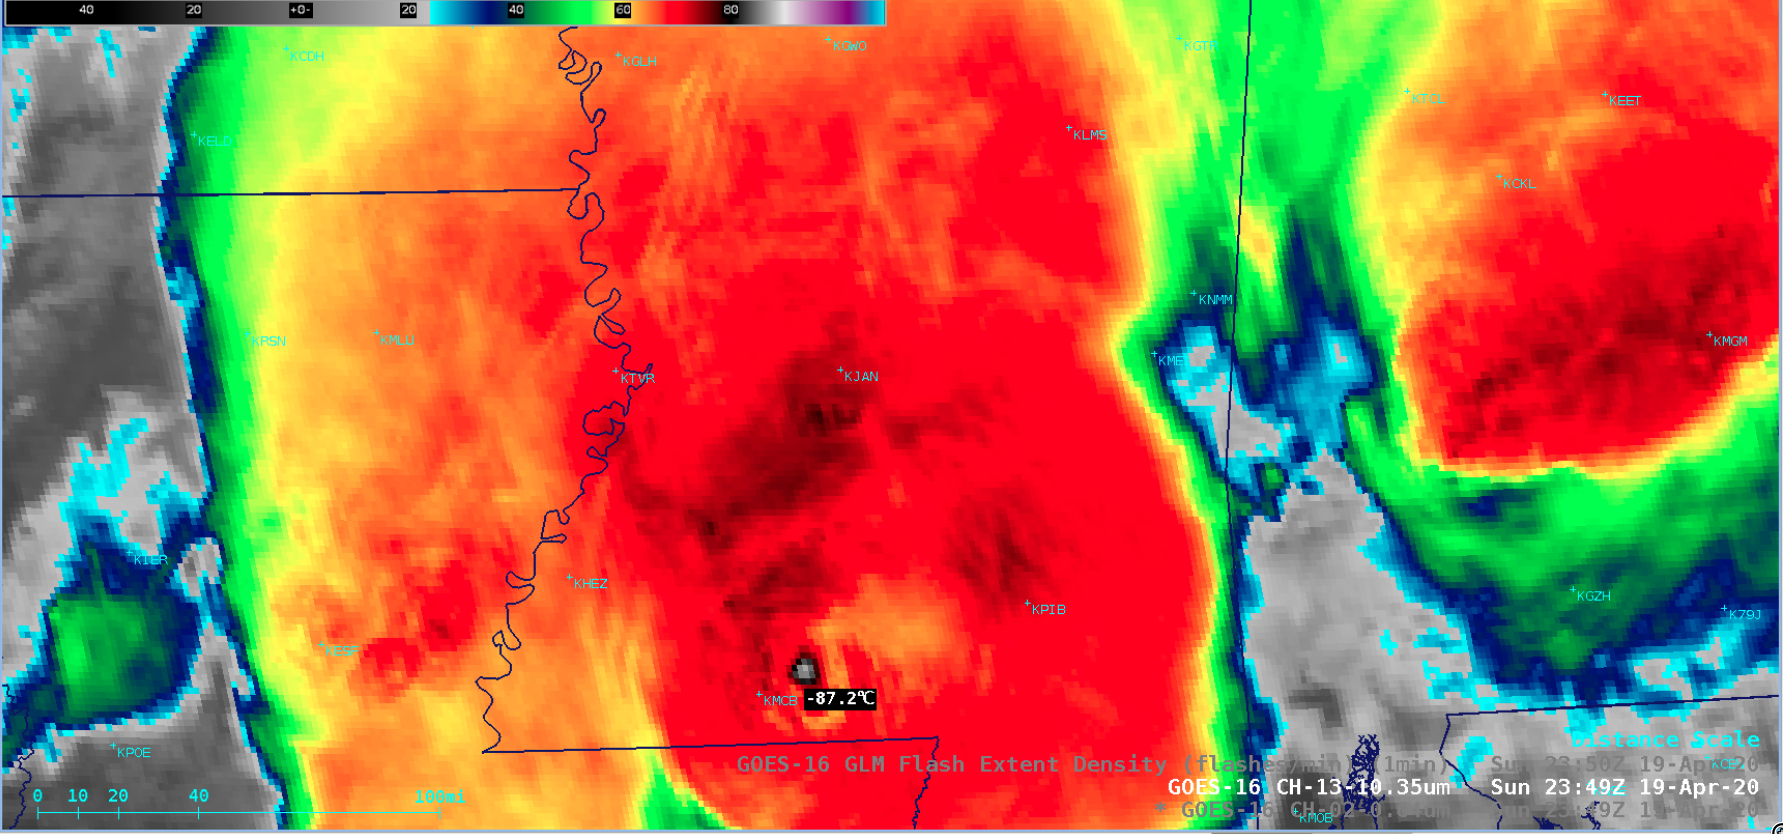
![GOES-16 "Red" Visible (0.64 µm), "Clean" Infrared Window (10.35 µm) and GLM Flash Extent Density [click to play animation | MP4]](https://cimss.ssec.wisc.edu/satellite-blog/images/2020/04/200419_goes16_visible_infrared_glmFlashExtentDensity_MS_OT_anim.gif)
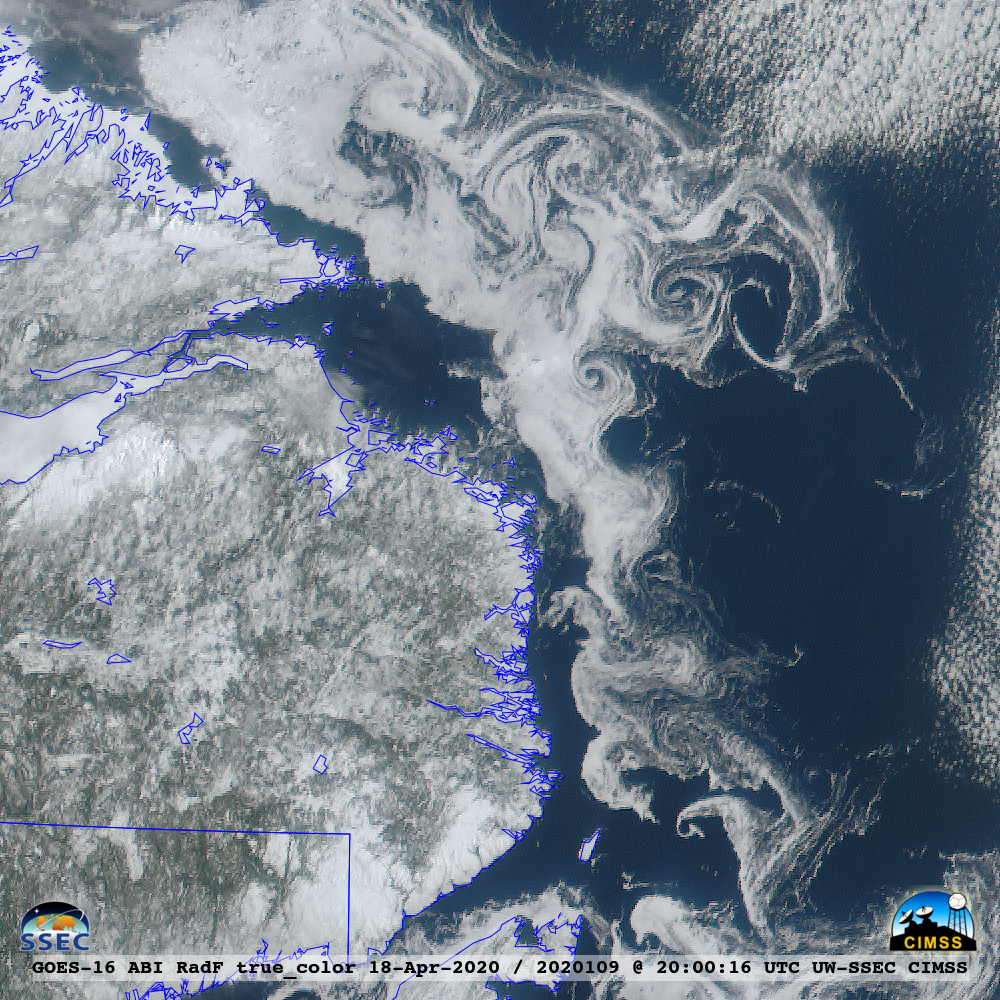
![GOES-16 True Color RGB images [click to play animation | MP4]](https://cimss.ssec.wisc.edu/satellite-blog/images/2020/04/200418_goes16_trueColorRGB_Labrador_Sea_ice_anim.gif)
