Ulawun volcano erupts in Papau New Guinea
![Himawari-8 Visible (0.64 µm, left), Shortwave Infrared (3.9 µm, center) and Infrared Window (10.4 µm, right) images [click to play animation | MP4]](https://cimss.ssec.wisc.edu/satellite-blog/wp-content/uploads/sites/5/2019/06/190616_himawari8_visible_shortwaveInfrared_infraredWindow_Ulawun_volcano_anim.gif)
Himawari-8 Visible (0.64 µm, left), Shortwave Infrared (3.9 µm, center) and Infrared Window (10.4 µm, right) images [click to play animation | MP4]
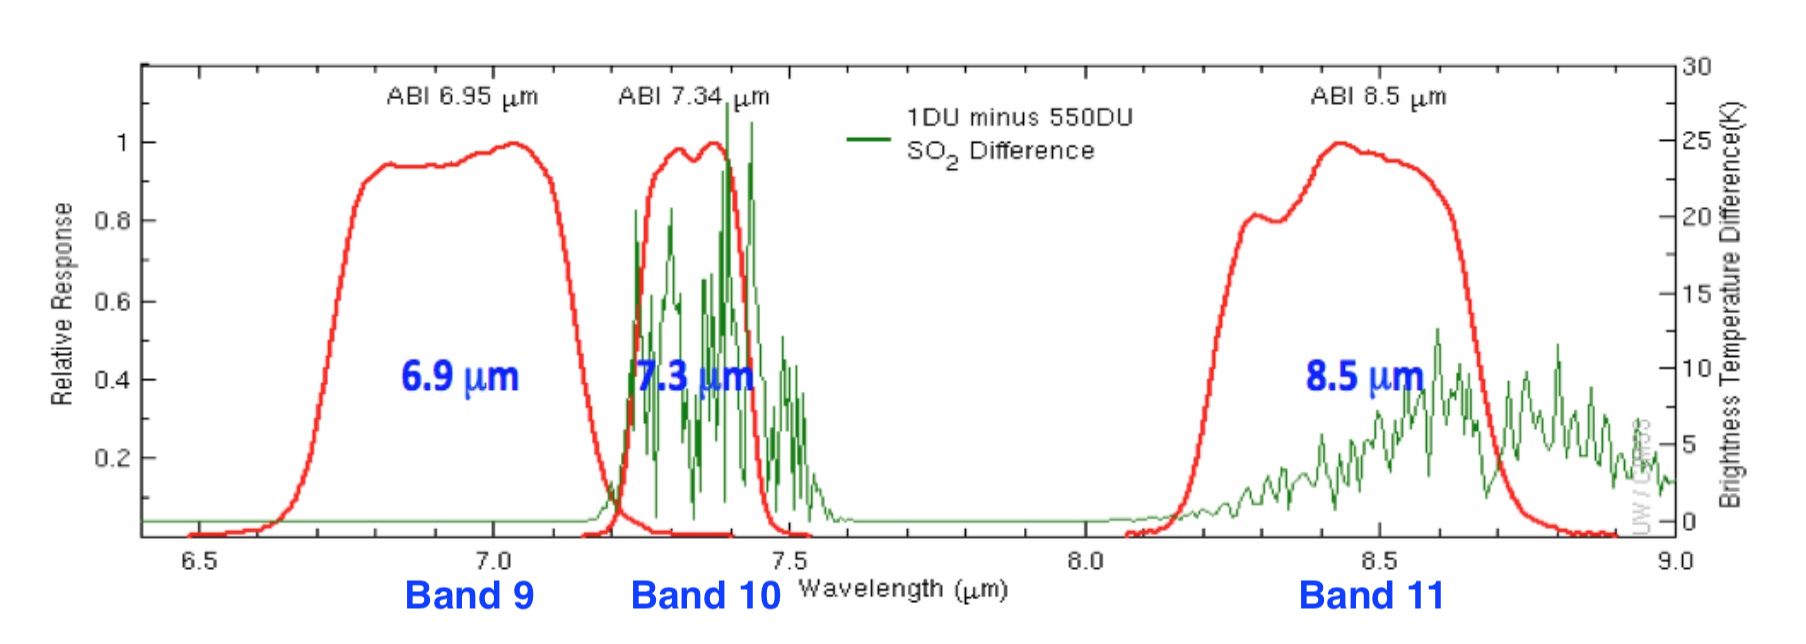
Himawari-8 Infrared Window images (below) showed that the volcanic cloud dissipated fairly quickly. The eastward drift of the stratospheric cloud material also became difficult to follow after a couple of hours — even in Low-level Water Vapor (7.3 µm) imagery (which is also sensitive to SO2 absorption).
![Himawari-8 Infrared Window (10.4 µm) images [click to play animation | MP4]](https://cimss.ssec.wisc.edu/satellite-blog/wp-content/uploads/sites/5/2019/06/190626_himawari8_infraredWindow_Ulawun_volcano_anim.gif)
Himawari-8 Infrared Window (10.4 µm) images [click to play animation | MP4]
![Himawari-8 Shortwave Infrared (3.9 um) images [click to play animation | MP4]](https://cimss.ssec.wisc.edu/satellite-blog/wp-content/uploads/sites/5/2019/06/190626_himawari8_shortwaveInfrared_Ulawun_anim.gif)
Himawari-8 Shortwave Infrared (3.9 µm) images [click to play animation | MP4]
![Plot of volcano radiative power (red) and volcanic cloud longwave infrared brightness temperature (green), courtesy of Mike Pavolonis (NOAA/NESDIS) [click to enlarge]](https://cimss.ssec.wisc.edu/satellite-blog/wp-content/uploads/sites/5/2019/06/190626_VOLCAT_thermal_time_series_new_Ulawun.png)
Time series plot of volcano radiative power (red) and volcanic cloud longwave infrared brightness temperature (green), courtesy of Mike Pavolonis (NOAA/NESDIS) [click to enlarge]
![False Color RGB (top left), Ash Height (top right), Ash Effective Radius (bottom left) and Ash Loading (bottom right) [click to play animation | MP4]](https://cimss.ssec.wisc.edu/satellite-blog/wp-content/uploads/sites/5/2019/06/190626_volcat_ash_retrievals_Ulawun.gif)
False Color RGB (top left), Ash Height (top right), Ash Effective Radius (bottom left) and Ash Loading (bottom right), courtesy of Mike Pavolonis (NOAA/NESDIS) [click to play animation | MP4]
![GOES-17 "Red" Visible <em>(0.64 µm)</em> images [click to play animation | MP4]](https://cimss.ssec.wisc.edu/satellite-blog/wp-content/uploads/sites/5/2019/06/190626_goes17_visible_Ulawun_volcano_anim.gif)
GOES-17 “Red” Visible (0.64 µm) images [click to play animation | MP4]