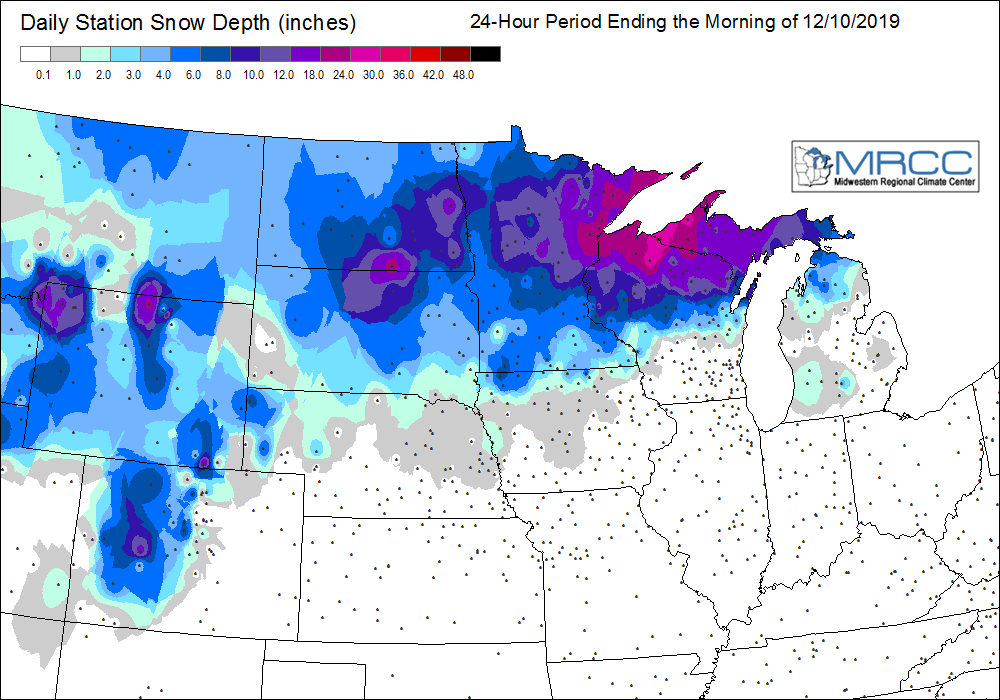
Cold air over the Upper Midwest
GOES-16 “Clean” Infrared Window (10.35 µm) images, with select minimum temperatures as of 12 UTC [click to play animation | MP4]
With the cold and dry arctic air mass in place across the Upper Midwest, GOES-16 Low-level (7.3 µm) and Mid-level (6.9 µm) Water Vapor imagery (below) was able to sense the thermal contrast between cold, snow-covered land surfaces and the still-unfrozen reservoirs along the Missouri River in North Dakota and South Dakota.
![GOES-16 Low-level (7.3 µm) and Mid-level (6.9 µm) images, with rawinsonde sites indicated in yellow [click to play animation | MP4]](https://cimss.ssec.wisc.edu/satellite-blog/wp-content/uploads/sites/5/2019/12/191210_goes16_waterVapor_ND_SD_anim.gif)
GOES-16 Low-level (7.3 µm) and Mid-level (6.9 µm) images, with rawinsonde sites indicated in yellow [click to play animation | MP4]
![GOES-16 Water Vapor weighting functions calculated using 12 UTC rawinsonde data from Aberdeen, SD [click to enlarge]](https://cimss.ssec.wisc.edu/satellite-blog/wp-content/uploads/sites/5/2019/12/191210_12utc_kabr_waterVapor_weightingFunctions.png)
GOES-16 Water Vapor weighting functions calculated using 12 UTC rawinsonde data from Aberdeen, SD [click to enlarge]
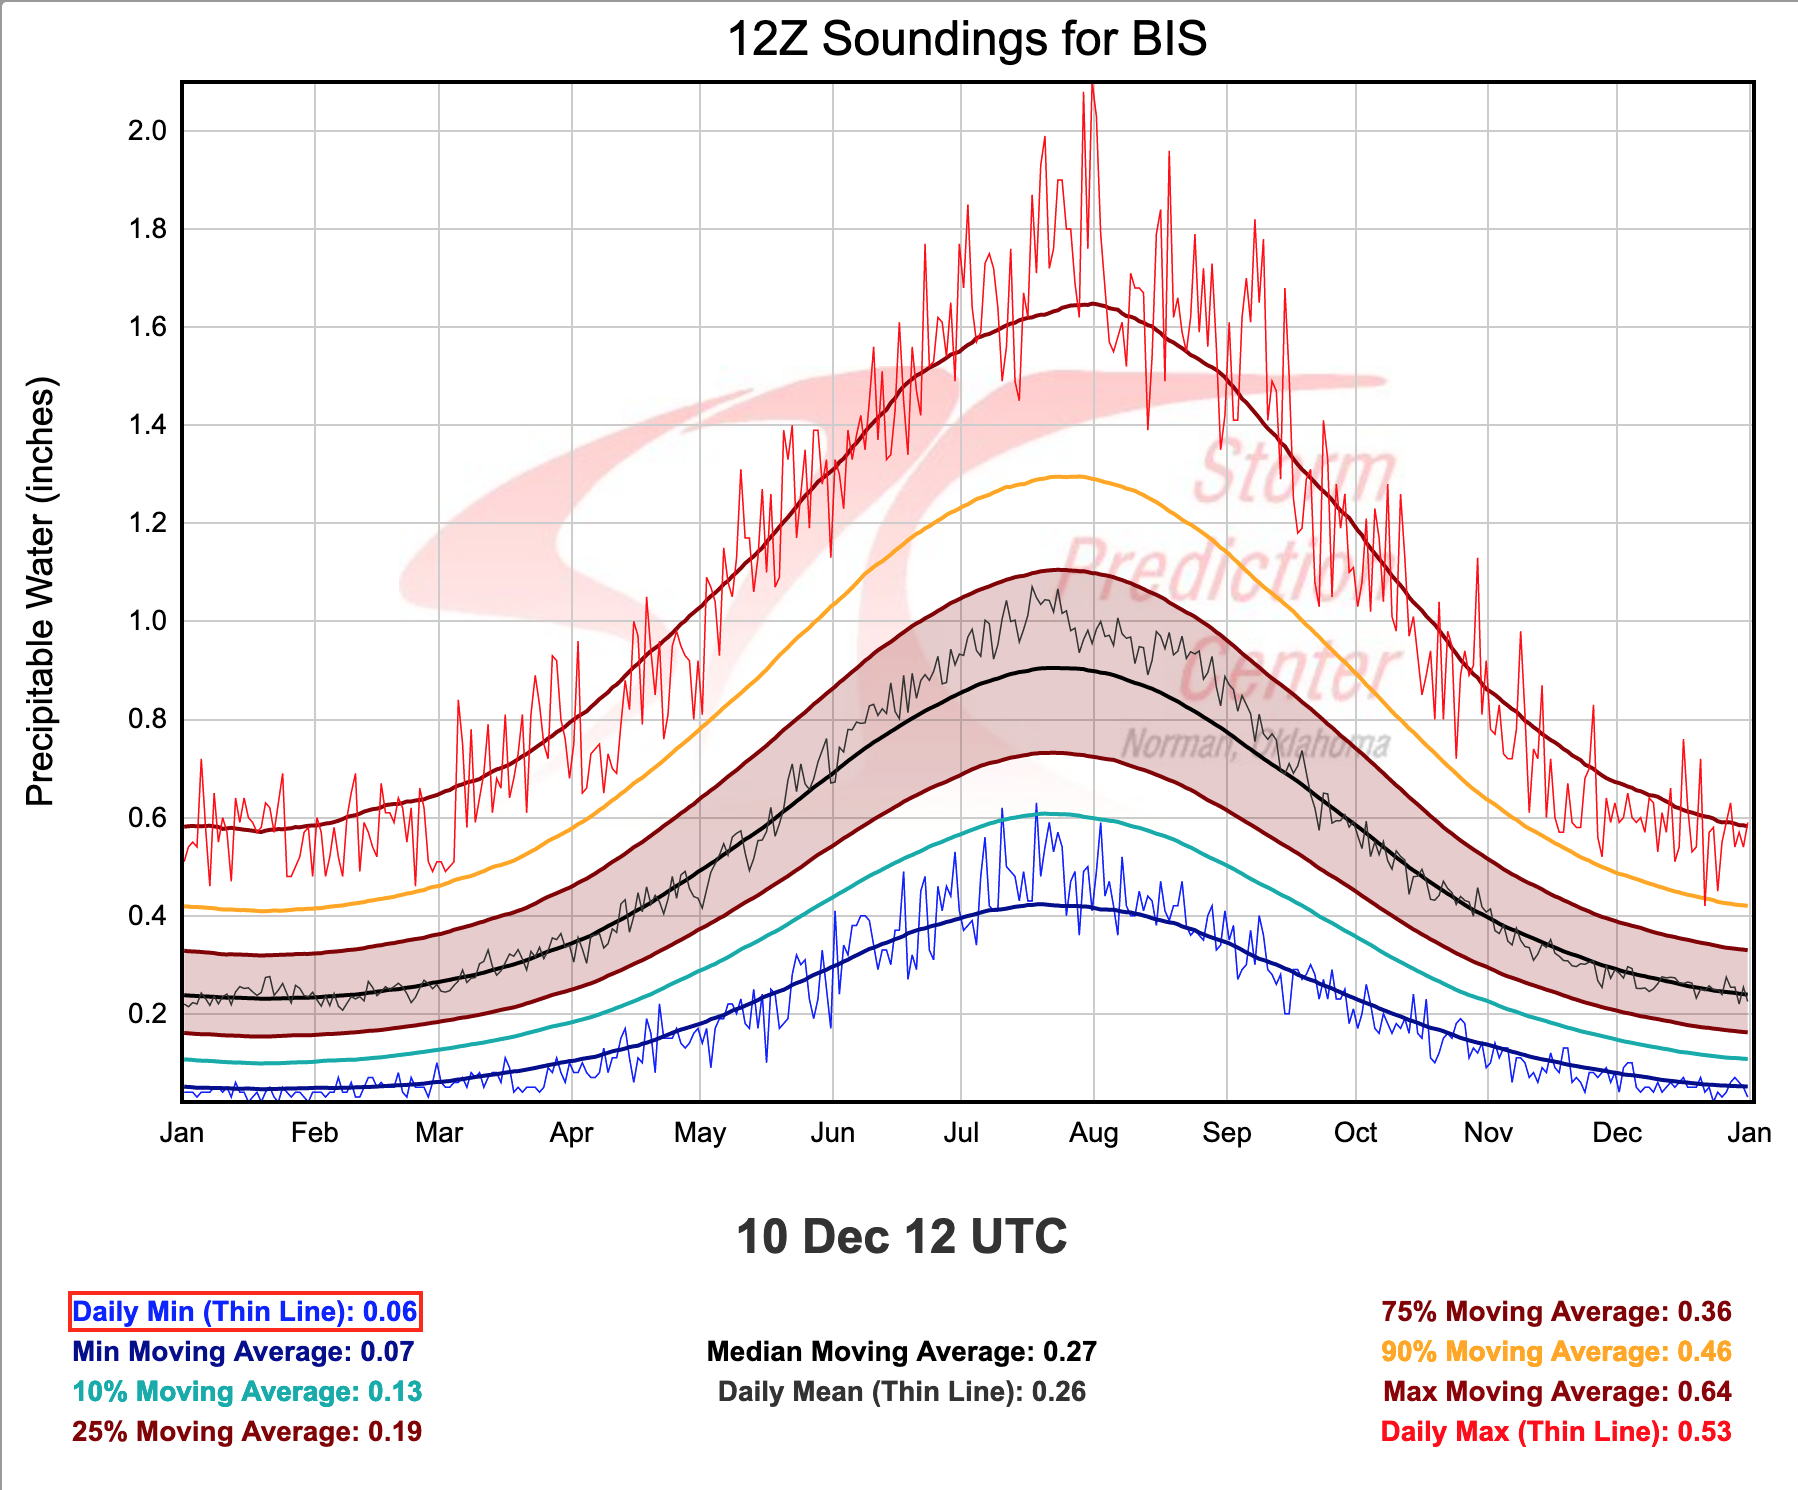
![Climatology of Precipitable Water for Aberdeen, SD [click to enlarge]](https://cimss.ssec.wisc.edu/satellite-blog/wp-content/uploads/sites/5/2019/12/191210_12utc_kabr_precipitableWater_climatology.png)
Climatology of Precipitable Water for Aberdeen, SD [click to enlarge]
![NOAA-20 VIIRS Visible (0.64 µm) image, with plots of available NUCAPS sounding locations [click to enlarge]](https://cimss.ssec.wisc.edu/satellite-blog/wp-content/uploads/sites/5/2019/12/nd_sd_viirs_vis_nucaps-20191210_195005.png)
NOAA-20 VIIRS Visible (0.64 µm) image, with plots of available NUCAPS sounding locations [click to enlarge]
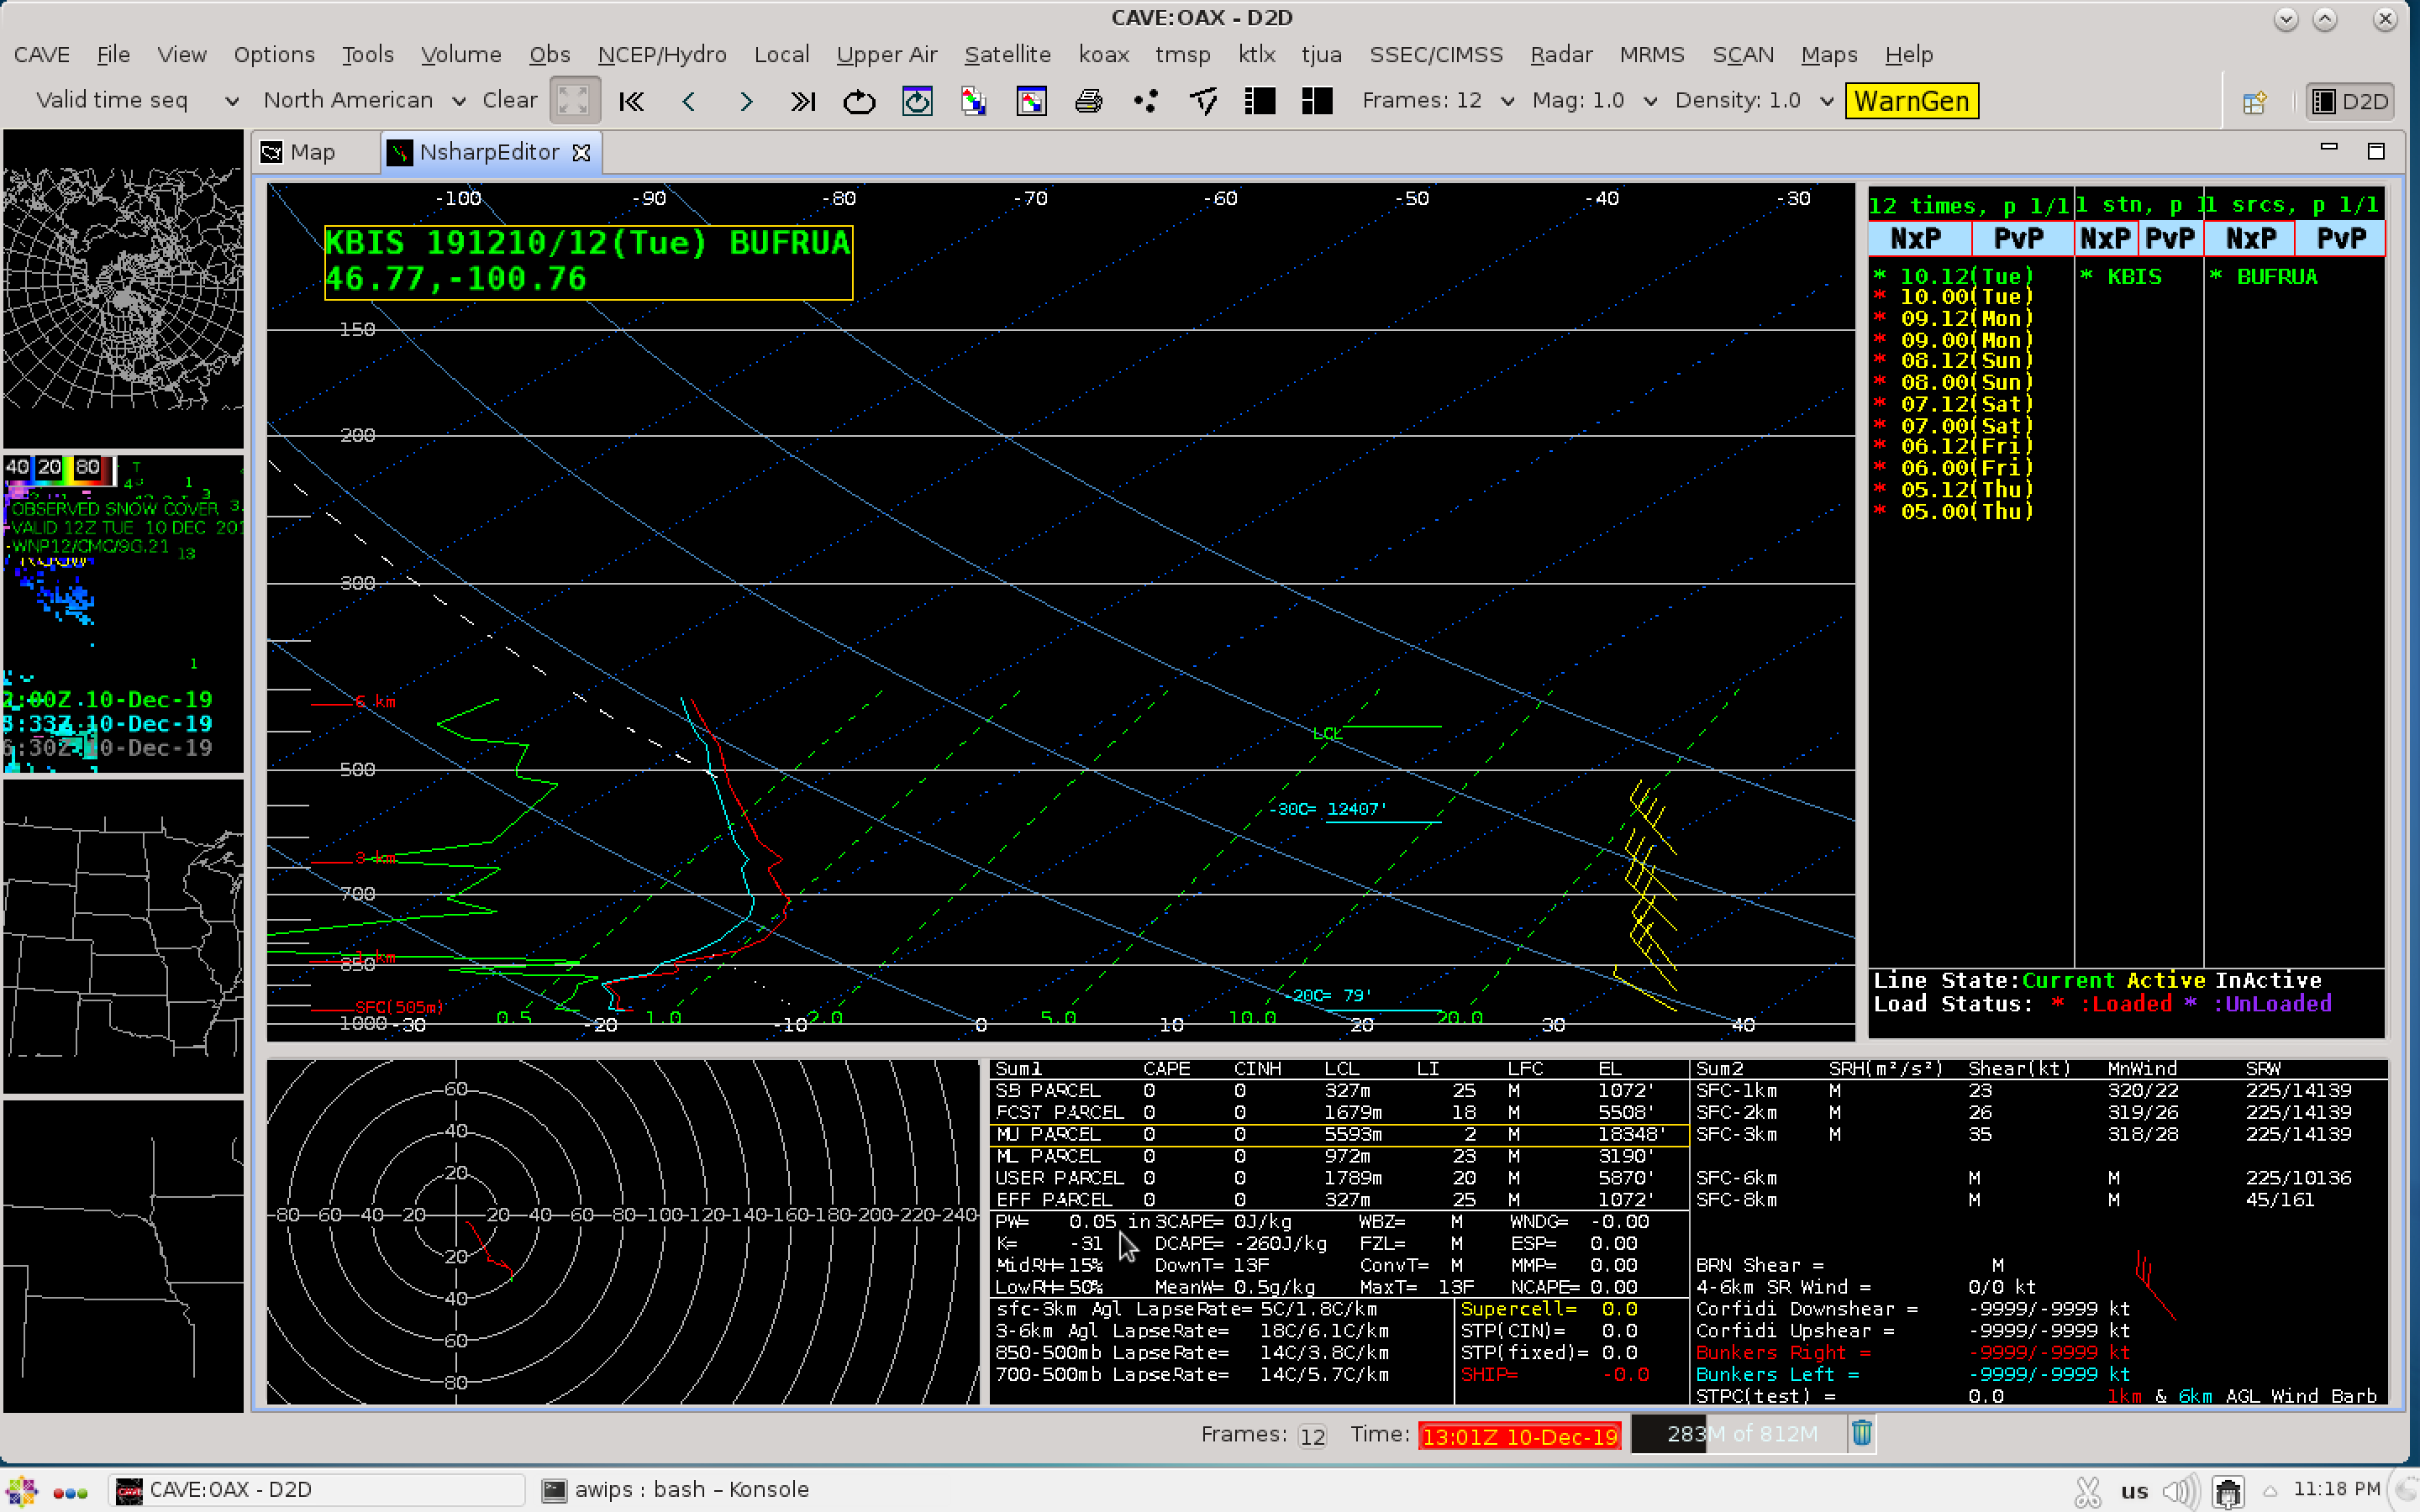
![NOAA-20 NUCAPS sounding profile northeast of Bismarck (Point 1) [click to enlarge]](https://cimss.ssec.wisc.edu/satellite-blog/wp-content/uploads/sites/5/2019/12/191210_19utc_nucaps_KBIS.png)
NOAA-20 NUCAPS sounding profile northeast of Bismarck KBIS (Point 1) [click to enlarge]
![NOAA-20 NUCAPS sounding profile southeast of Aberdeen KABR (Point 2) [click to enlarge]](https://cimss.ssec.wisc.edu/satellite-blog/wp-content/uploads/sites/5/2019/12/191210_19utc_nucaps_KABR.png)
NOAA-20 NUCAPS sounding profile southeast of Aberdeen KABR (Point 2) [click to enlarge]
GOES-16 “Red” Visible (0.64 µm) and Near-Infrared “Snow/Ice” (1.61 µm) images [click to play animation | MP4]
![GOES-16 "Red" Visible (0.64 µm) and Near-Infrared "Snow/Ice" (1.61 µm) images [click to play animation | MP4]](https://cimss.ssec.wisc.edu/satellite-blog/wp-content/uploads/sites/5/2019/12/191210_goes16_visible_snowIce_SD_anim.gif)
GOES-16 “Red” Visible (0.64 µm) and Near-Infrared “Snow/Ice” (1.61 µm) images [click to play animation | MP4]