1-minute Mesoscale Domain Sector GOES-16 (GOES-East) “Red” Visible (0.64 µm) and “Clean” Infrared Window (10.35 µm) images (above) showed thunderstorms that produced a variety of severe weather (SPC Storm Reports) across far southern Oklahoma on 22 April 2020. These discrete supercell storms developed along a cold front associated with a low pressure system moving across the region (surface analyses).GOES-16... Read More
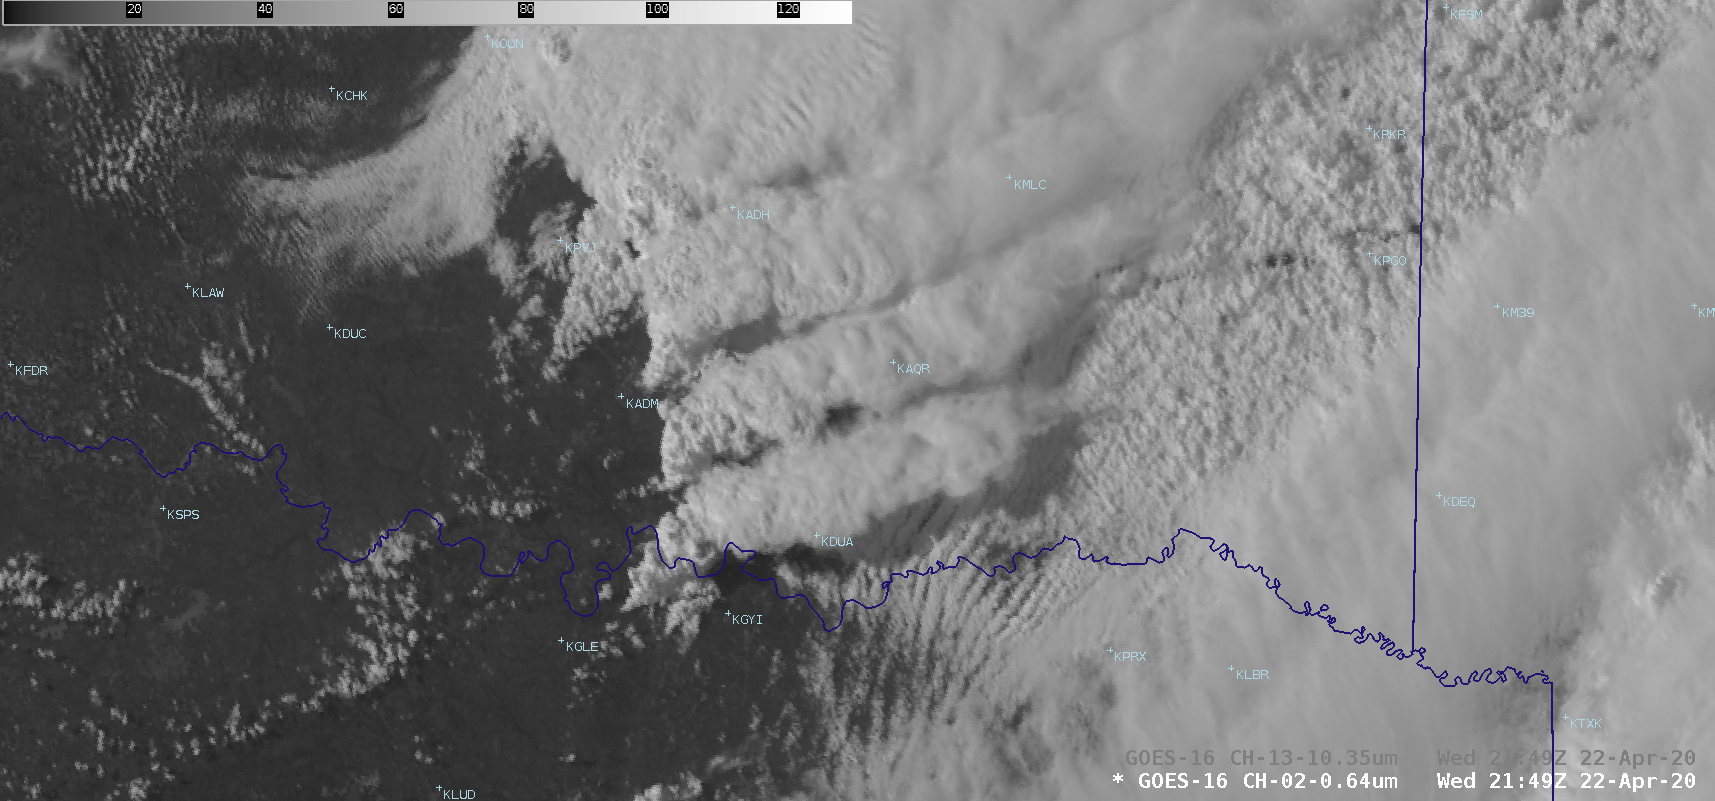
GOES-16 “Red” Visible (0.64 µm) and “Clean” Infrared Window (10.35 µm) images [click to play animation | MP4]
1-minute
Mesoscale Domain Sector GOES-16
(GOES-East) “Red” Visible (
0.64 µm) and “Clean” Infrared Window (
10.35 µm) images
(above) showed thunderstorms that produced a variety of severe weather (
SPC Storm Reports) across far southern Oklahoma on
22 April 2020. These discrete supercell storms developed along a cold front associated with a low pressure system moving across the region (
surface analyses).
GOES-16 Visible and Infrared images with plots of time-matched SPC Storm Reports are shown below.
![GOES-16 "Red" Visible (0.64 µm, top) and "Clean" Infrared Window (10.35 µm, bottom) images, with plots of SPC Storm Reports [click to play animation | MP4]](https://cimss.ssec.wisc.edu/satellite-blog/images/2020/04/G16_VIS_IR_OK_SPC_22APR2020_B213_2020113_214951_0002PANELS_FRAME00140.GIF)
GOES-16 “Red” Visible (0.64 µm, top) and “Clean” Infrared Window (10.35 µm, bottom) images, with plots of SPC Storm Reports [click to play animation | MP4]
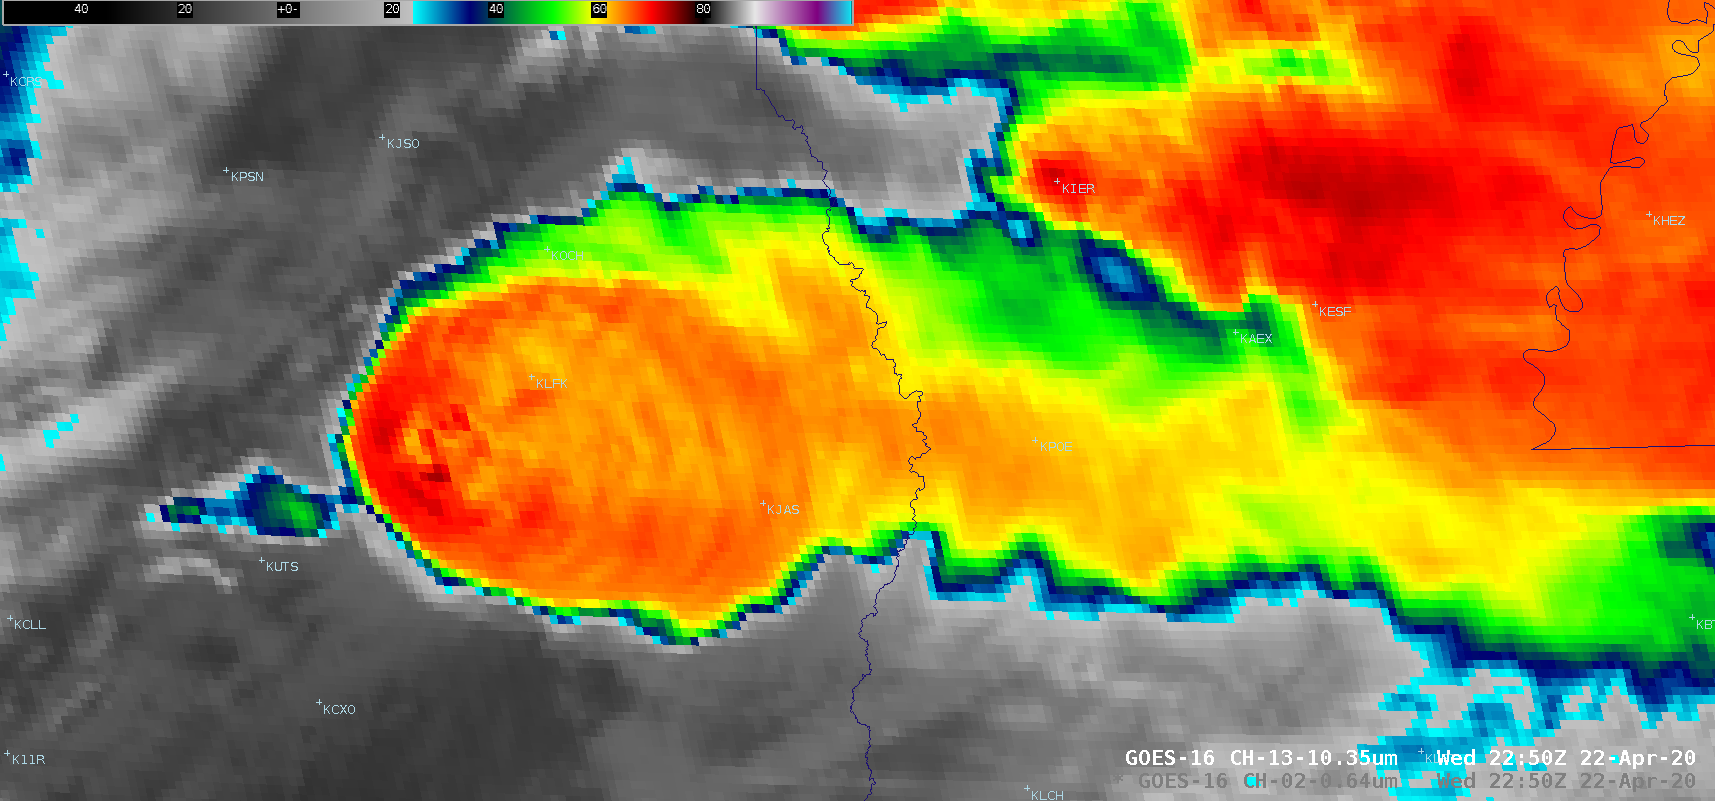
Farther to the southeast across eastern Texas, GOES-16 Visible and Infrared images
(below) revealed a large and long-lived supercell thunderstorm that eventually moved eastward into Louisiana.
![GOES-16 "Red" Visible (0.64 µm) and "Clean" Infrared Window (10.35 µm) images [click to play animation | MP4]](https://cimss.ssec.wisc.edu/satellite-blog/images/2020/04/tx_vis-20200422_225051.png)
GOES-16 “Red” Visible (0.64 µm) and “Clean” Infrared Window (10.35 µm) images [click to play animation | MP4]
GOES-16 Visible and Infrared images with plots of time-matched SPC Storm Reports are shown below. An
Above-Anvil Cirrus Plume was produced by this thunderstorm, and cloud-top infrared brightness temperatures were as cold as -80ºC
(violet pixels). Early in its life cycle, after dropping hail of 1.0-2.0 inches in diameter, the supercell produced the fatal
EF-3 Onalaska tornado.
![GOES-16 "Red" Visible (0.64 µm, top) and "Clean" Infrared Window (10.35 µm, bottom) images, with plots of SPC Storm Reports [click to play animation | MP4]](https://cimss.ssec.wisc.edu/satellite-blog/images/2020/04/G16_VIS_IR_TX_LA_SPC_22APR2020_B213_2020113_225051_0002PANELS_FRAME00051.GIF)
GOES-16 “Red” Visible (0.64 µm, top) and “Clean” Infrared Window (10.35 µm, bottom) images, with plots of SPC Storm Reports [click to play animation | MP4]
A toggle between 1-km resolution NOAA-19
AVHRR Visible (0.63 µm) and Infrared Window (10.8 µm) images at 2338 UTC
(below) provided a more detailed view of the Above-Anvil Cirrus Plume. The coldest cloud-top infrared brightness temperature in the region of the overshooting top was -84.7ºC.
![NOAA-19 AVHRR Visible (0.63 µm) and Infrared Window (10.8 µm) images [click to enlarge]](https://cimss.ssec.wisc.edu/satellite-blog/images/2020/04/200422_2338utc_noaa19_visible_infrared_TX_LA_anim.gif)
NOAA-19 AVHRR Visible (0.63 µm) and Infrared Window (10.8 µm) images [click to enlarge]
Additional imagery of these storms is available on the
Satellite Liaison Blog.
View only this post
Read Less
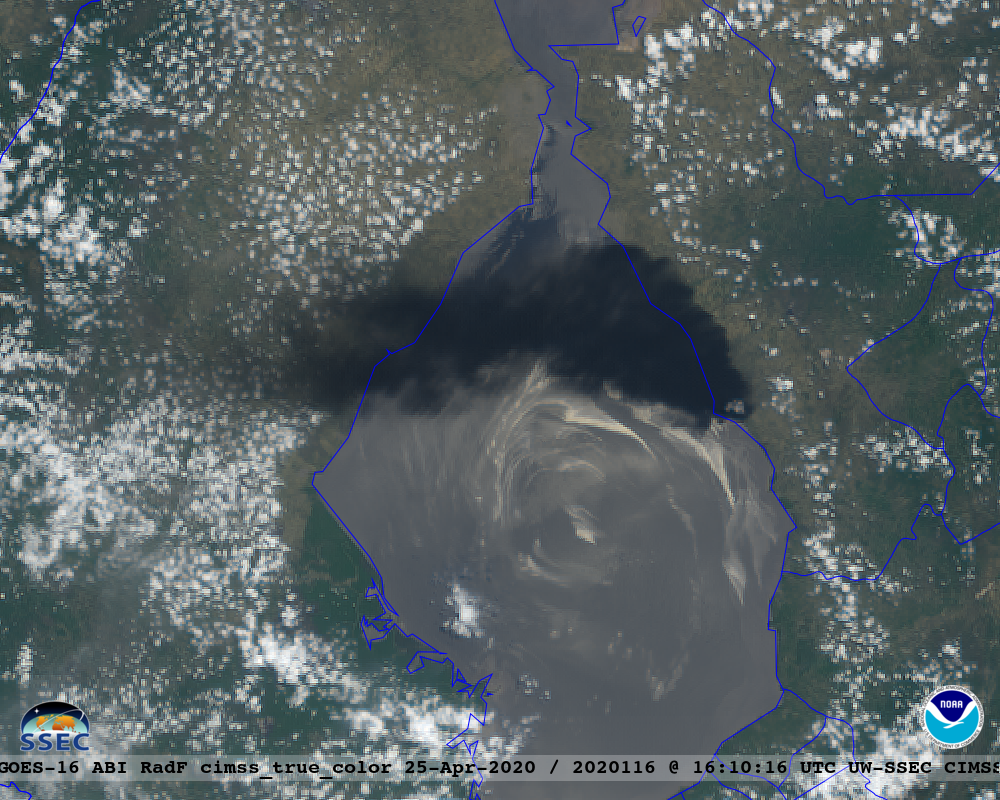
![GOES-16 True Color RGB images (credit: Tim Schmit, ASPB/CIMSS) [click to play animation | MP4]](https://cimss.ssec.wisc.edu/satellite-blog/images/2020/04/True_color_loop_Maracaibo.gif)
![VIIRS True Color RGB images from Suomi NPP and NOAA-20 [click to enlarge]](https://cimss.ssec.wisc.edu/satellite-blog/images/2020/04/200425_suomiNPP_noaa20_viirs_trueColorRGB_Venezuela_refinery_fire_anim.gif)
![GOES-16 Shortwave Infrared (3.9 µm) images (credit: Tim Schmit, ASPB/CIMSS) [click to play animation | MP4]](https://cimss.ssec.wisc.edu/satellite-blog/images/2020/04/MARACAIBO_loop_2020116_100016_2020116_205015.gif)
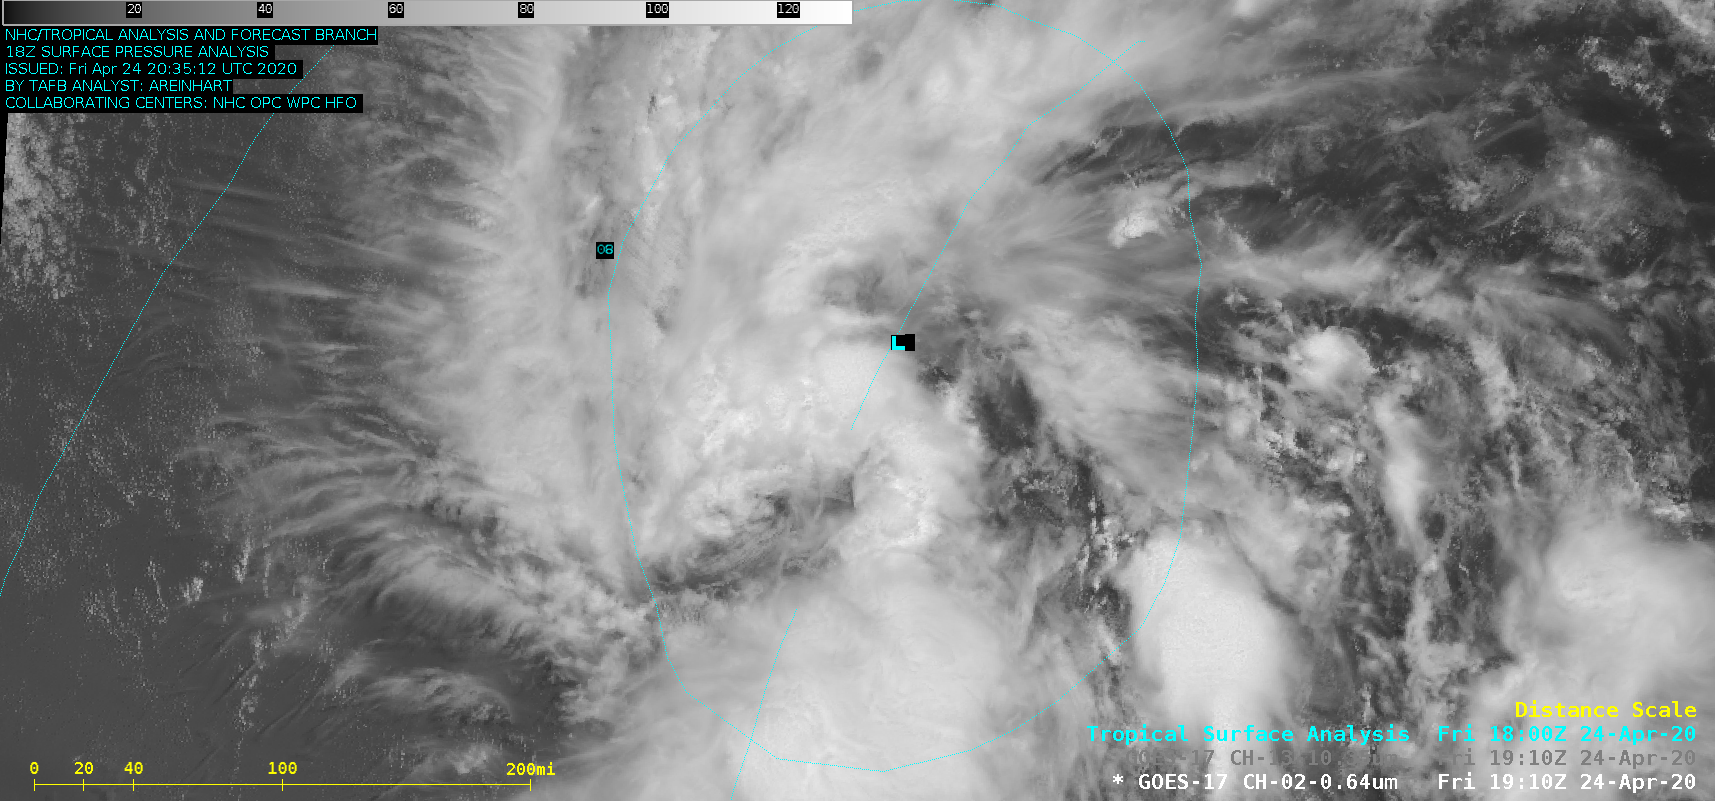
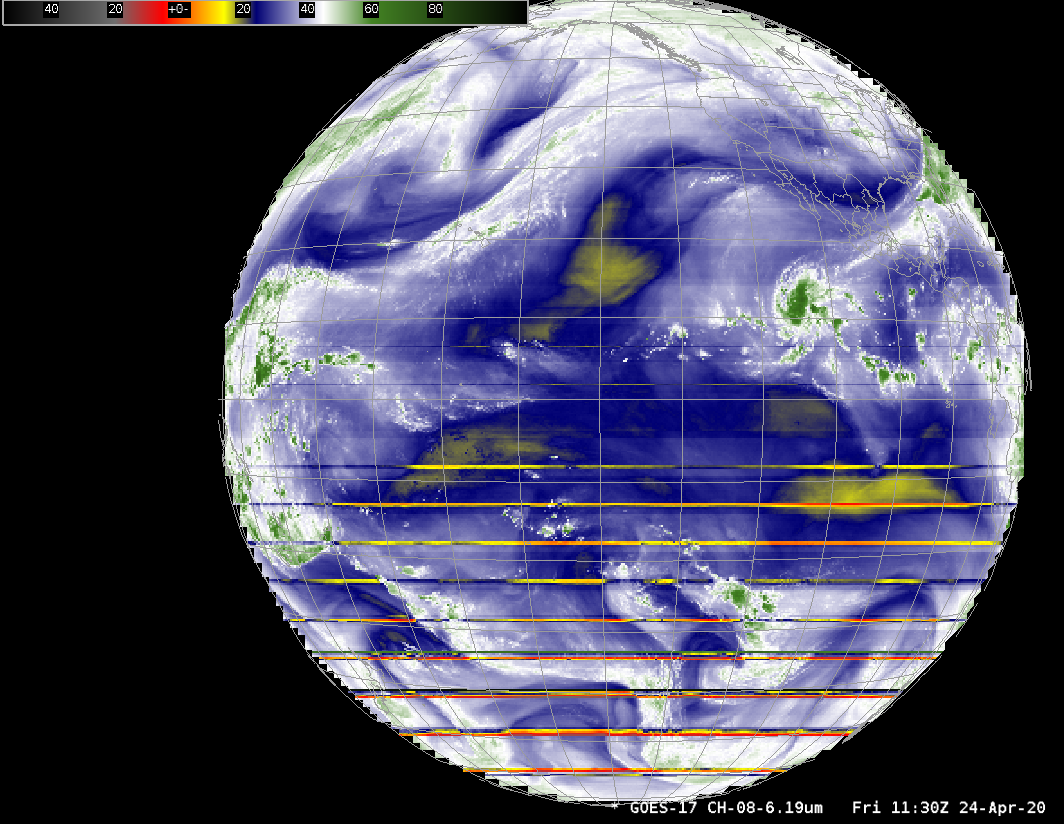
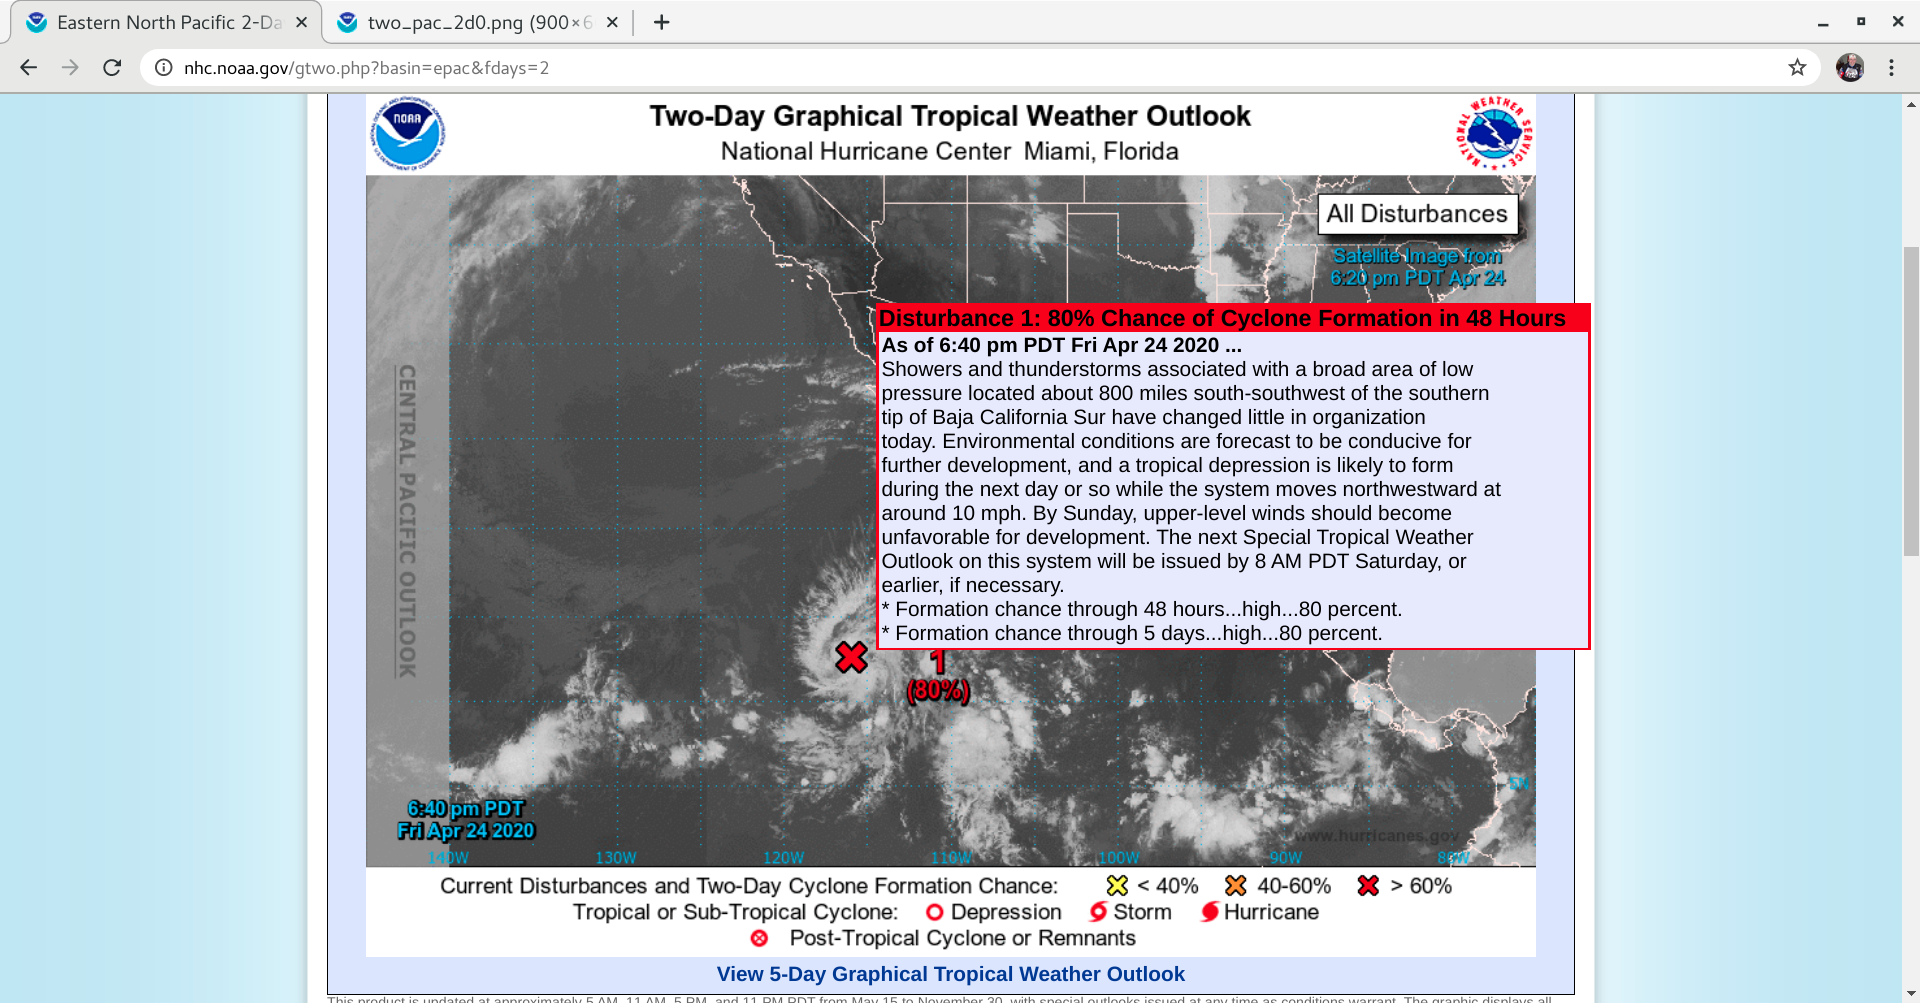
![GOES-17 “Red” Visible (0.64 µm) and “Clean” Infrared Window (10.35 µm) images [click to play animation | MP4]](https://cimss.ssec.wisc.edu/satellite-blog/images/2020/04/200424_goes17_visible_infrared_East_Pacific_Invest90E_anim.gif)
![GOES-17 “Red” Visible (0.64 µm) with a plot of Deep-Layer Wind Shear at 23 UTC images [click to enlarge]](https://cimss.ssec.wisc.edu/satellite-blog/images/2020/04/200424_23utc_goes17_visible_shear_Invest90E_anim.gif)
![VIIRS True Color RGB and Infrared Window (11.45 µm) images from NOAA-20 and Suomi NPP [click to enlarge]](https://cimss.ssec.wisc.edu/satellite-blog/images/2020/04/200424_noaa20_suomiNPP_trueColorRGB_infraredWindow_East_Pacific_Invest90E_anim.gif)
![GOES-17 “Clean” Infrared Window (10.35 µm) images [click to play animation | MP4]](https://cimss.ssec.wisc.edu/satellite-blog/images/2020/04/200425_goes17_infrared_Tropical_Depression_One_anim.gif)
![GOES-17 “Clean” Infrared Window (10.35 µm) images [click to play animation | MP4]](https://cimss.ssec.wisc.edu/satellite-blog/images/2020/04/200425_goes17_infrared_surfaceAnalysis_TD_One_anim.gif)
![MIMIC Total Precipitable Water product [click to enlarge]](https://cimss.ssec.wisc.edu/satellite-blog/images/2020/04/200424_200425_mimicTPW_East_Pacific_anim.gif)
![GOES-17 “Red” Visible (0.64 µm) images [click to play animation | MP4]](https://cimss.ssec.wisc.edu/satellite-blog/images/2020/04/200425_goes17_visible_Tropical_Depression_One_anim.gif)


![GOES-16 "Red" Visible (0.64 µm, top) and "Clean" Infrared Window (10.35 µm, bottom) images, with plots of SPC Storm Reports [click to play animation | MP4]](https://cimss.ssec.wisc.edu/satellite-blog/images/2020/04/200422_goes16_visible_infrared_spcStormReports_OK_anim.gif)
![GOES-16 "Red" Visible (0.64 µm) and "Clean" Infrared Window (10.35 µm) images [click to play animation | MP4]](https://cimss.ssec.wisc.edu/satellite-blog/images/2020/04/200422_goes16_visible_infrared_TX_severe_thunderstorms_anim.gif)
![GOES-16 "Red" Visible (0.64 µm, top) and "Clean" Infrared Window (10.35 µm, bottom) images, with plots of SPC Storm Reports [click to play animation | MP4]](https://cimss.ssec.wisc.edu/satellite-blog/images/2020/04/200422_goes16_visible_infrared_spcStormReports_TX_LA_anim.gif)
