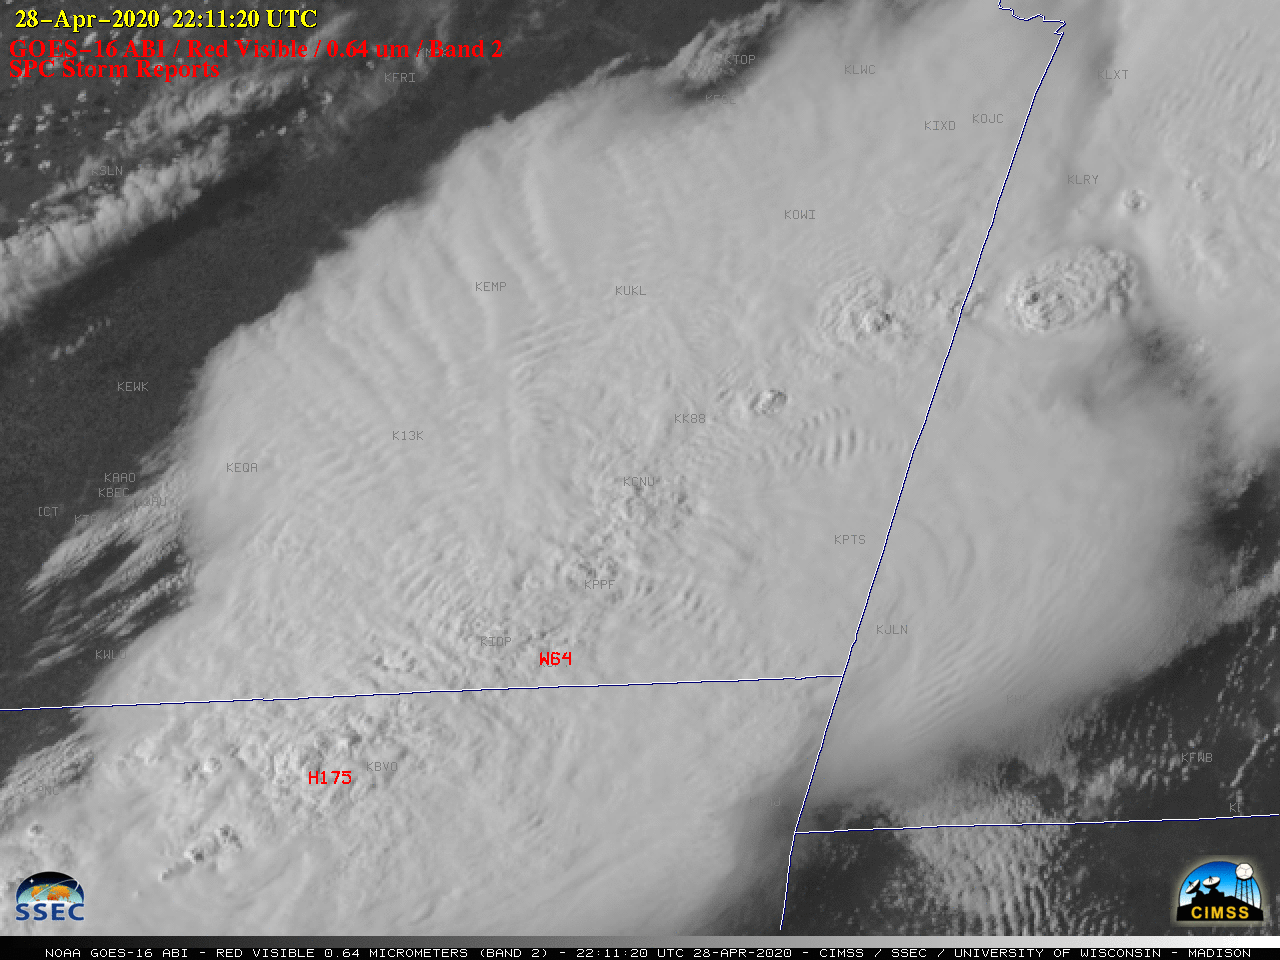
Overlapping 1-minute Mesoscale Domain Sectors provided GOES-16 (GOES-East) “Red” Visible (0.64 µm) images at 30-second intervals (above) — which showed rapidly-developing thunderstorms over northeastern Oklahoma, southeastern Kansas and southwestern Missouri on 28 April 2020. These storms developed along and ahead of an approaching cold front, and produced large hail and damaging winds (SPC Storm Reports).The corresponding 30-second GOES-16... Read More
![GOES-16 “Red” Visible (0.64 µm) images, with SPC Storm Reports plotted in red [click to play animation | MP4]](https://cimss.ssec.wisc.edu/satellite-blog/images/2020/04/G16_VIS_KS_SPC_28APR2020_B2_2020119_221120_GOES-16_0001PANEL_FRAME00263.GIF)
GOES-16 “Red” Visible (0.64 µm) images, with time-matched SPC Storm Reports plotted in red [click to play animation | MP4]
Overlapping 1-minute
Mesoscale Domain Sectors provided GOES-16
(GOES-East) “Red” Visible (
0.64 µm) images at 30-second intervals
(above) — which showed rapidly-developing thunderstorms over northeastern Oklahoma, southeastern Kansas and southwestern Missouri on
28 April 2020. These storms developed along and ahead of an approaching
cold front, and produced large hail and damaging winds (
SPC Storm Reports).
The corresponding 30-second GOES-16 “Clean” Infrared Window (10.35 µm) images are shown below.
![GOES-16 "Clean" Infrared Window (10.35 µm) images, with time-matched SPC Storm Reports plotted in cyan [click to play animation | MP4]](https://cimss.ssec.wisc.edu/satellite-blog/images/2020/04/G16_IR_KS_SPC_28APR2020_B13_2020119_221120_GOES-16_0001PANEL_FRAME00263.GIF)
GOES-16 “Clean” Infrared Window (10.35 µm) images, with time-matched SPC Storm Reports plotted in cyan [click to play animation | MP4]
NOAA-20 Gridded NUCAPS fields of Most-Unstable CAPE at 1927 UTC
(below) indicated that an axis of high instability existed along the Kansas/Missouri border shortly preceding convective initiation.
![VIIRS Visible image with available NUCAPS soundings + Gridded NUCAPS Most-Unstable CAPE [click to enlarge]](https://cimss.ssec.wisc.edu/satellite-blog/images/2020/04/200428_1925utc_viirs_visible_nucaps_mucape_anim.gif)
NOAA-20 VIIRS Visible (0.64 µm) image with available NUCAPS sounding points + Gridded NUCAPS Most-Unstable CAPE [click to enlarge]
![NUCAPS profile for the green point located in far eastern Kansas [click to enlarge]](https://cimss.ssec.wisc.edu/satellite-blog/images/2020/04/200428_19z_nucaps_profile_KS.png)
NUCAPS profile for the green sounding point located in far eastern Kansas [click to enlarge]
Within that axis of instability along the Kansas/Missouri border, the NUCAPS profile for the green (using both Infrared and Microwave retrievals) sounding point in far eastern Kansas
(located northeast of Chanute, station identifier KCNU) is shown above — for the Most Unstable air parcel, calculated CAPE was 3714 J/kg, with a Lifted Index of -12ºC.
Farther to the south, the NUCAPS profile for the yellow (using only Microwave retrievals) sounding point (located east-southeast of KCNU) is shown below — for the Most Unstable air parcel, calculated CAPE was 3714 J/kg, with a Lifted Index of -14ºC.
![NUCAPS profile for the yellow sounding point located in far eastern Kansas [click to enlarge]](https://cimss.ssec.wisc.edu/satellite-blog/images/2020/04/200428_19utc_nucaps_microwave_KS.png)
NUCAPS profile for the yellow sounding point located in far eastern Kansas [click to enlarge]
The closest rawinsonde report (in terms of time and distance) was from Springfield in southwestern Missouri at 18 UTC
(below) — it indicated Most Unstable CAPE and Lifted Index values of 3060 J/kg and -6ºC, respectively. The later availability of NUCAPS soundings closer to the region of convective initiation revealed the rapid atmospheric destabilization that allowed for explosive development of the severe thunderstorms as seen on GOES-16 imagery.
![Plot of 18 UTC rawinsonde data from Springfield, Missouri [click to enlarge]](https://cimss.ssec.wisc.edu/satellite-blog/images/2020/04/200428_18utc_ksgf_raob.png)
Plot of 18 UTC rawinsonde data from Springfield, Missouri [click to enlarge]
View only this post
Read Less
![GOES-16 “Red” Visible (0.64 µm) images, with SPC Storm Reports plotted in red [click to play animation | MP4]](https://cimss.ssec.wisc.edu/satellite-blog/images/2020/04/200428_goes16_visible_spcStormReports_KS_MO_anim.gif)
![GOES-16 "Clean" Infrared Window (10.35 µm) images, with time-matched SPC Storm Reports plotted in cyan [click to play animation | MP4]](https://cimss.ssec.wisc.edu/satellite-blog/images/2020/04/200428_goes16_infrared_spcStormReports_KS_MO_anim.gif)
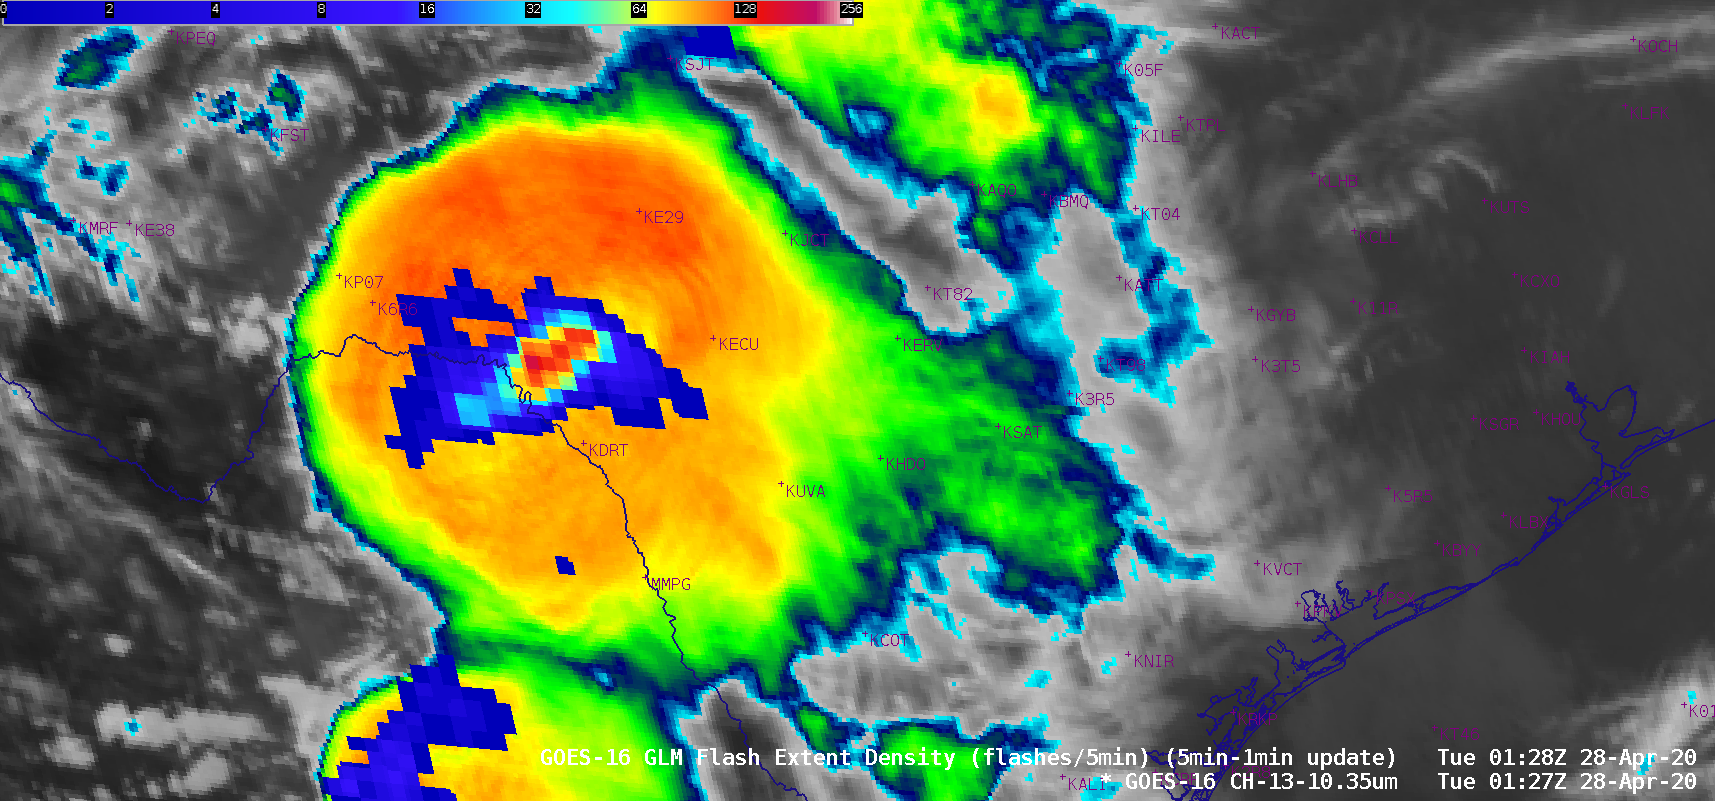
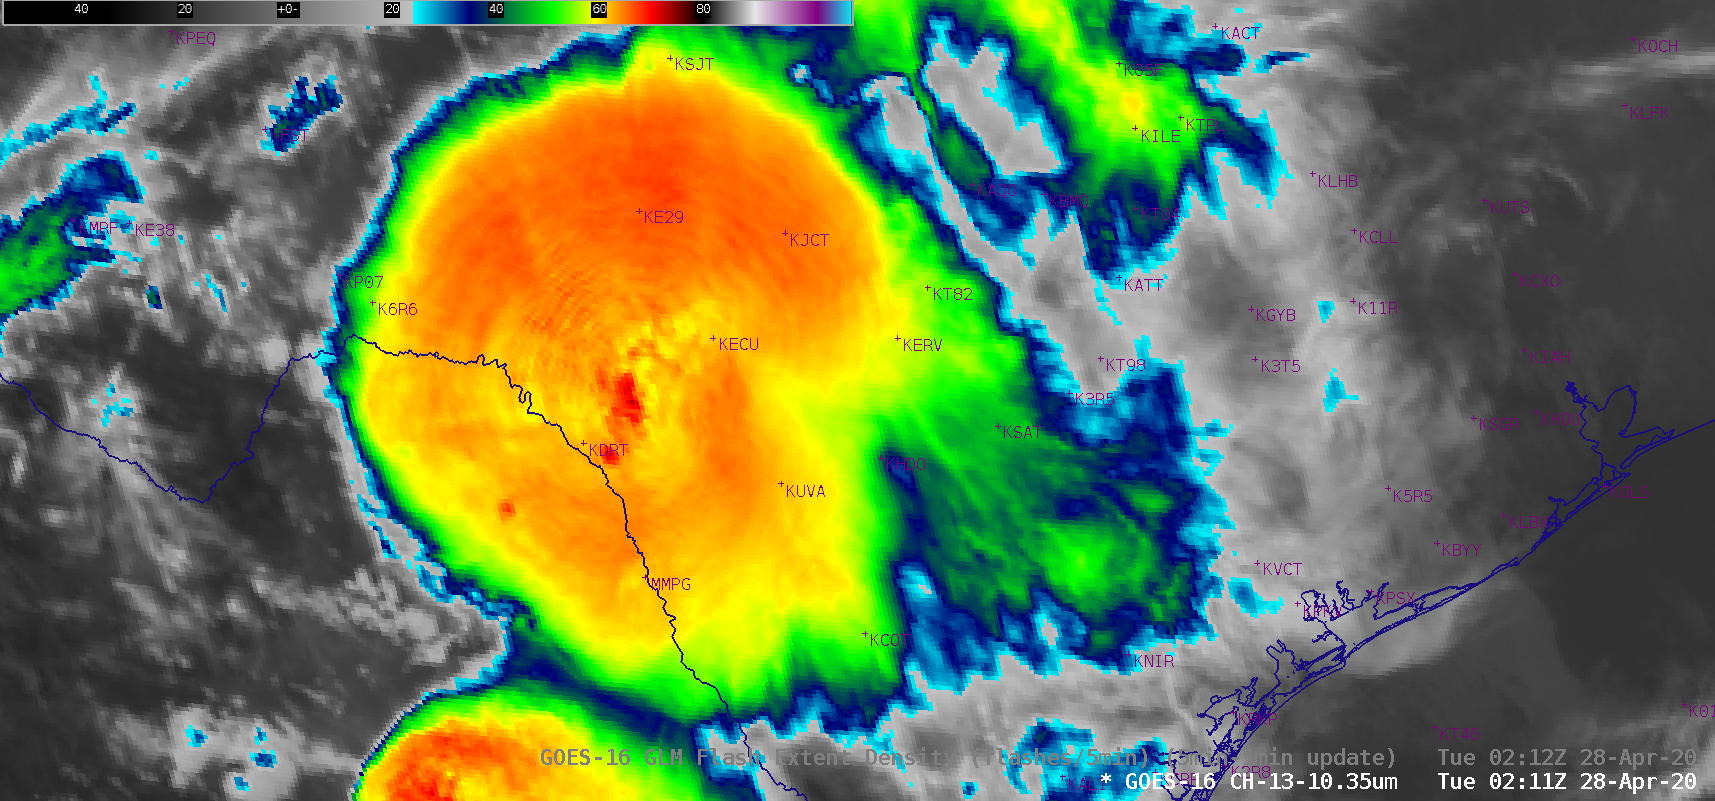
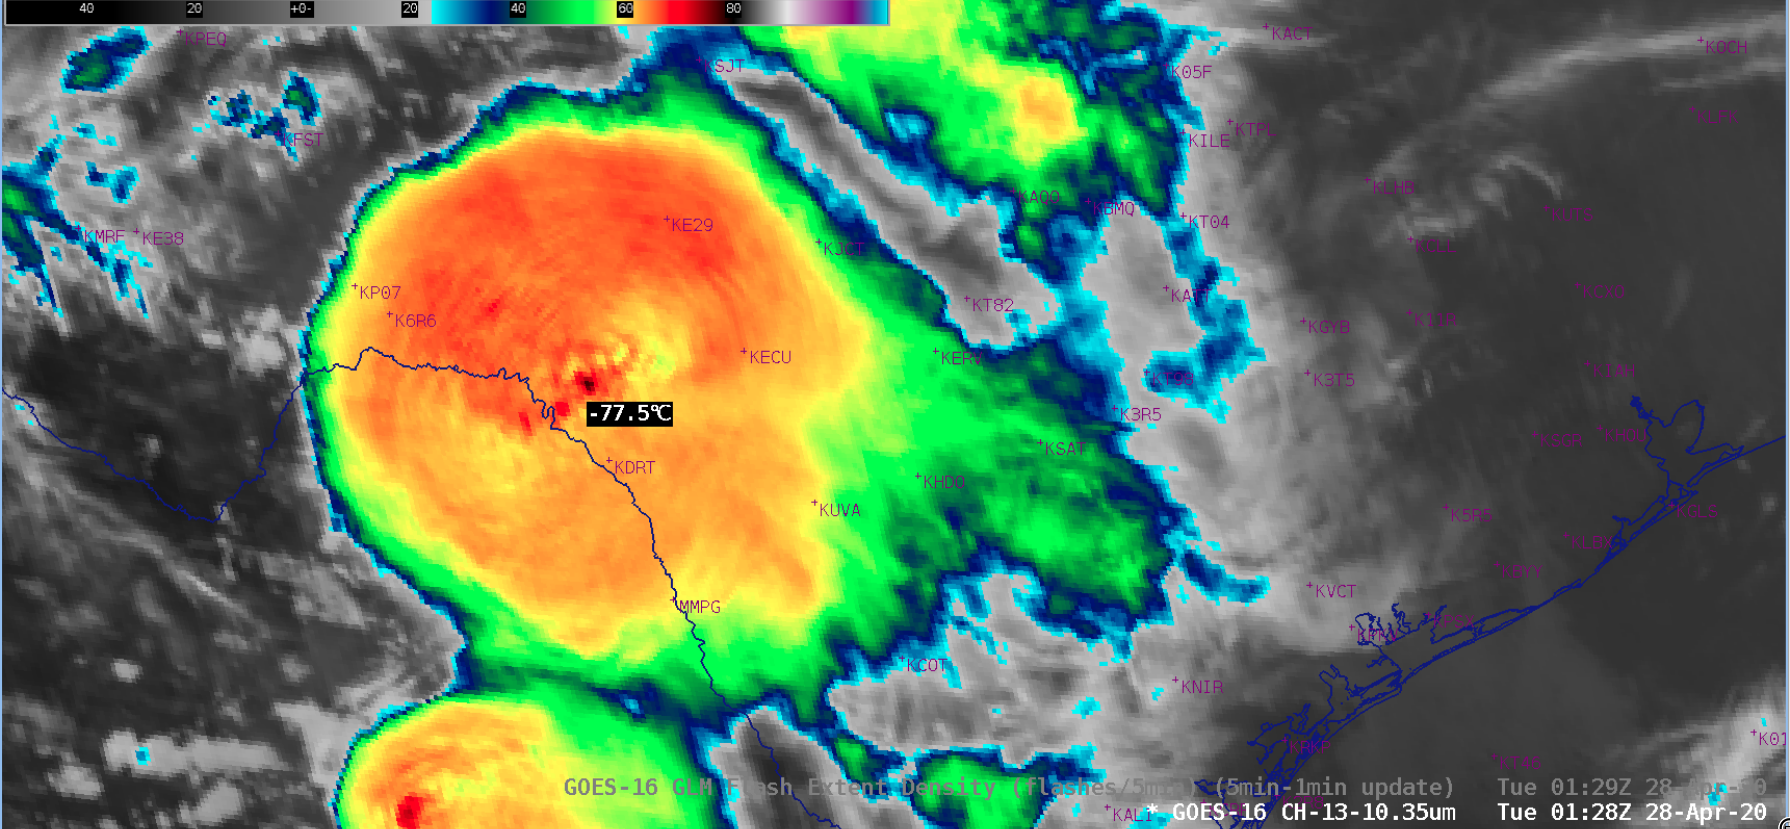
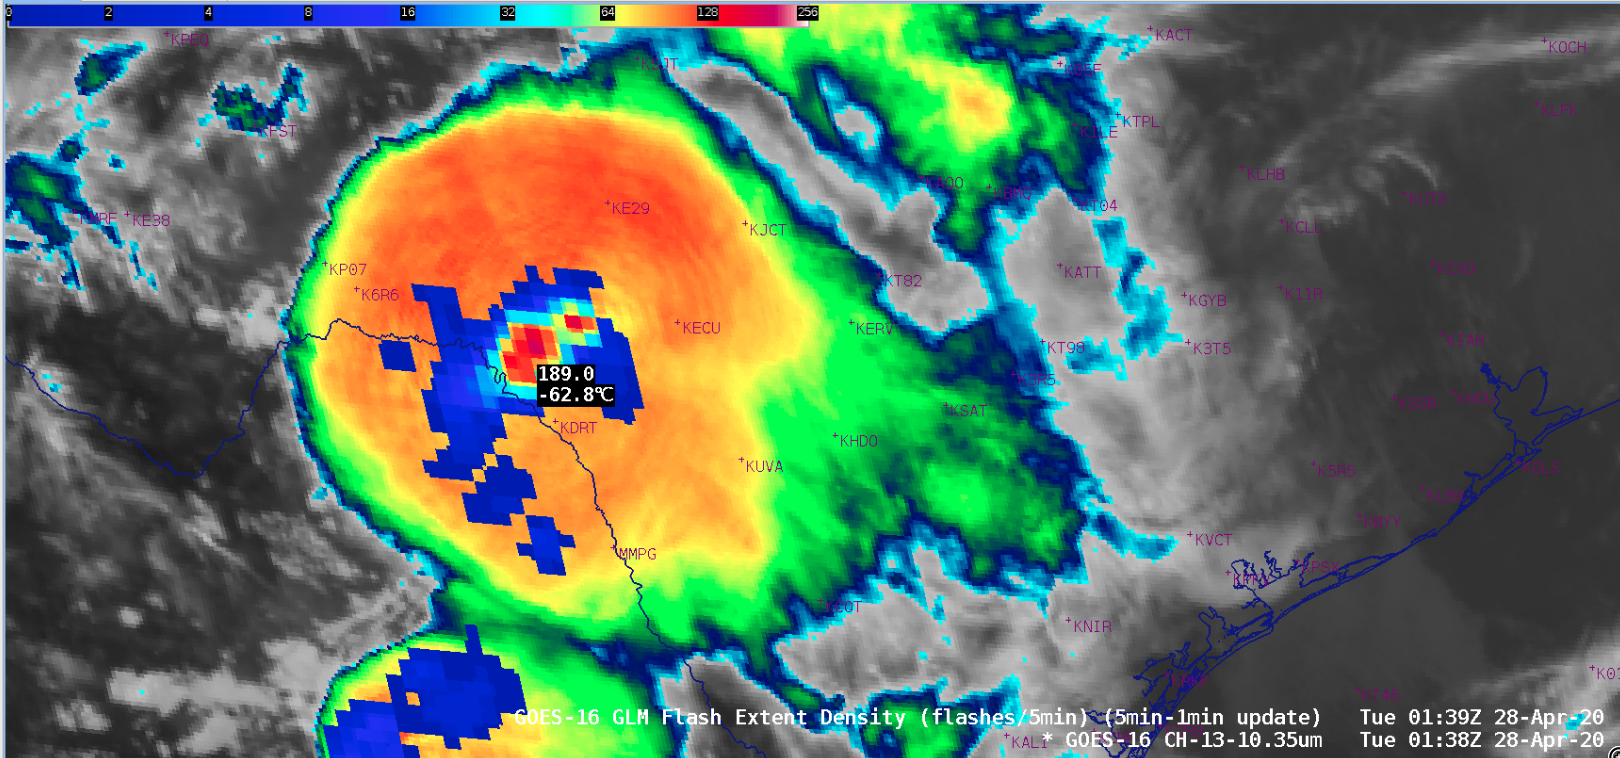
![GOES-16 "Clean" Infrared Window (10.35 µm) images, with and without an overlay of GLM Flash Extent Density [click to play animation | MP4]](https://cimss.ssec.wisc.edu/satellite-blog/images/2020/04/200427_goes16_infrared_glmFlashExtentDensity_TX_anim.gif)


![GOES-16 "Clean" Infrared Window (10.35 µm) images, with and without GLM Groups plotted in cyan, at 0421 UTC on 26 April [click to enlarge]](https://cimss.ssec.wisc.edu/satellite-blog/images/2020/04/200426_0421utc_goes16_infrared_glmGroups_Mexico_mcs_anim.gif)
![NOAA-20 VIIRS Infrared Window (11.45 µm) and Day/Night Band (0.7 µm) images at 0841 UTC [click to enlarge]](https://cimss.ssec.wisc.edu/satellite-blog/images/2020/04/200426_0841utc_noaa20_viirs_infrared_dayNightBand_Mexico_mcs_anim.gif)
![Plots of rawinsonde data from Veracruz, Mexico [click to enlarge]](https://cimss.ssec.wisc.edu/satellite-blog/images/2020/04/200425_20426_MMVR_RAOBS.GIF)
![GOES-16 True Color RGB images [click to play animation | MP4]](https://cimss.ssec.wisc.edu/satellite-blog/images/2020/04/200425_goes16_trueColorRGB_Gulf_of_Mexico_frontal_bore_anim.gif)
