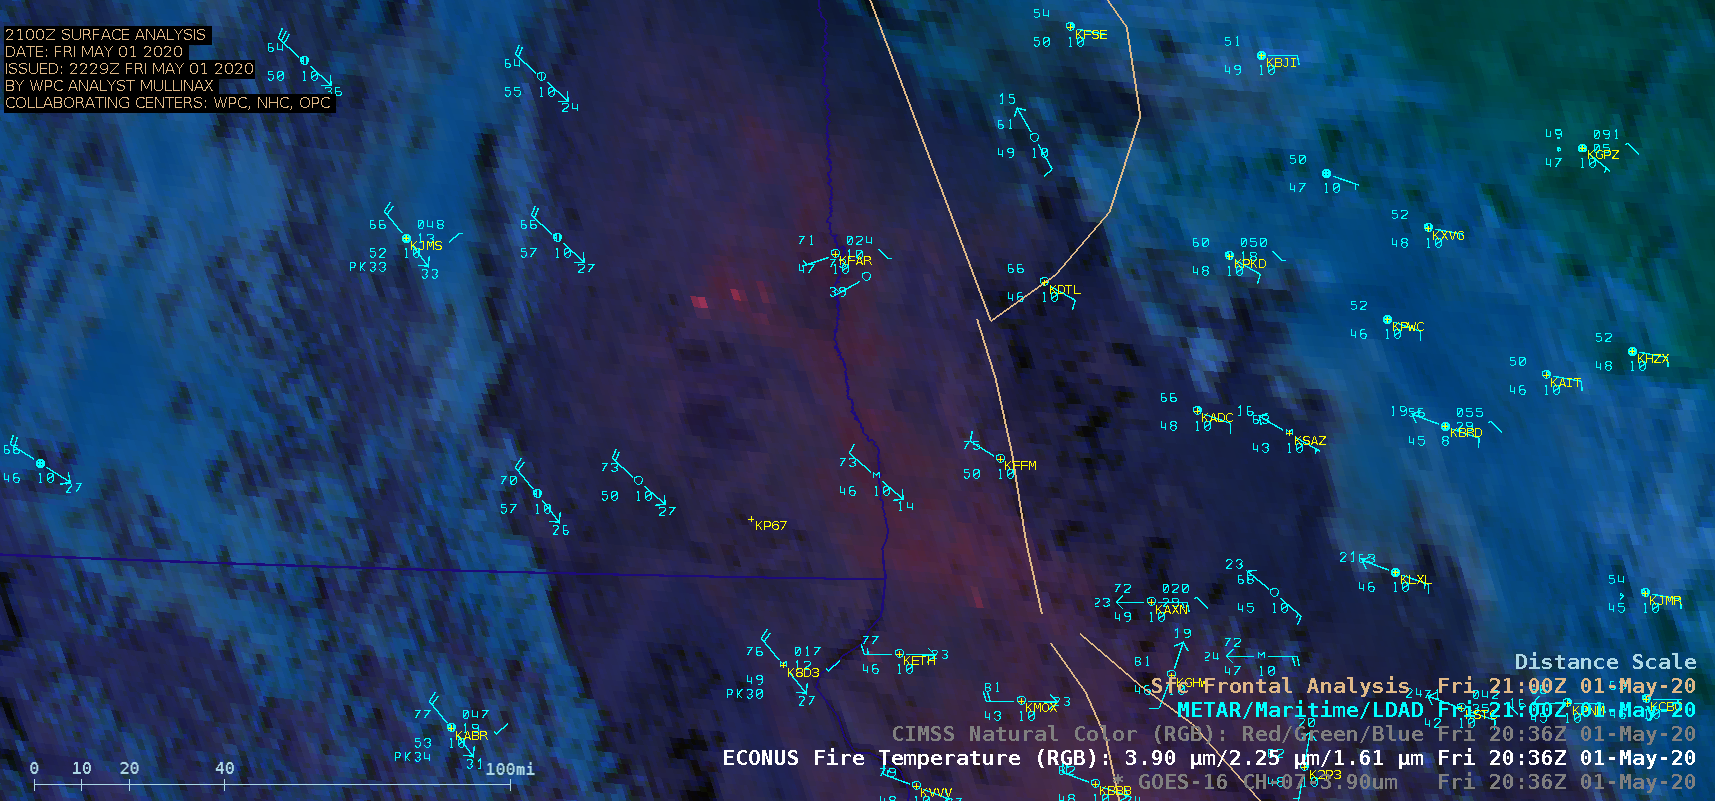
GOES-16 (GOES-East) CIMSS Natural Color Red-Green-Blue (RGB), Fire Temperature RGB and Shortwave Infrared (3.9 µm) images (above) revealed a small cluster of fires in southeastern North Dakota, as well as isolated fires in far western Minnesota and far northeastern South Dakota on 01 May 2020. Strong winds — gusting over 30 mph at some locations... Read More
![GOES-16 CIMSS Natural Color RGB, Fire Temperature RGB and Shortwave Infrared (3.9 µm) images [click to play animation | MP4]](https://cimss.ssec.wisc.edu/satellite-blog/images/2020/05/nd_fire-20200501_203611.png)
GOES-16 CIMSS Natural Color RGB, Fire Temperature RGB and Shortwave Infrared (3.9 µm) images [click to play animation | MP4]
GOES-16
(GOES-East) CIMSS Natural Color Red-Green-Blue (RGB),
Fire Temperature RGB and Shortwave Infrared (
3.9 µm) images
(above) revealed a small cluster of fires in southeastern North Dakota, as well as isolated fires in far western Minnesota and far northeastern South Dakota on
01 May 2020. Strong winds — gusting over 30 mph at some locations — in the wake of a frontal passage helped some of these agricultural fires to intensify for a few hours, with pyrocumulus clouds and a smoke plume being produced by the cluster of fires in southeastern North Dakota.
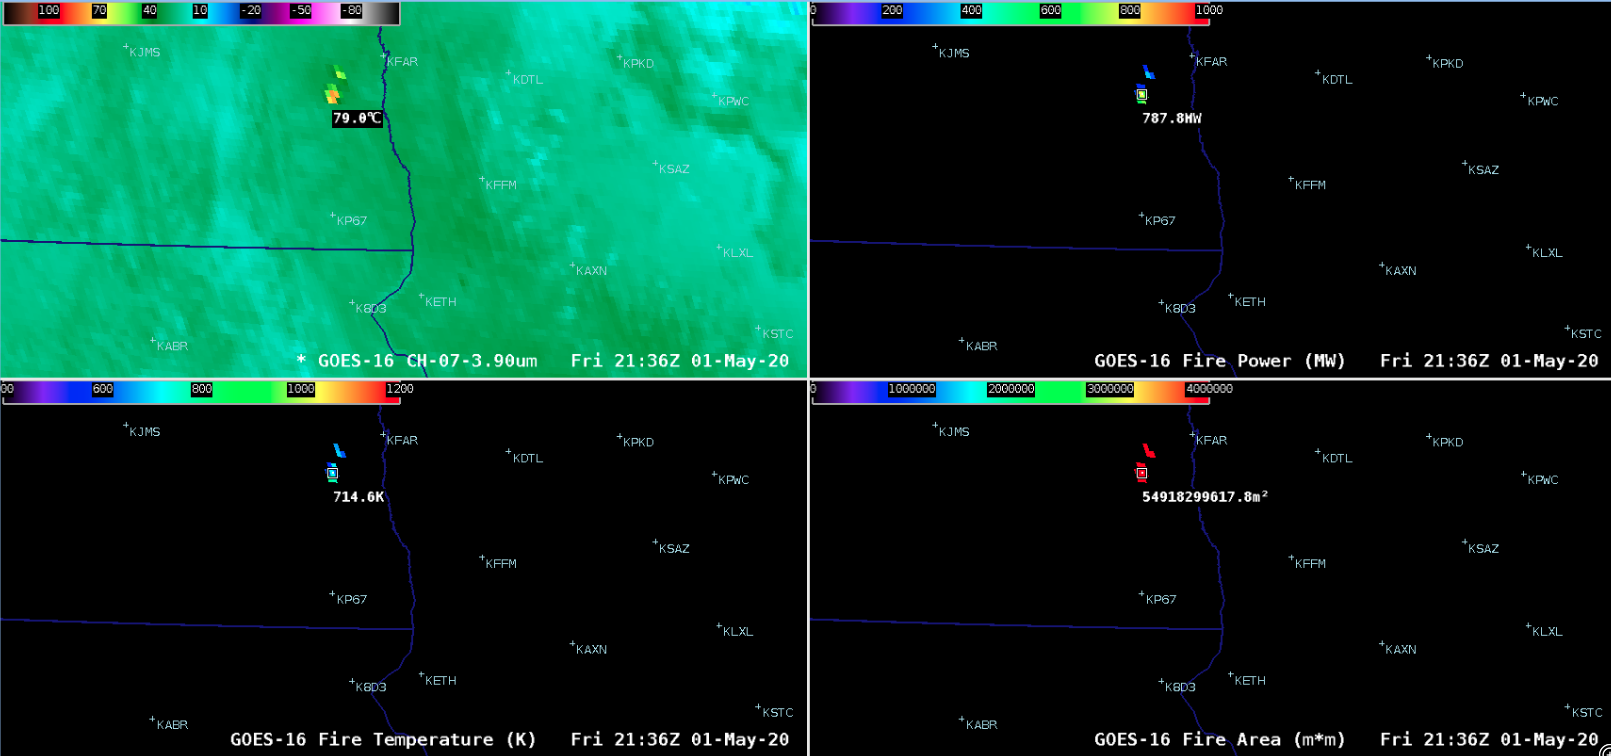
GOES-16 derived products such as Fire Power, Fire Temperature and Fire Area (below) allow individual fire pixels to be sampled and characterized — for example, at 2136 UTC.
![GOES-16 Shortwave Infrared (3.9 µm, top left), Fire Power (top right), Fire Temperature (bottom left) and Fire Area (bottom right) images [click to play animation | MP4]](https://cimss.ssec.wisc.edu/satellite-blog/images/2020/05/nd_4panel-20200501_213611.png)
GOES-16 Shortwave Infrared (3.9 µm, top left), Fire Power (top right), Fire Temperature (bottom left) and Fire Area (bottom right) images [click to play animation | MP4]
View only this post
Read Less
![GOES-16 CIMSS Natural Color RGB, Fire Temperature RGB and Shortwave Infrared (3.9 µm) images [click to play animation | MP4]](https://cimss.ssec.wisc.edu/satellite-blog/images/2020/05/200501_goes16_naturalColorRGB_fireTemperatureRGB_shortwaveInfrared_ND_MN_fires_anim.gif)
![GOES-16 Shortwave Infrared (3.9 µm, top left), Fire Power (top right), Fire Temperature (bottom left) and Fire Area (bottom right) images [click to play animation | MP4]](https://cimss.ssec.wisc.edu/satellite-blog/images/2020/05/200501_goes16_shortwaveInfrared_firePower_fireTemperature_fireArea_ND_MN_fires_anim.gif)
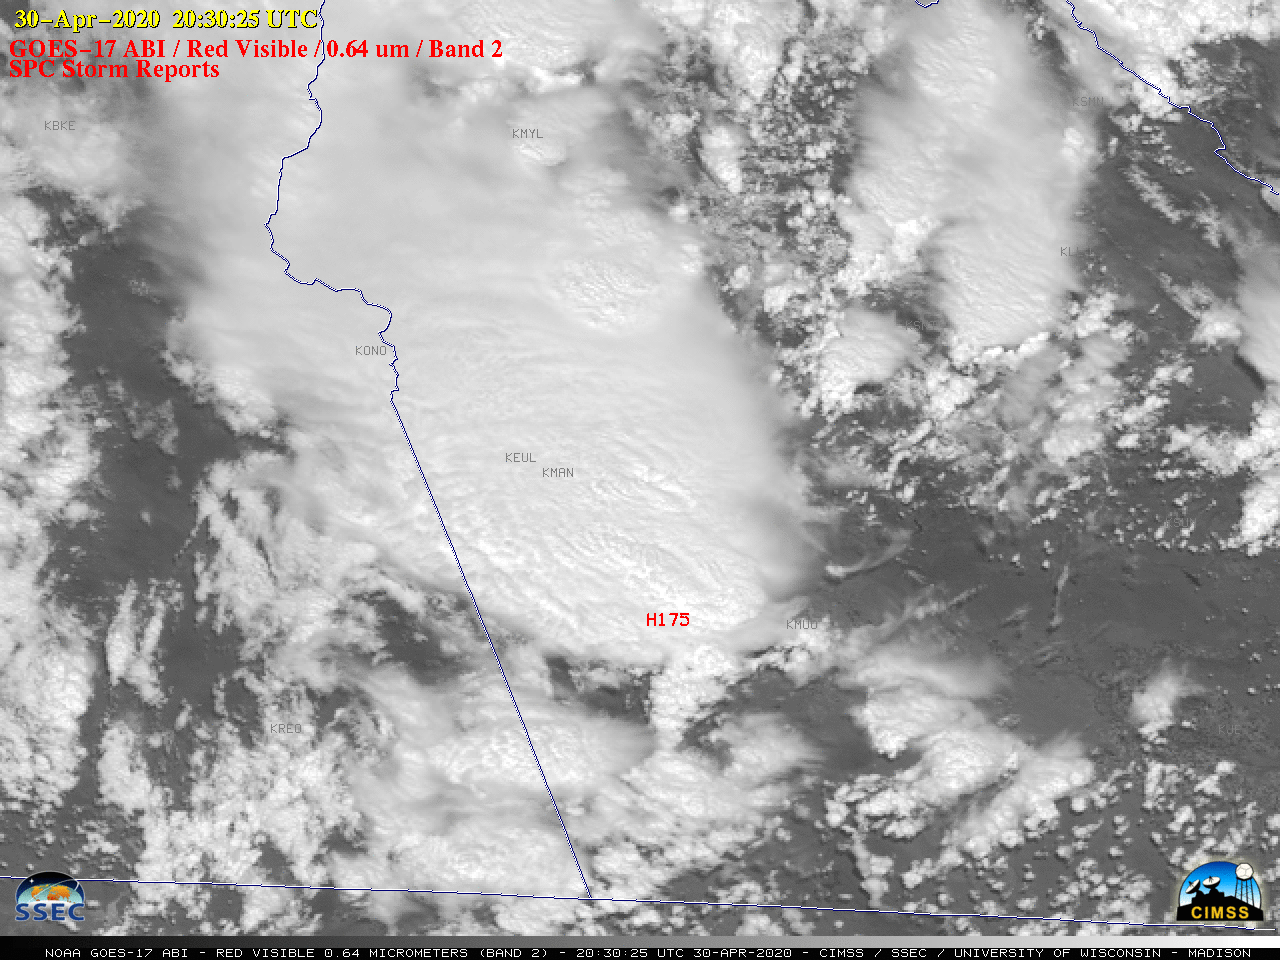
![GOES-17 “Red” Visible (0.64 µm) images, with time-matched SPC Storm Reports plotted in red [click to play animation | MP4]](https://cimss.ssec.wisc.edu/satellite-blog/images/2020/04/200430_goes17_30second_visible_spcStormReports_ID_anim.gif)
![GOES-17 Dust RGB images [click to play animation | MP4]](https://cimss.ssec.wisc.edu/satellite-blog/images/2020/04/200430_goes17_dustRGB_NV_ID_bldn_anim.gif)
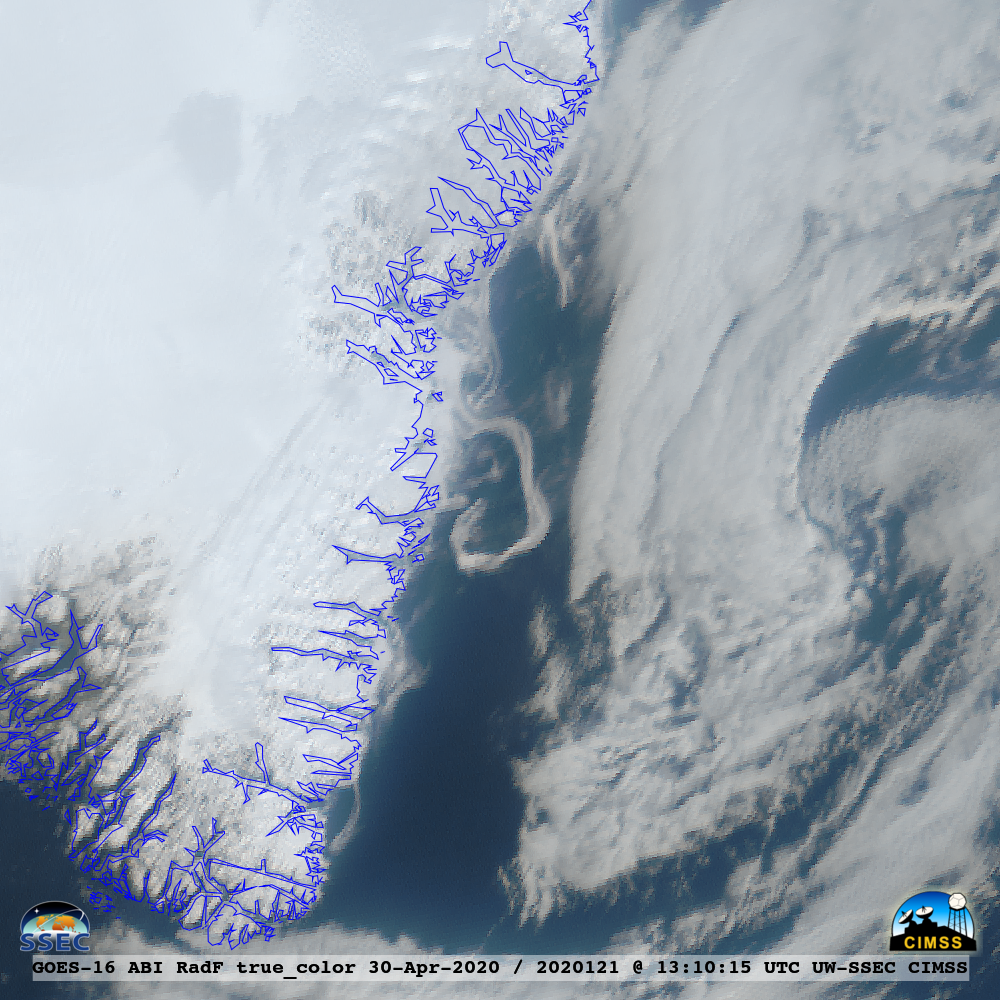
![GOES-16 True Color RGB images [click to play animation | MP4]](https://cimss.ssec.wisc.edu/satellite-blog/images/2020/04/200430_goes16_trueColorRGB_Greenland_ice_anim.gif)
