![GOES-3 Visible (0.65 µm) images at 1545 and 1615 UTC [click to enlarge]](https://cimss.ssec.wisc.edu/satellite-blog/images/2020/05/19800518_1545utc_1615utc_goes3_visible_Mount_St_Helens_anim.gif)
GOES-3 Visible (0.65 µm) images at 1545 and 1615 UTC [click to enlarge]
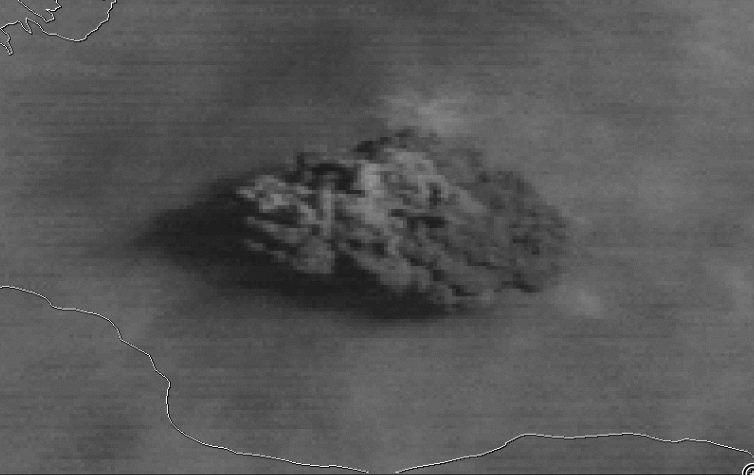
The corresponding GOES-3 Infrared (11.5 µm) image at 1545 UTC (below) appeared to display a small “enhanced-V” or cold/warm (-65ºC/-47ºC) thermal couplet signature downwind (east) of the volcanic cloud’s overshooting top.
![GOES-3 Infrared (11.5 µm) image at 1545 UTC [click to enlarge]](https://cimss.ssec.wisc.edu/satellite-blog/images/2020/05/960x1280_AGOES03_B8_GOES03_IR_MT_ST_HELENS_18MAY1980_1545Z_1980139_154500_0001PANEL.GIF)
GOES-3 Infrared (11.5 µm) image at 1545 UTC [click to enlarge]
![GOES-3 Visible (0.65 µm, top) and Infrared Window (11.5 µm, bottom) images [click to play animation]](https://cimss.ssec.wisc.edu/satellite-blog/wp-content/uploads/sites/5/2016/05/19800518_goes03_visible_infrared_Mount_St_Helens_eruption_anim.gif)
GOES-3 Visible (0.65 µm, top) and Infrared (11.5 µm, bottom) images [click to play animation]
![NASA SMS 2 Visible (0.62 µm) images (credit: Tim Schmit, ASPB/CIMSS) [click to play MP4 anmation]](https://cimss.ssec.wisc.edu/satellite-blog/wp-content/uploads/sites/5/2020/05/19800518_1600utc_sms_visible-300x208.png)
NASA SMS-2 Visible (0.62 µm) images (credit: Tim Schmit, ASPB/CIMSS) [click to play MP4 animation]
![NASA SMS 2 Infrared (11.6 µm) images (credit: Tim Schmit, ASPB/CIMSS) [click to play MP4 animation]](https://cimss.ssec.wisc.edu/satellite-blog/wp-content/uploads/sites/5/2020/05/19800518_1600utc_sms_ir-300x209.png)
NASA SMS-2 Infrared (11.6 µm) images (credit: Tim Schmit, ASPB/CIMSS) [click to play MP4 animation]
![NASA SMS-2 Visible/Infrared Sandwich RGB images (credit: Tim Schmit, ASPB/CIMSS) [click to play MP4 animation]](https://cimss.ssec.wisc.edu/satellite-blog/images/2020/05/SUBSET_SMS-II_SANDWICH_MED_MAP_18-May-1980_1600_UTC.JPG)
NASA SMS-2 Visible/Infrared Sandwich RGB images (credit: Tim Schmit, ASPB/CIMSS) [click to play MP4 animation]
The ability to monitor volcanic ash plumes and their attributes has greatly improved from 1980 to today — moving from qualitative (somewhat after the fact imagery) to quantitative applications (that are more frequent, and therefore much more timely!). Due to the large number of volcanoes worldwide, satellite observations are key in monitoring the Earth’s volcanoes for aviation safety and other applications. More on volcanic cloud monitoring.
View only this post Read Less

![GOES-16 "Red" Visible (0.64 µm) images [click to play animation | MP4]](https://cimss.ssec.wisc.edu/satellite-blog/images/2020/05/200517_goes16_visible_TS_Arthur_anim.gif)
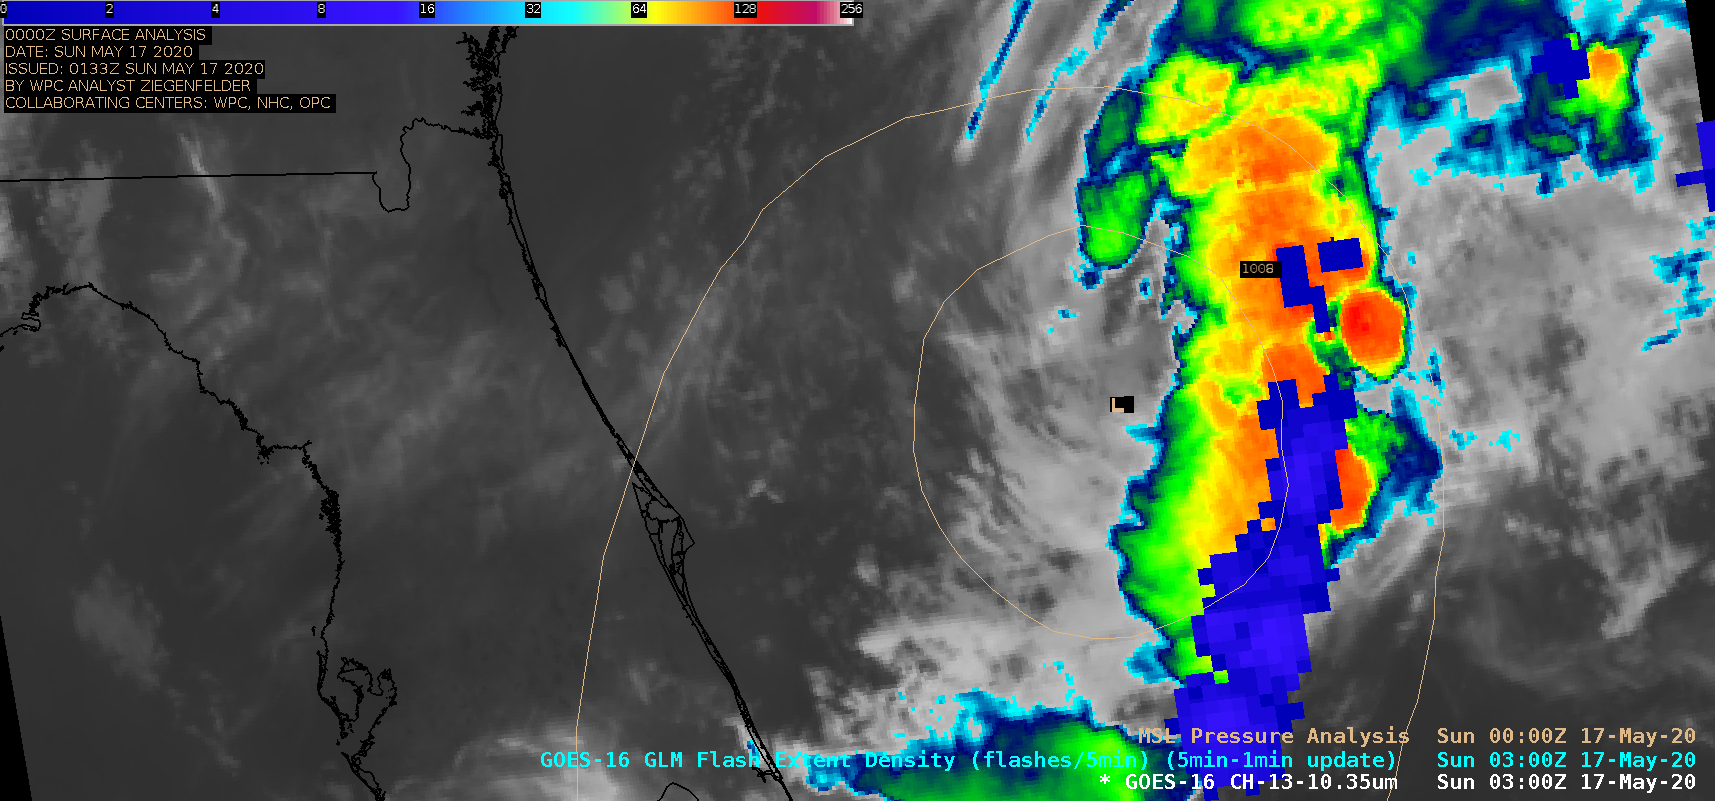
![GOES-16 "Clean" Infrared Window (10.35 µm) images, with and without an overlay of GLM Flash Extent Density [click to play animation | MP4]](https://cimss.ssec.wisc.edu/satellite-blog/images/2020/05/200517_goes16_infrared_glmFlashExtentDensity_TS_Arthur_2_anim.gif)
![GOES-16 "Red" Visible (0.64 µm) images [click to play animation | MP4]](https://cimss.ssec.wisc.edu/satellite-blog/images/2020/05/200518_goes16_visible_TS_Arthur_anim.gif)
![GOES-16 "Red" Visible (0.64 µm) images, with plots of Metop ASCAT winds [click to play animation | MP4]](https://cimss.ssec.wisc.edu/satellite-blog/images/2020/05/200518_goes16_visible_ascat_TS_Arthur_anim.gif)

![GOES-16 "Clean" Infrared Window (10.35 µm) images, with SPC Storm Reports plotted in cyan [click to play animation | MP4]](https://cimss.ssec.wisc.edu/satellite-blog/images/2020/05/200515_goes16_infrared_spcStormReports_OK_anim.gif)
![Plots of rawinsonde data from Norman, Oklahoma [click to enlarge]](https://cimss.ssec.wisc.edu/satellite-blog/images/2020/05/200515_KOUN_RAOBS.GIF)
