
GOES-16 (GOES-East) Mid-level Water Vapor (6.9 µm) images (above) showed the circulation associated with a midlatitude cyclone that moved southeastward from southern Canada across the Upper Midwest on 09 May 2020. This system brought a variety of precipitation to the region, including snow with several inches of accumulation in parts of North Dakota and Minnesota.Anomalously strong winds were... Read More
![GOES-16 Mid-level Water Vapor (6.9 µm) images, with hourly surface weather type plotted in red (R=rain; S=snow; F=fog) [click to pay animation | MP4]](https://cimss.ssec.wisc.edu/satellite-blog/images/2020/05/G16_WV_MIDWEST_STORM_08MAY2020_B9_2020130_160111_GOES-16_0001PANEL_FRAME00121.GIF)
GOES-16 Mid-level Water Vapor (6.9 µm) images, with hourly surface weather type plotted in red (R=rain; ZR=freezing rain; S=snow; L=drizzle; F=fog) [click to play animation | MP4]
GOES-16
(GOES-East) Mid-level Water Vapor (
6.9 µm) images
(above) showed the circulation associated with a midlatitude cyclone that moved southeastward from southern Canada across the Upper Midwest on
09 May 2020. This system brought a variety of precipitation to the region, including snow with
several inches of accumulation in parts of North Dakota and Minnesota.
Anomalously strong winds were associated with this storm, which produced peak wind gusts of 60 mph or higher in North Dakota and South Dakota — hourly surface winds with gusts are plotted on GOES-16 Water Vapor images (below).
![GOES-16 Mid-level Water Vapor (6.9 µm) images, with plots of hourly wind barbs and gusts [click to pay animation | MP4]](https://cimss.ssec.wisc.edu/satellite-blog/images/2020/05/G16_WV_WINDS_MIDWEST_STORM_08MAY2020_B9_2020130_180111_GOES-16_0001PANEL_FRAME00145.GIF)
GOES-16 Mid-level Water Vapor (6.9 µm) images, with plots of hourly wind barbs and gusts [click to play animation | MP4]
GOES-16 Day Cloud Phase Distinction RGB images
(below) revealed the northwest-to-southeast oriented swath of fresh snowfall
(brighter shades of green) from eastern Saskatchewan ad western Manitoba into north-central North Dakota. The edges of the snow swath began to rapidly melt during the day, due to the warming power of the early May sun.
![GOES-16 Day Cloud Phase Distinction RGB images [click to play animation | MP4]](https://cimss.ssec.wisc.edu/satellite-blog/images/2020/05/snow-20200509_173611.png)
GOES-16 Day Cloud Phase Distinction RGB images [click to play animation | MP4]
===== 10 May Update =====
![GOES-16 Day Cloud Phase Distinction RGB images [click to play animation | MP4]](https://cimss.ssec.wisc.edu/satellite-blog/images/2020/05/msn_snow-20200510_170111.png)
GOES-16 Day Cloud Phase Distinction RGB images [click to play animation | MP4]
As the
surface low’s occluded front moved across southern Wisconsin on the morning of
10 May, GOES-16 Day Cloud Phase Distinction RGB images
(above) provided a nice depiction of of the brief period of dynamic cooling and transition from rain to snow as glaciated cloud tops
(shades of green) blossomed over the Madison (KMSN) area.
View only this post
Read Less

![NOAA-20 Day/Night Band (0.7 µm) and Infrared Window (11.45 µm) images (credit: William Straka, CIMSS) [click to enlarge]](https://cimss.ssec.wisc.edu/satellite-blog/images/2020/05/200513_1703utc_noaa20_viirs_dayNightBand_infraredWindow_Typhoon_Vongfong_anim.gif)
![Suomi NPP VIIRS True Color RGB and Infrared Window (11.45 µm) images [click to enlarge]](https://cimss.ssec.wisc.edu/satellite-blog/images/2020/05/200514_04utc_suomiNPP_viirs_trueColorRGB_infrared_Vongfong_anim.gif)
![Himawari-8 True Color RGB images [click to play animation | MP4]](https://cimss.ssec.wisc.edu/satellite-blog/images/2020/05/200512_hmawari8_trueColorRGB_Gobi_Desert_dust_plume_anim.gif)
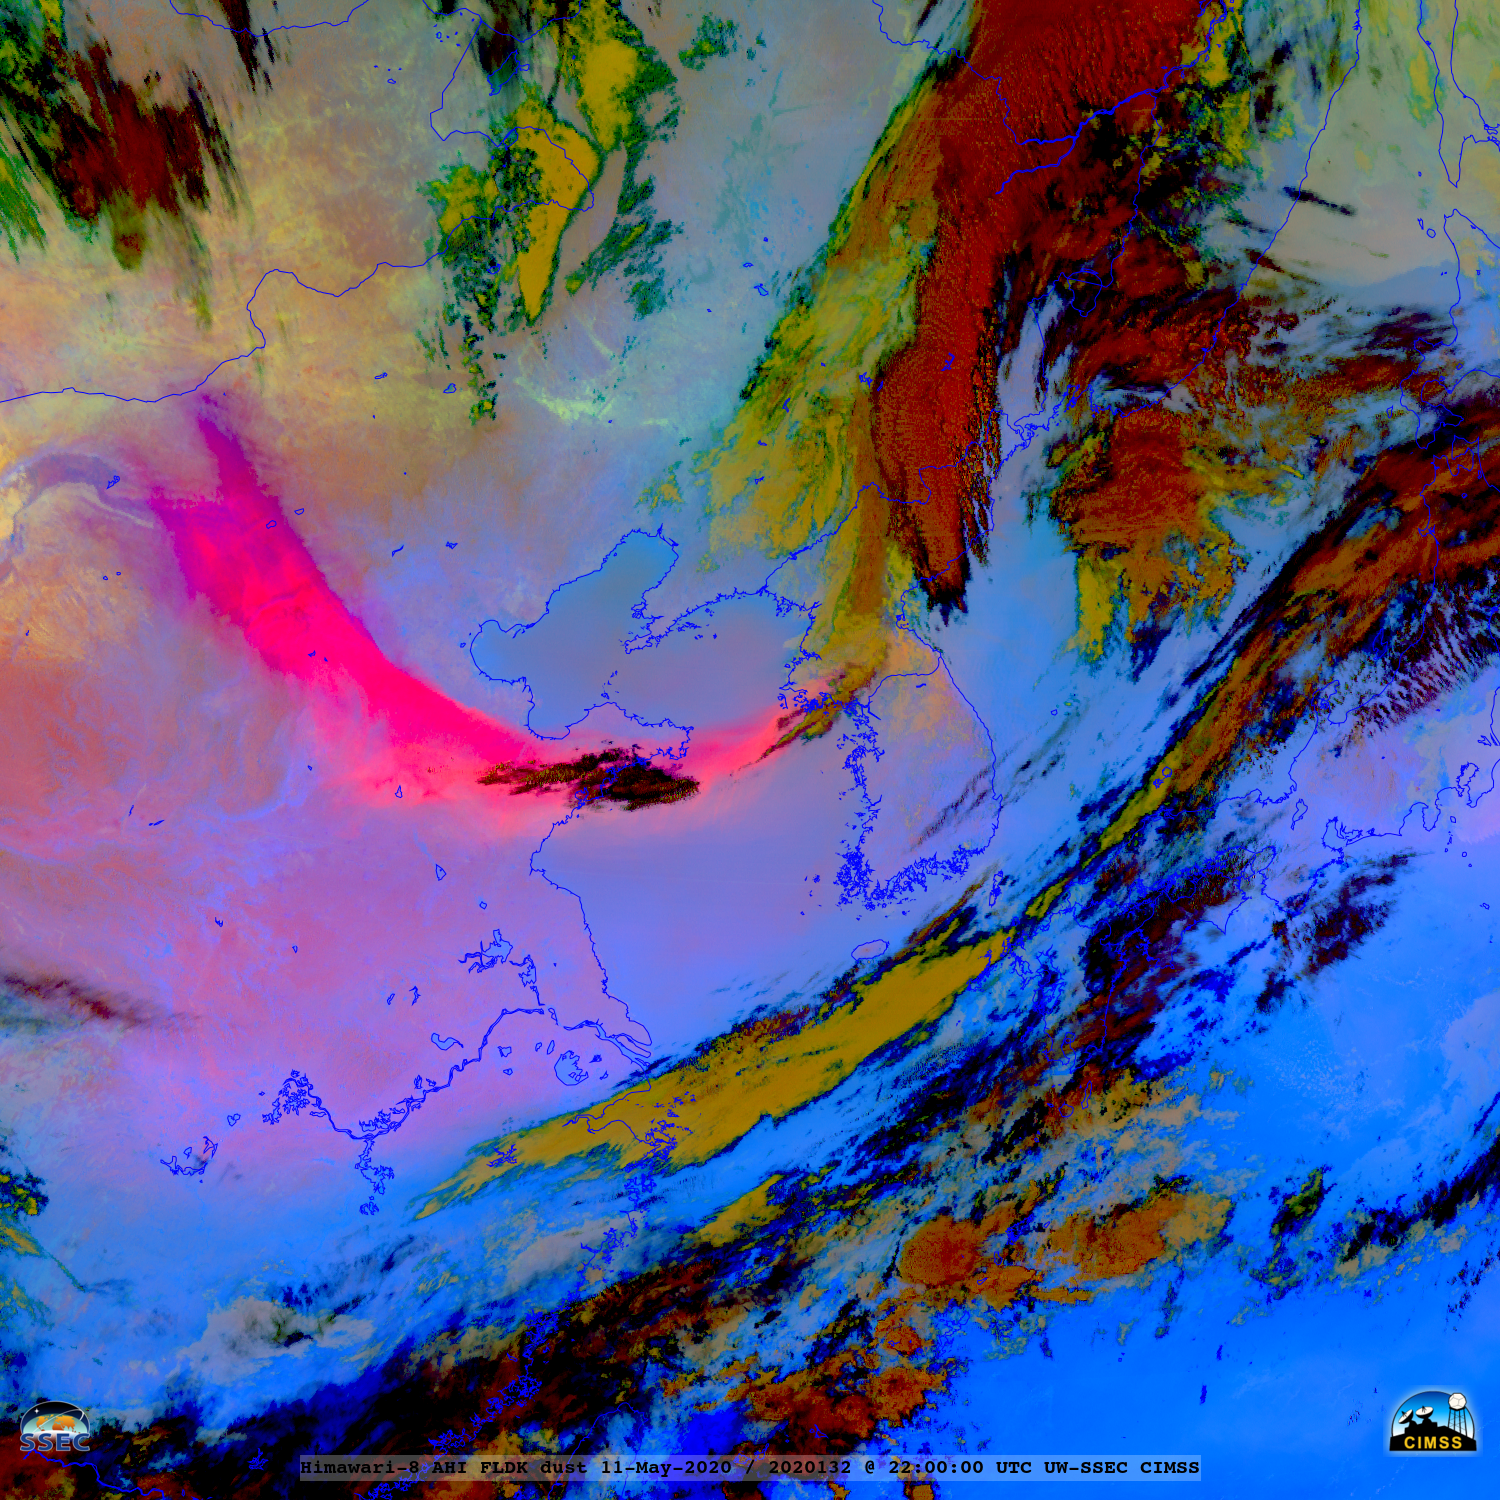
![Himawari-8 Dust RGB images [click to play animation | MP4]](https://cimss.ssec.wisc.edu/satellite-blog/images/2020/05/200511_200512_himawari8_dustRGB_Gobi_Desert_dust_plume_anim.gif)
![NOAA-20 VIIRS True Color RGB image, with plots of surface reports [click to enlarge]](https://cimss.ssec.wisc.edu/satellite-blog/images/2020/05/200512_04utc_noaa20_trueColorRGB_dust_plume.png)
![Time series of surface report data from Ulan-Bator, Mongolia [click to enlarge]](https://cimss.ssec.wisc.edu/satellite-blog/images/2020/05/200511_ZMUB_SFCMG.GIF)
![Time series of surface report data from Hohhot, China [click to enlarge]](https://cimss.ssec.wisc.edu/satellite-blog/images/2020/05/200511_200512_ZBHH_SFCMG.GIF)

![GOES-16 Low-level Water Vapor (7.34 µm) images [click to play animation | MP4]](https://cimss.ssec.wisc.edu/satellite-blog/images/2020/05/200512_goes16_waterVapor_TX_mcv_anim.gif)
![GOES-16 Mid-level Water Vapor (6.9 µm) images, with hourly surface weather type plotted in red (R=rain; S=snow; F=fog) [click to pay animation | MP4]](https://cimss.ssec.wisc.edu/satellite-blog/images/2020/05/200509_goes16_waterVapor_surfaceWeather_Upper_Midwest_anim.gif)
![GOES-16 Mid-level Water Vapor (6.9 µm) images, with plots of hourly wind barbs and gusts [click to pay animation | MP4]](https://cimss.ssec.wisc.edu/satellite-blog/images/2020/05/200509_goes16_waterVapor_surfaceWinds_Upper_Midwest_anim.gif)
![GOES-16 Day Cloud Phase Distinction RGB images [click to play animation | MP4]](https://cimss.ssec.wisc.edu/satellite-blog/images/2020/05/200509_goes16_dayCloudPhaseDistinction_SK_MB_ND_snowfall_swath_anim.gif)
![GOES-16 Day Cloud Phase Distinction RGB images [click to play animation | MP4]](https://cimss.ssec.wisc.edu/satellite-blog/images/2020/05/200510_goes16_dayCloudPhaseDistinction_WI_anim.gif)
