An ABI hot (bright) spot is not a fire when it’s a fleet of solar farms. For example, recall the CIMSS Satellite Blog entry regarding solar farms in California. Note how some reflections are so bright that the ABI reports dark surrounding pixels. This is part of the remapping process from detector to pixel... Read More
An ABI hot (bright) spot is not a fire when it’s a fleet of solar farms. For example, recall the CIMSS Satellite Blog entry regarding solar farms in California.
ABI band 2 visible animation on May 30, 2020 (mostly) in southeastern Minnesota. Click to play mp4.
Note how some reflections are so bright that the ABI reports dark surrounding pixels. This is part of the remapping process from detector to pixel space.
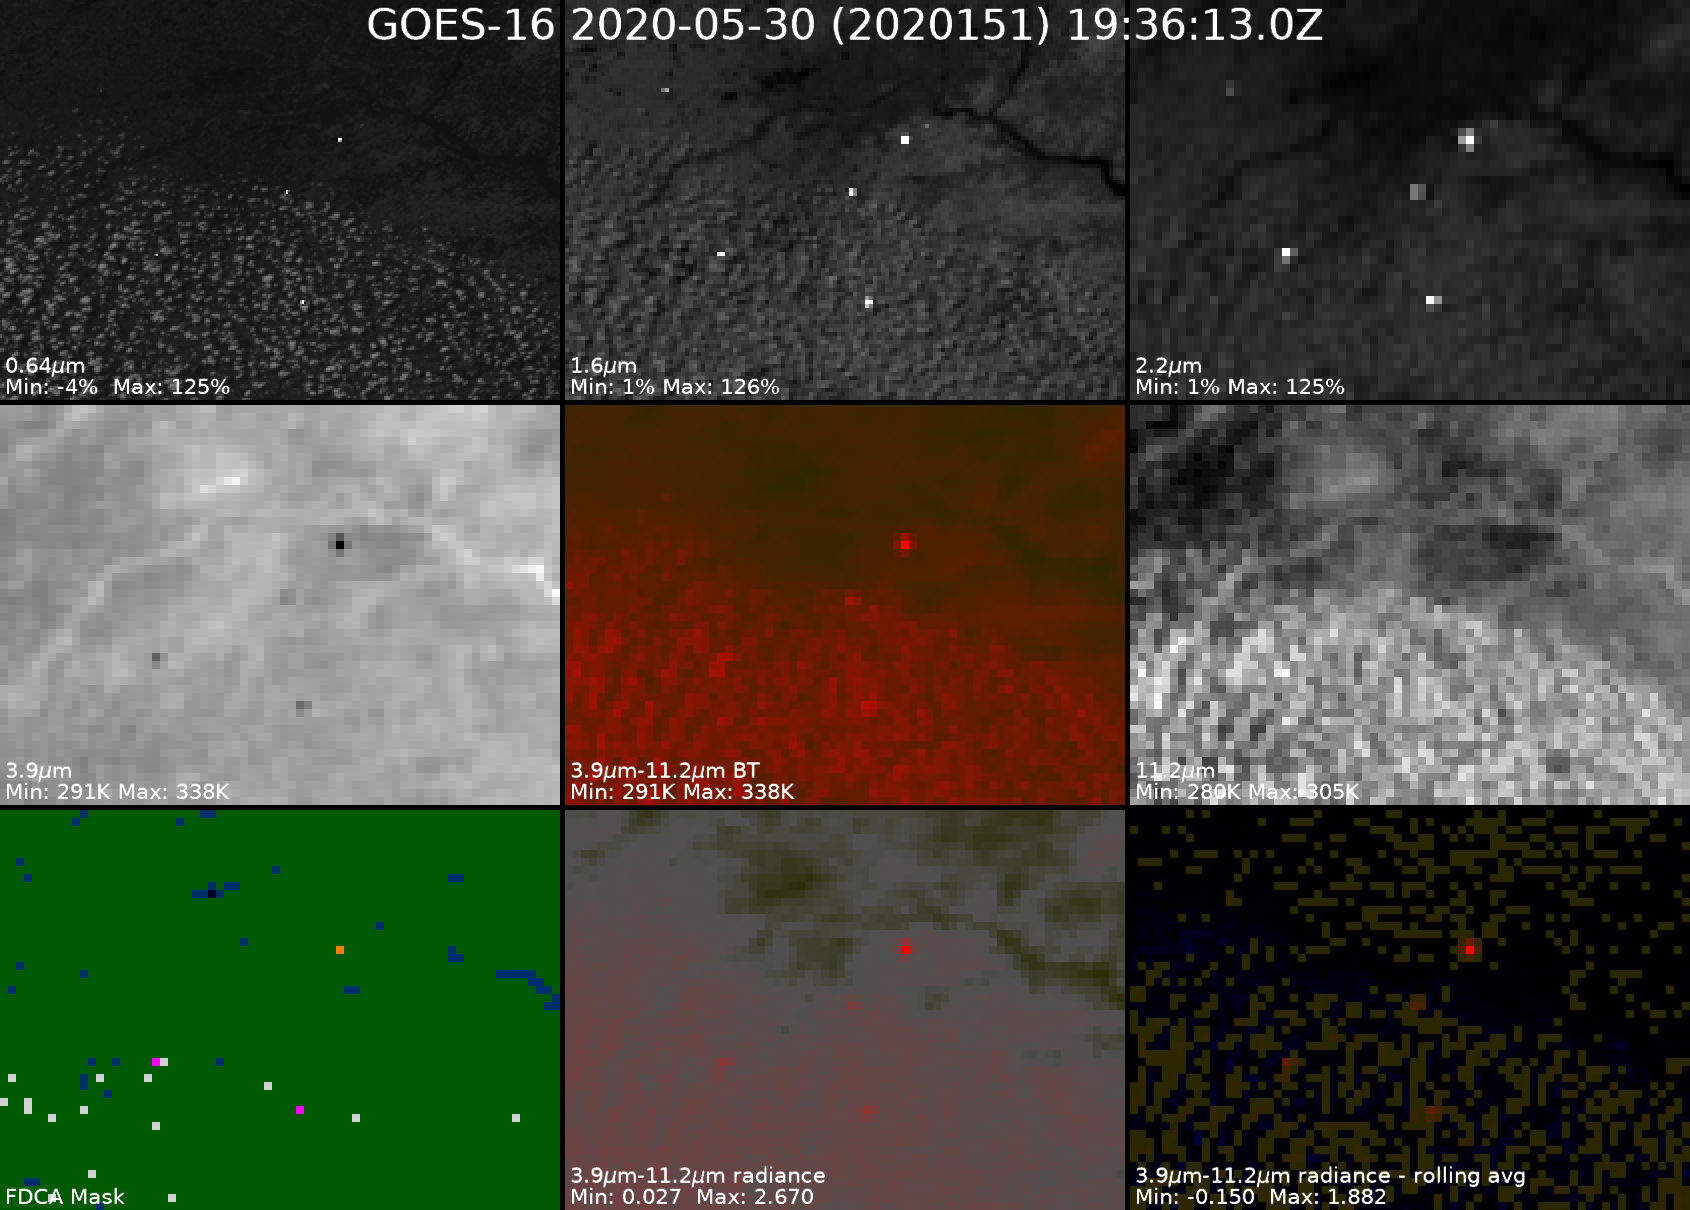
A multiple-spectral ABI comparison on May 30, 2020. The rows are: band 2, band 5, band 6 band 7, band 7 – 14 brightness temp, band 14 fire mask, band 7-14 radiance difference, band 7-14 radiance difference minus the rolling average
From left to right, top to bottom the panels are:
1) ABI band 2 reflectance, dynamically scaled to enhance contrast (will appear to flicker)
2) ABI band 5 reflectance, dynamically scaled to enhance contrast (will appear to flicker)
3) ABI band 6 reflectance, dynamically scaled to enhance contrast (will appear to flicker)
4) ABI band 7 brightness temperature, dynamically scaled to enhance contrast (will appear to flicker)
5) ABI band 7 minus band 14 brightness temperature. Red indicates positive values (extra thermal energy due to the sun and fires, if present), dynamically scaled to enhance contrast (will appear to flicker)
6) ABI band 14 brightness temperature, dynamically scaled to enhance contrast (will appear to flicker)
7) ABI Fire Detection and Characterization Algorithm (FDCA, aka WFABBA) fire detection metadata mask. Fires are red, orange, magenta, and shades of blue indicating different confidence levels. Green indicates fire-free land, shades of gray indicate clouds, dark blue indicates water.
8) Radiance difference of band 7 minus band 14 radiance in band 7 space. Red indicates positive values (extra thermal energy due to the sun and fires, if present), dynamically scaled to enhance contrast (will appear to flicker)
9) Radiance difference of band 7 minus band 14 radiance in band 7 space minus a rolling average of the 5 prior frames, to highlight changes. Red indicates positive values (extra thermal energy due to the sun and fires, if present), dynamically scaled to enhance contrast (will appear to flicker).
Aside from the solar farms, water clouds show up in the difference panels due to their reflection of shortwave radiation.
H/T to Chris Schmidt for the 9-panel ABI imagery. More about quantitative ABI products, including fire detection.
The original tweet from the La Crosse WFO: “We saw some awfully bright looking “clouds” showing up via satellite in southeast Minnesota earlier this afternoon. Well after some investigation, we were able to determine they were actually solar panel arrays that the sun was hitting just right!”
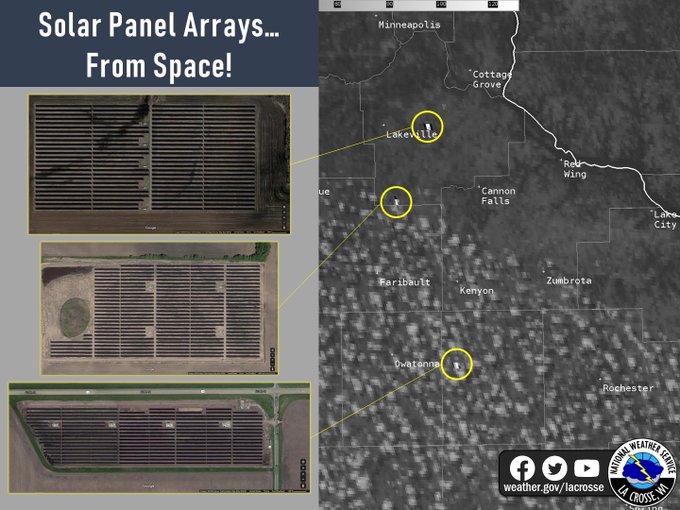
Solar farms and GOES-16 ABI visible imagery from the La Crosse NWS WFO.
View only this post
Read Less
![GOES-16 Low-level (7.3 µm, left), Mid-level (6.9 µm, center) and Upper-level (6.2 µm, left) Water Vapor images [click to play animation | MP4]](https://cimss.ssec.wisc.edu/satellite-blog/images/2020/05/200530_goes16_waterVapor_SpaceX_launch_anim.gif)
![GOES-16 Upper-level (6.2 µm) Water Vapor images [click to play animation | MP4]](https://cimss.ssec.wisc.edu/satellite-blog/images/2020/05/200530_goes16_waterVapor_SpaceX_rocket_thermal_signature_anim.gif)
![GOES-16 Shortwave Infrared (3.9 µm, left), Mid-level Water Vapor (6.9 µm, center) and Upper-level Water Vapor (6.2 µm, left) images [click to play animation | MP4]](https://cimss.ssec.wisc.edu/satellite-blog/images/2020/05/200530_goes16_shortwaveInfrared_waterVapor_SpaceX_launch_v2_anim.gif)
![GOES-16 Shortwave Infrared (3.9 µm) images [click to play animation | MP4]](https://cimss.ssec.wisc.edu/satellite-blog/images/2020/05/FALCON_loop_2020151_192150_2020151_192550.GIF)
![GOES-16 True Color RGGB images [click to play animation | MP4]](https://cimss.ssec.wisc.edu/satellite-blog/images/2020/05/200530_goes16_trueColorRGB_SpaceX_rocket_condensation_plume_anim.gif)
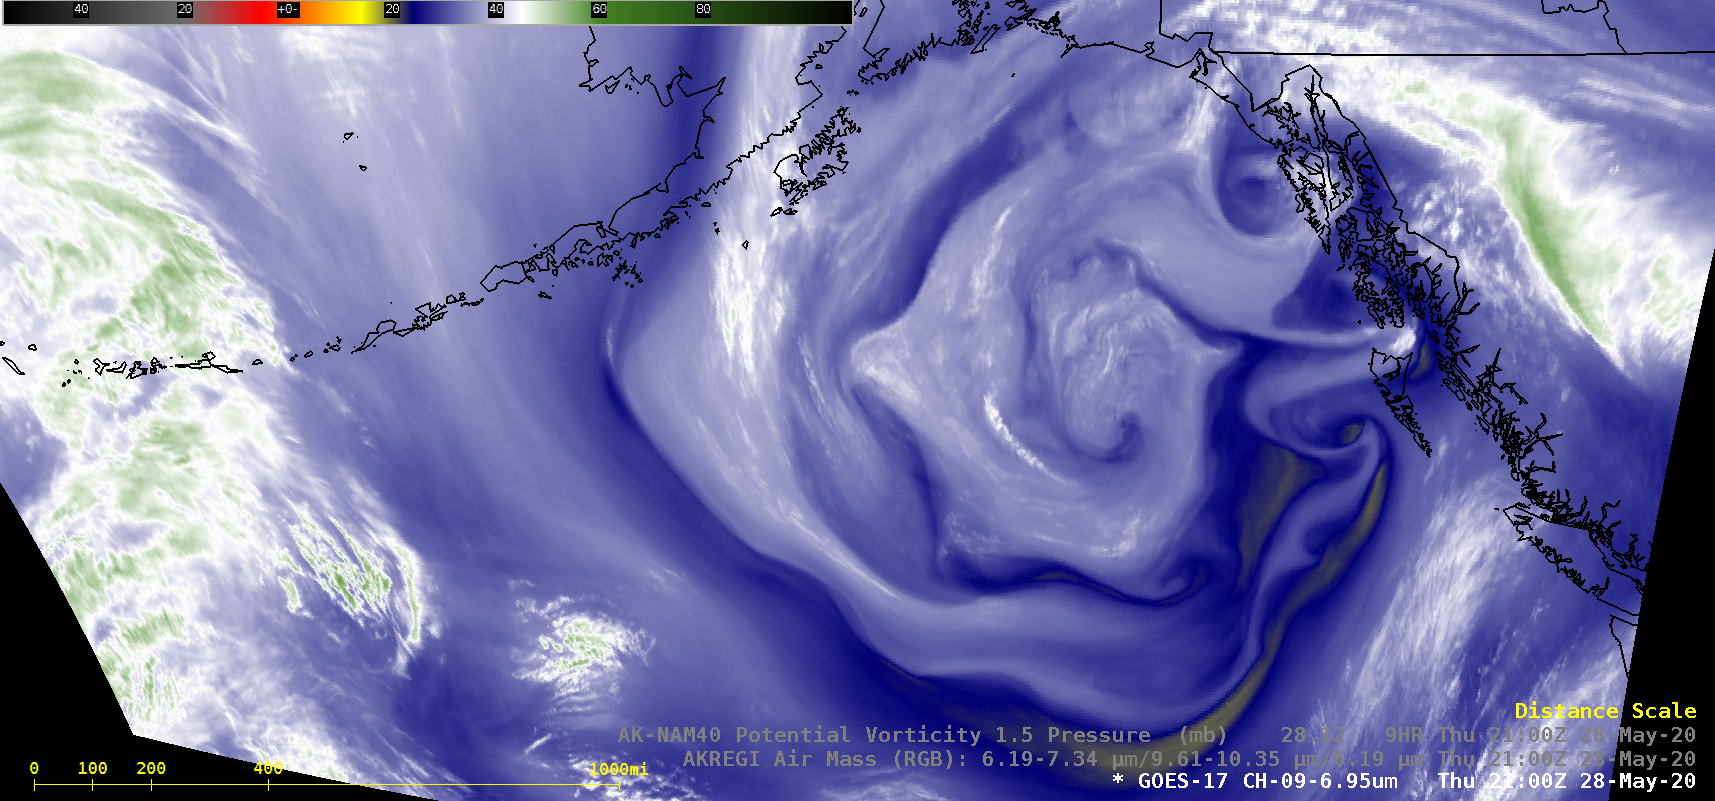
![GOES-17 Mid-level Water Vapor (6.9 µm), Air Mass RGB images (with and without an overlay of PV1.5 Pressure) [click to play animation | MP4]](https://cimss.ssec.wisc.edu/satellite-blog/images/2020/05/200528_goes17_waterVapor_airMassRGB_pv1.5pressure_Gulf_of_Alaska_anim.gif)
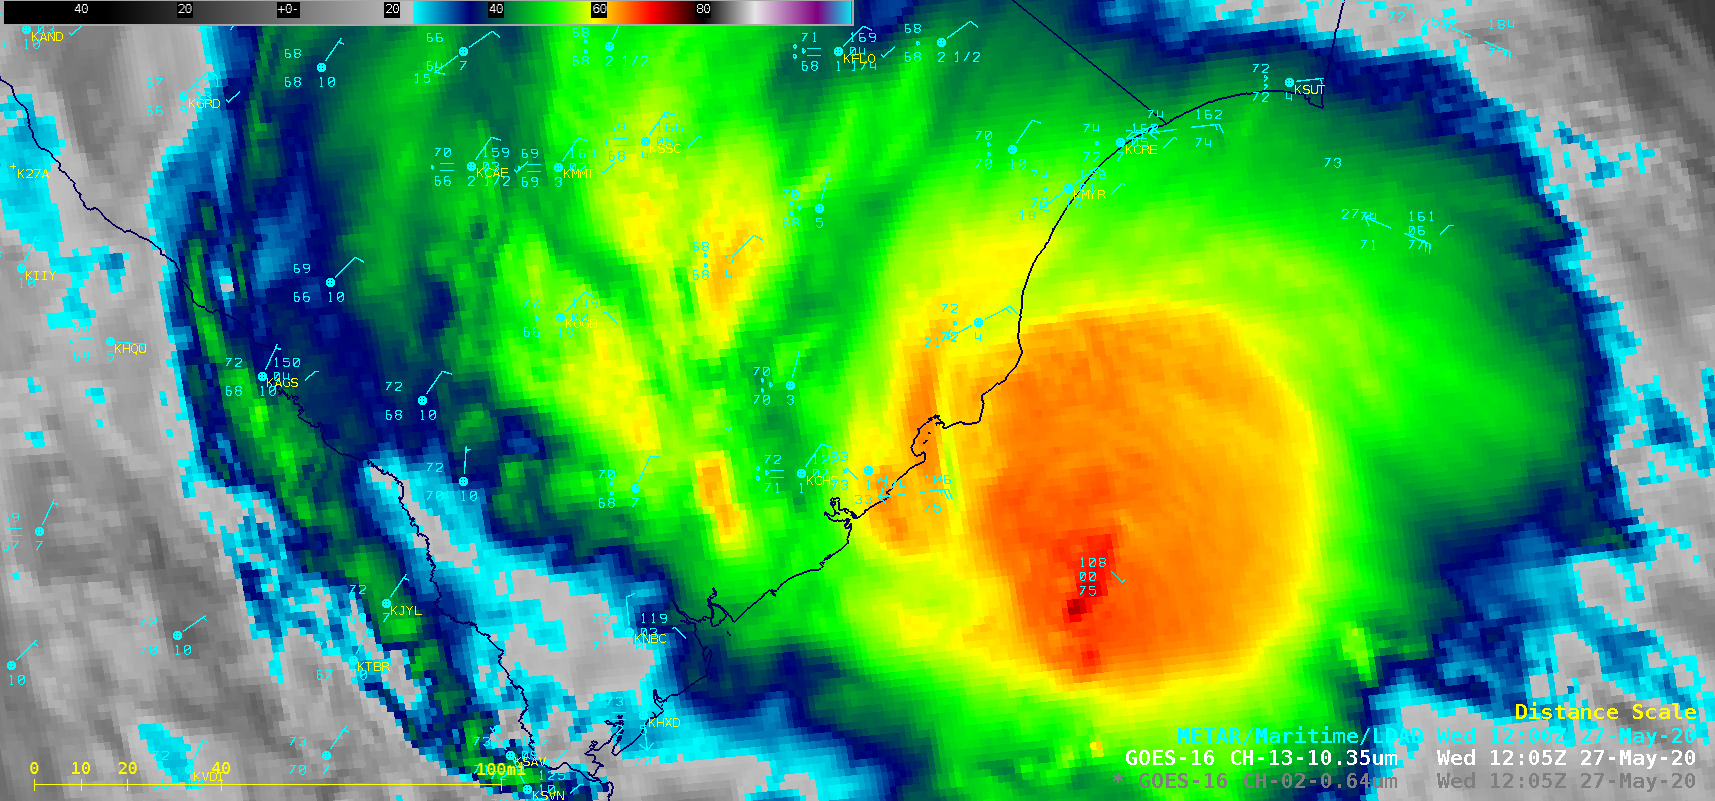
![GOES-16 “Red” Visible (0.64 µm) and “Clean” Infrared Window (10.35 µm) images [click to play animation | MP4]](https://cimss.ssec.wisc.edu/satellite-blog/images/2020/05/200527_goes16_visible_infrared_TS_Bertha_anim.gif)
![GMI Microwave (85 GHz) image at 1416 UTC [click to enlarge]](https://cimss.ssec.wisc.edu/satellite-blog/images/2020/05/200527_1416utc_gmi_microwave_Bertha.png)
