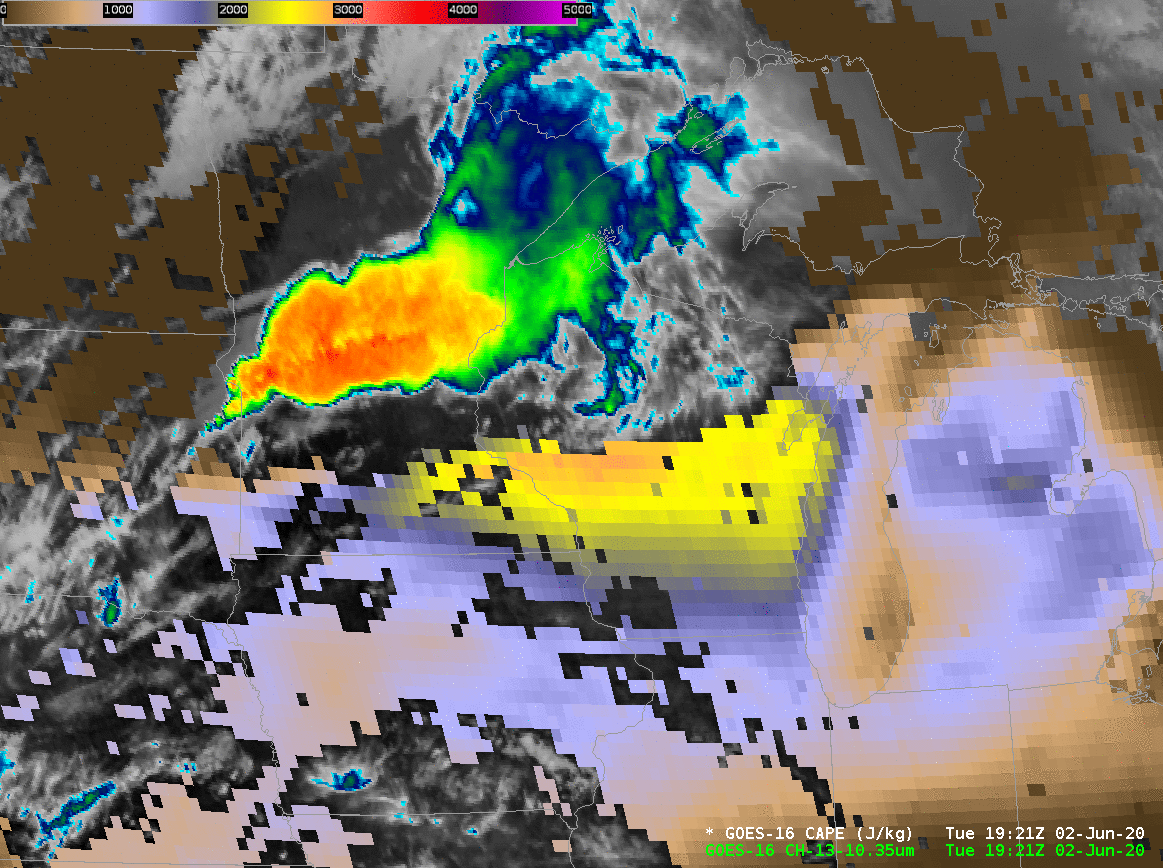
Severe weather occurred over Minnesota and Wisconsin on 2 June 2020, and the storms developed in clear skies. This allowed GOES-16 Derived Stability Indices (a clear-sky product) to provide information on the near-storm environment. The animation above combines GOES-16 Clean Window infrared (10.3 µm) imagery (where clouds exist) with Convective Available Potential Energy (CAPE) estimated from GOES-16... Read More
GOES-16 ABI Band 13 (10.3 µm) imagery and clear-sky estimates of Convective Available Potential Energy (CAPE), 1921-2146 UTC (Click to enlarge)
Severe weather occurred over Minnesota and Wisconsin on 2 June 2020, and the storms developed in clear skies. This allowed GOES-16 Derived Stability Indices (a clear-sky product) to provide information on the near-storm environment. The animation above combines GOES-16 Clean Window infrared (10.3 µm) imagery (where clouds exist) with Convective Available Potential Energy (CAPE) estimated from GOES-16 Advanced Baseline Imager channel information (that adjusts an initial field created using GFS data); this Baseline product (and others including all-sky products) can be found online here). Strong convection over Minnesota at this time was supported in part by instability diagnosed to its south.
Note how, south of the main convection, a second line of convection initiated over southern Minnesota at around 2030 UTC, along the northern edge of the diagnosed CAPE maximum. When do you think lightning initiated with this second line of convection? What imagery/products will help in that assessment?
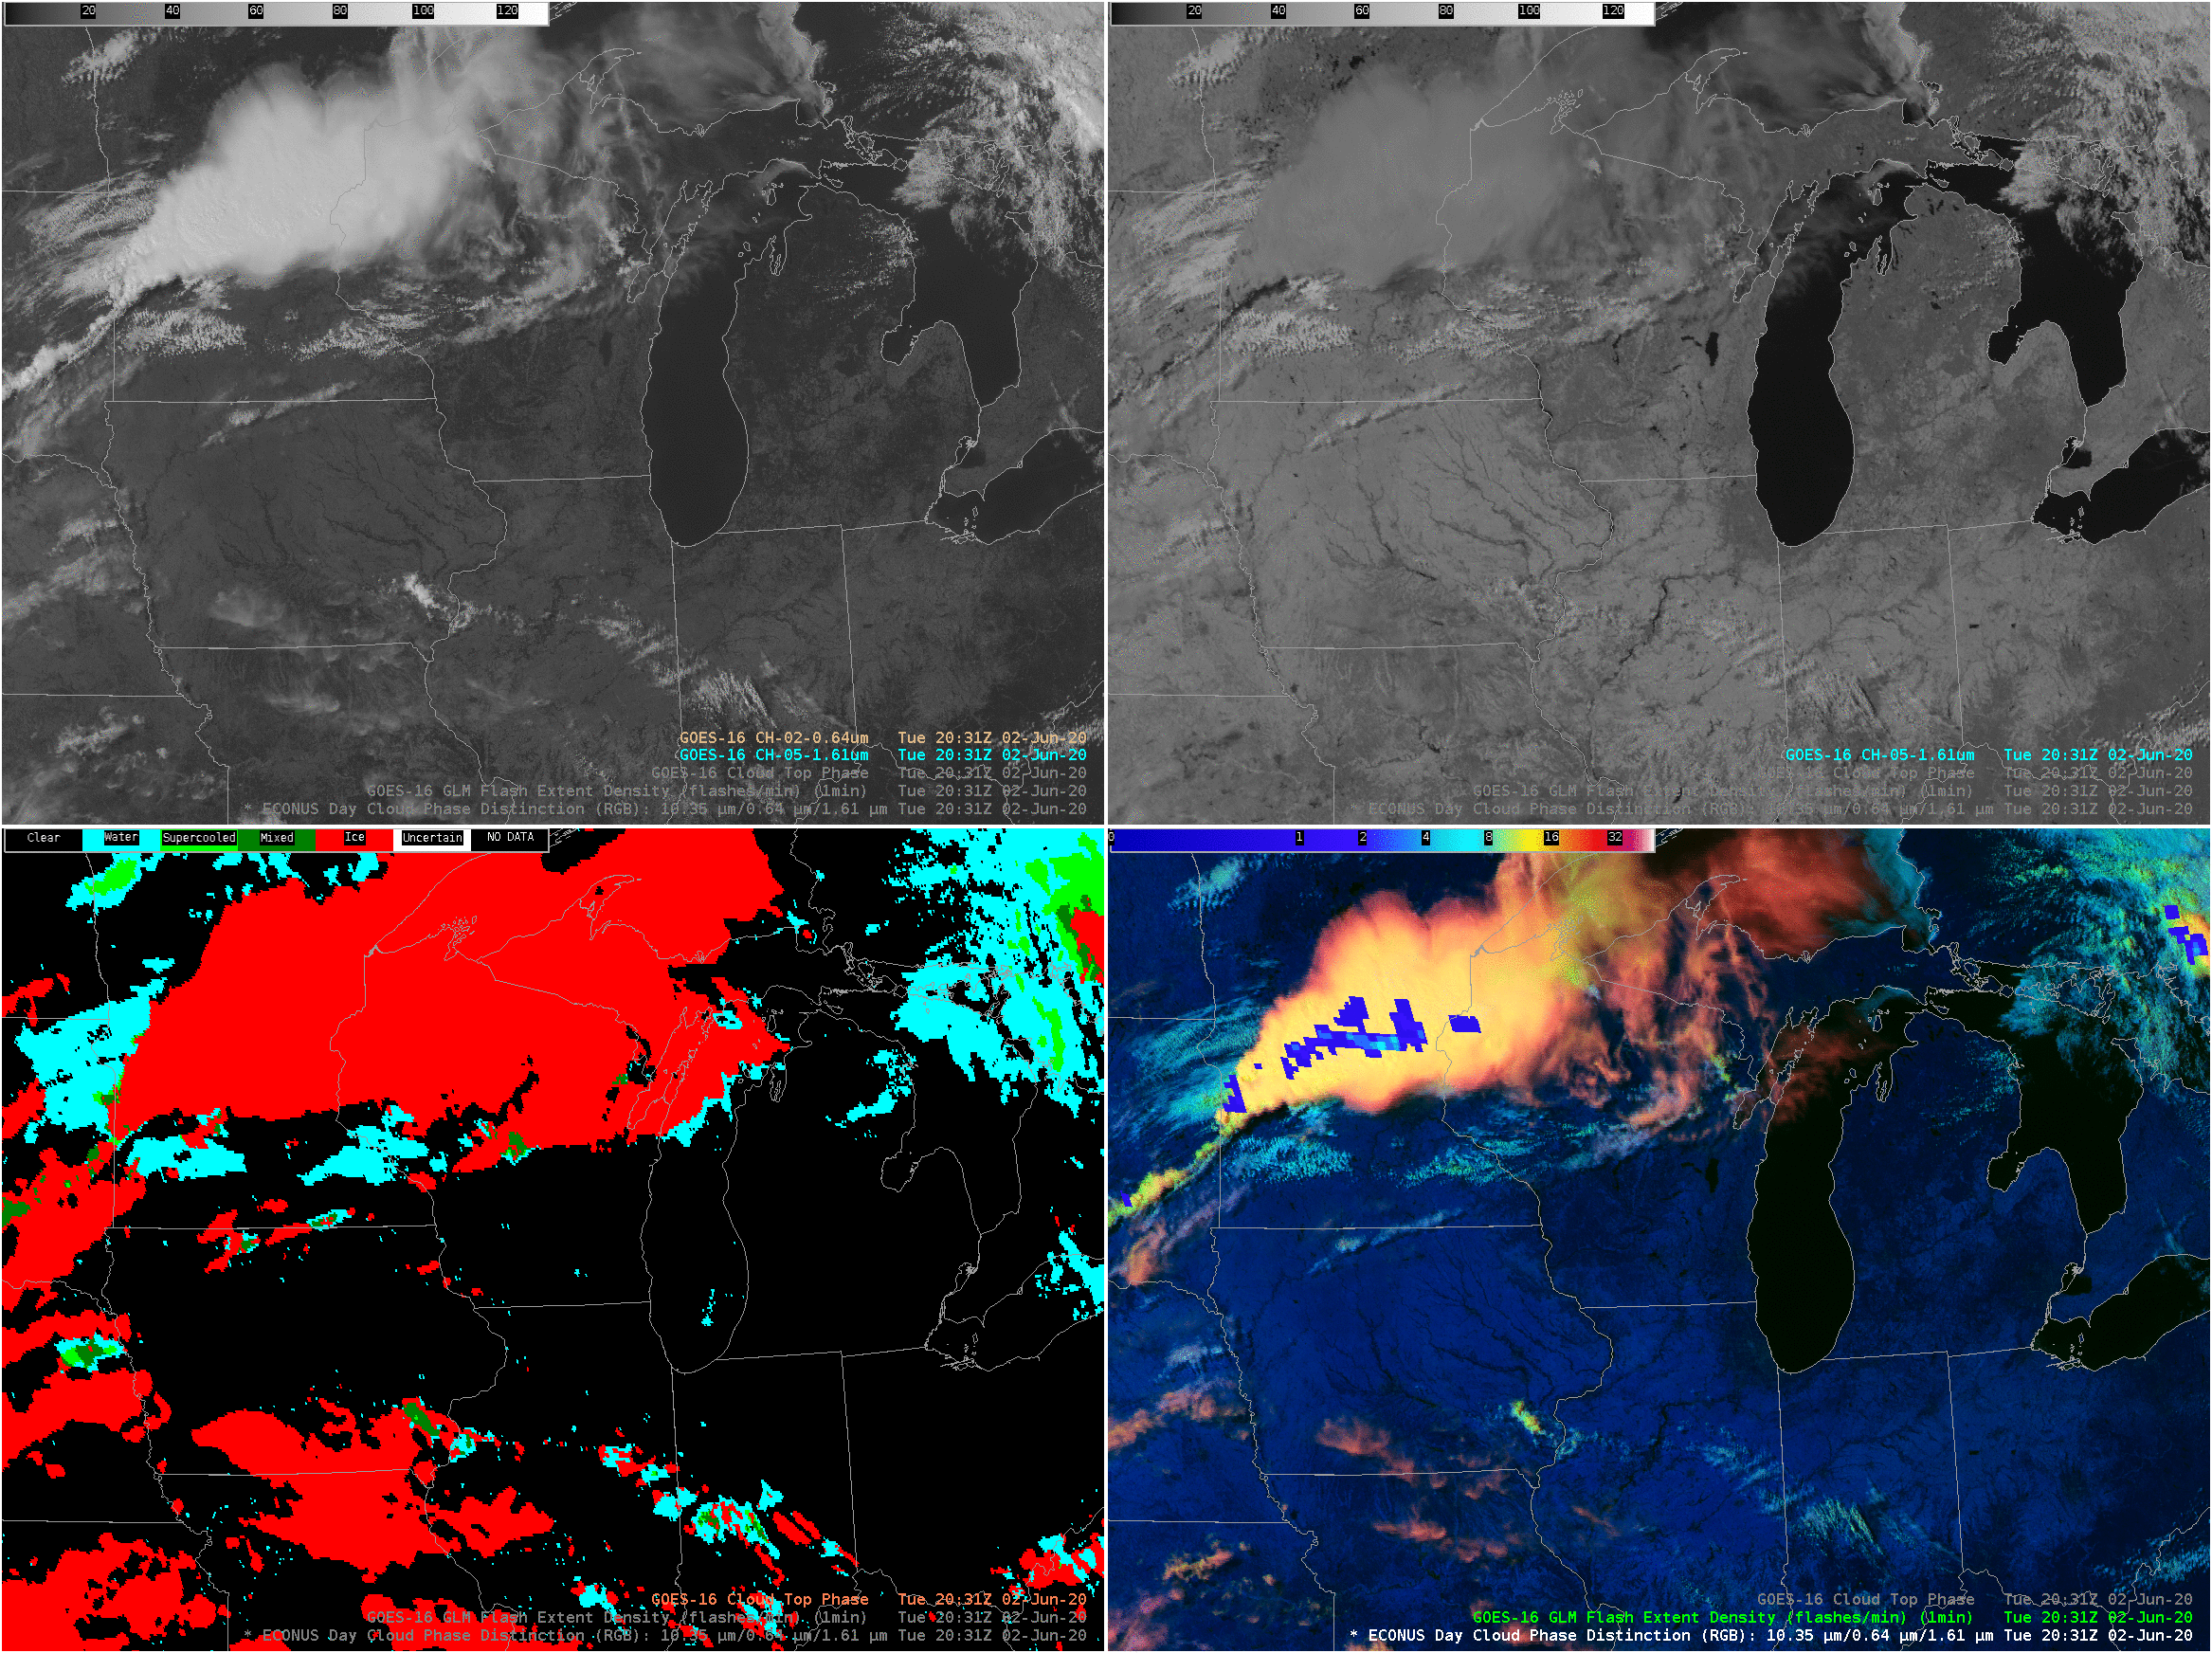
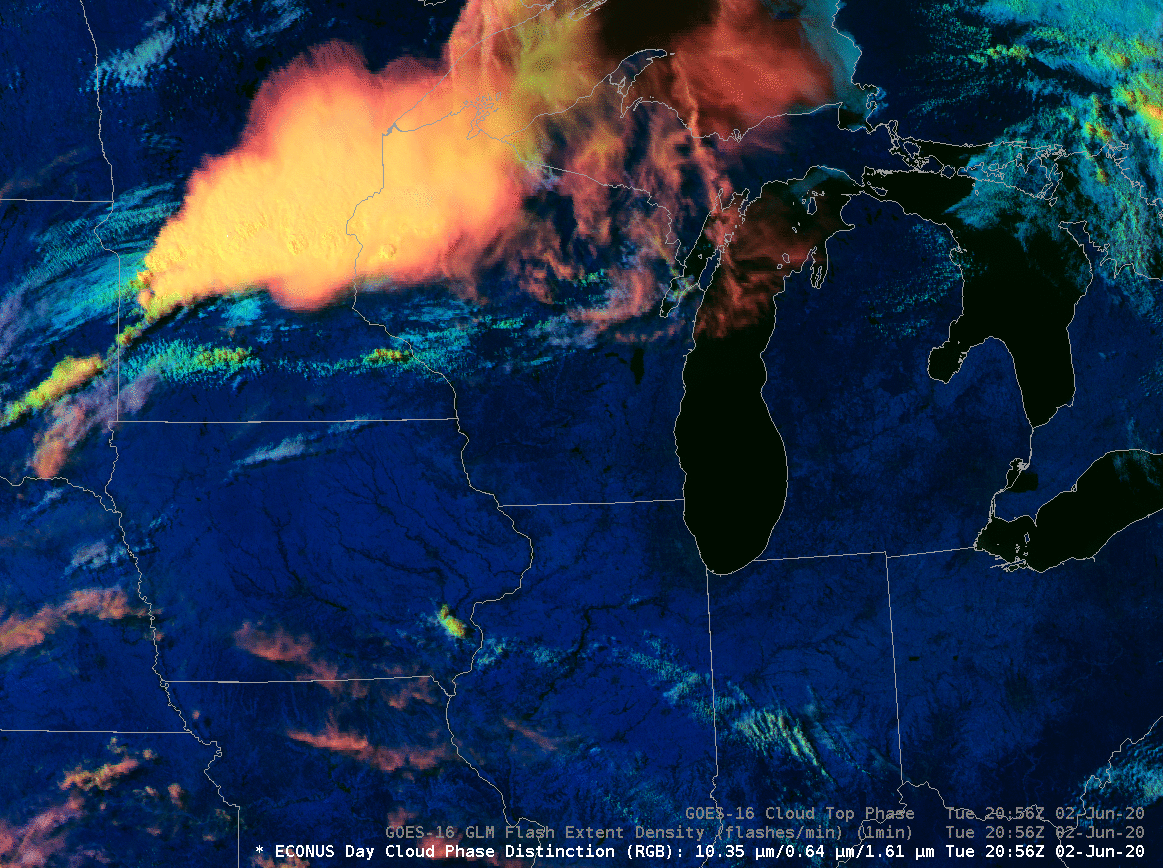
The 4-panel animation, below, shows the initiation of convection in the southern line, from 2031 to 2101 UTC. The developing convection is fairly bright in the Snow/Ice channel initially, consistent with the presence of clouds made up of water droplets. The Cloud Phase product shows water (or supercooled water) at these times, and the Day Cloud Phase Distinction color of the clouds is mostly greenish.
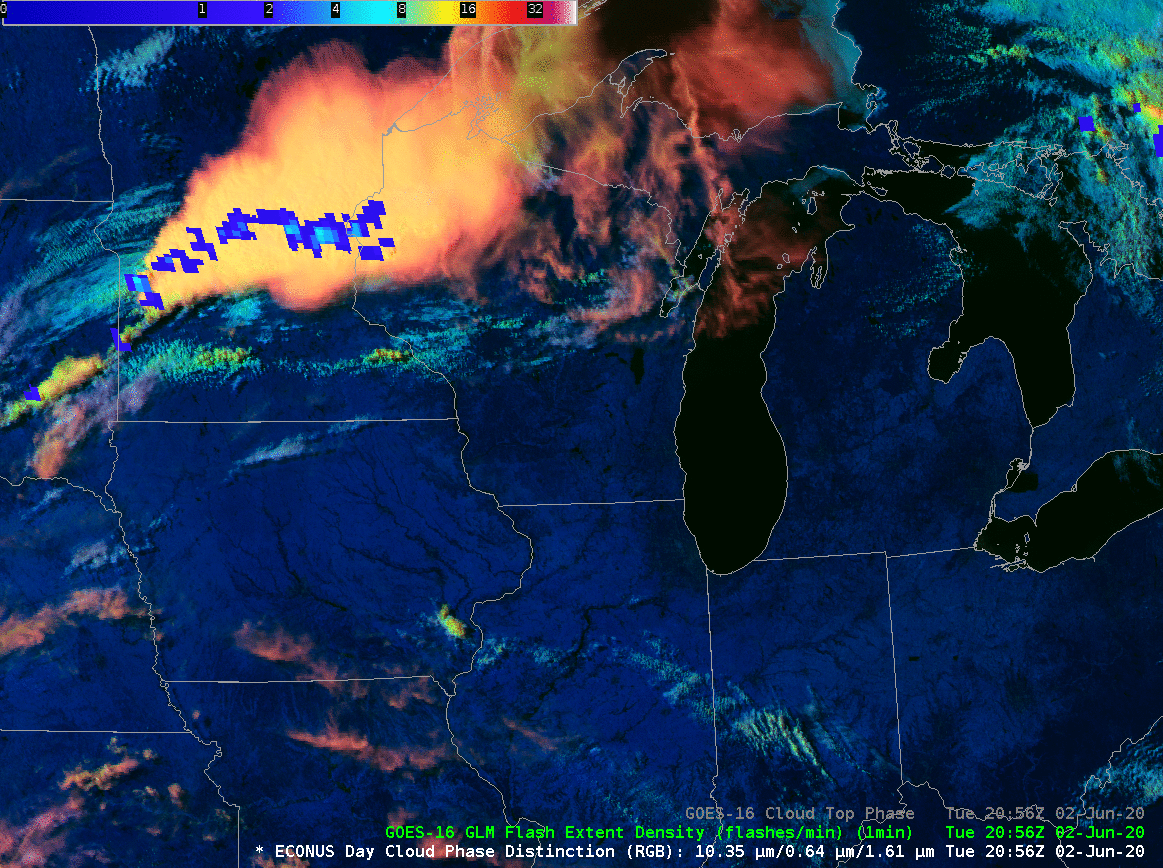
As glaciation occurs, the clouds in the Snow/Ice channel become darker: ice absorbs (rather than reflects) energy at 1.61 µm so less is detected by the satellite. The change in the 1.61 µm channel reduces the amount of blue in the Day Cloud Phase Distinction RGB (so pixels acquire a yellow or red hue), and the Cloud Phase product also detects mixed phase and ice clouds. Once the glaciation has occurred, lightning production is more likely, and at 2101 UTC, the GLM detects lightning activity. (Here is the 2101 UTC Day Cloud Phase Distinction image without GLM overlain; here are toggles between 2056 and 2101 UTC without and with GLM overlain; a toggle between the 2056 and 2101 UTC Cloud Phase product is here; ice is present at 2056 UTC (and actually at 2051 UTC!) but more widespread at 2101 UTC). Of course, a 1-minute mesoscale sector could give even better temporal resolution of cloud phase changes than CONUS scans’ 5-minute time steps.
GOES-16 ABI Band 2 Visible (0.64 µm, upper left), the Band 5 “Snow/Ice” channel (1.61 µm, upper right), the derived level 2 Cloud Phase Product (lower left), and the Day Cloud Phase Distinction Red/Green/Blue Composite (with GLM observations of Flash Extent Density, lower right) from 2031 to 2101 UTC
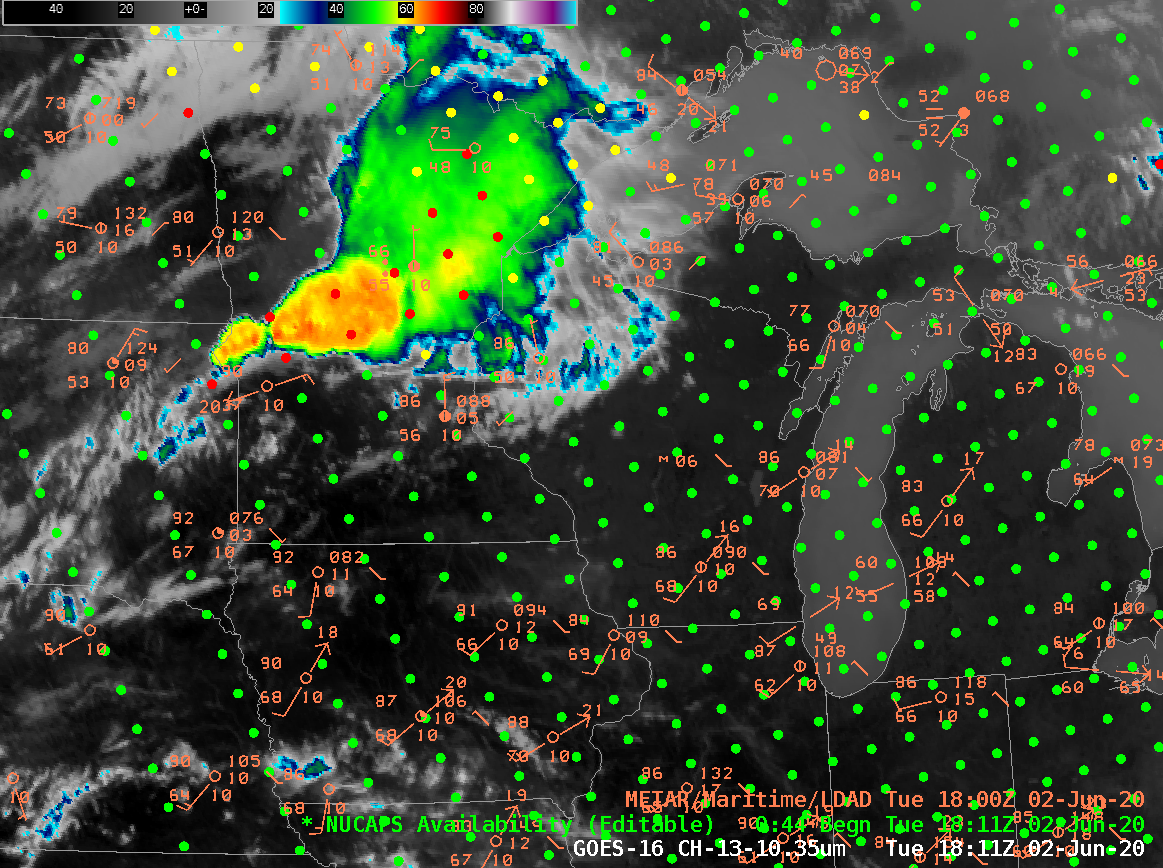
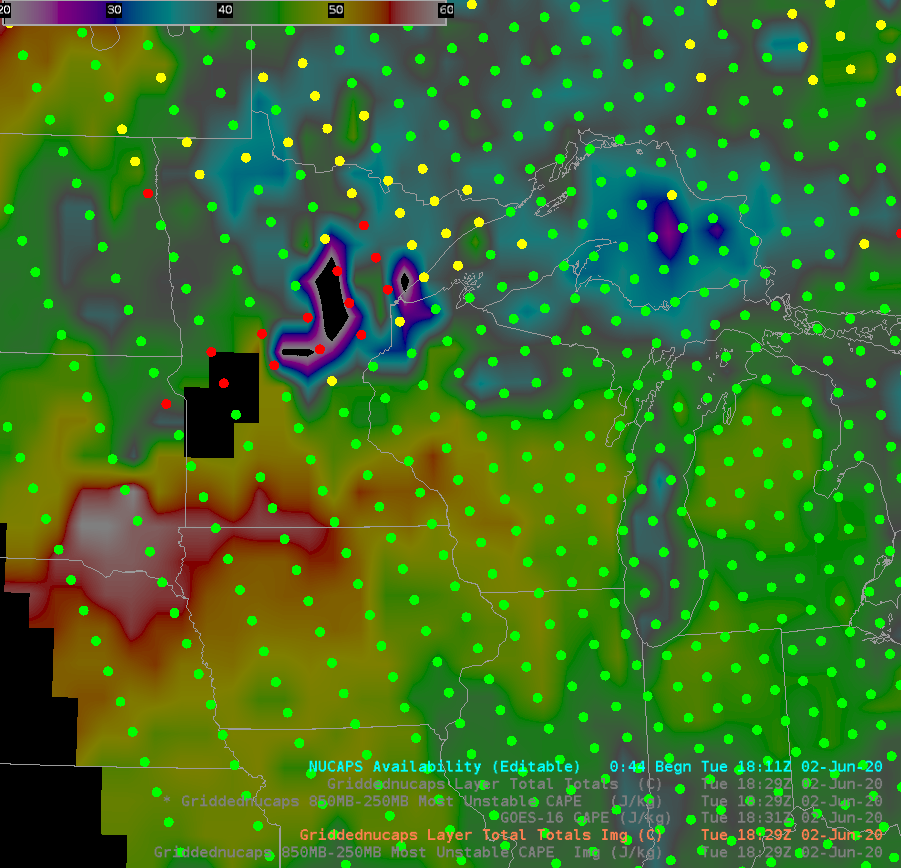
NOAA-20 overflew this region shortly after noon on 2 June, and the thermodynamic information from the infrared and microwave sounder instruments on board can be used to diagnose instability. The toggle below compares the total totals index computed from gridded NUCAPS data with the GOES-16 clear-sky estimates of CAPE.
Both measures of instability agree that the region of instability is narrow, and that its axis extends from central Wisconsin west-southwestward to southwest Minnesota and southeast South Dakota.

GOES-16 Derived Convective Available Potential Energy and Gridded NUCAPS field of total totals index, ca. 1830 UTC on 2 June 2020 (Click to enlarge)
Gridded NUCAPS fields are created from soundings that may or may not have converged (that is, from points displayed in AWIPS as green — infrared and microwave retrievals converged), yellow (infrared retrieval failed, microwave retrieval converged) or red (infrared and microwave retrievals failed)). The image below shows surface observations with the G16 Clean Window (10.3 µm) overlain with NUCAPS Sounding Points (This figure shows the total totals index overlain with the NUCAPS sounding points). As expected because of the clear skies, most of the NUCAPS Soundings south of the convection show both infrared and microwave retrieval convergence: dots are green.
GOES-16 Clean Window (Band 13, 10.3 µm) infrared imagery, surface observations, and NUCAPS Sounding observation points, 1831 UTC on 2 June 2020 (Click to enlarge)
NUCAPS data that is gridded can include effects that are related to how well (or how poorly) a NUCAPS sounding observes and estimates the boundary layer. The sounding below is from a ‘green’ point in extreme south-central Minnesota (to the northeast of the observation plotted at Spencer Iowa). Surface dewpoints are observed in the mid-60s; however, the original NUCAPS sounding, shown below, shows a dewpoint near 60. When the lower-tropospheric dewpoints values are increased towards more representative values, estimated MLCAPE and MUCAPE as reported in the NSharp readout in AWIPS increase as well, from 2466 to 3404, and from 2635 to 3630, respectively. When using gridded NUCAPS estimates of thermodynamic variables that include surface or near-surface variables, consider just how well the NUCAPS soundings can observe that part of the troposphere.

NUCAPS Sounding, original and modified, at 43.78 N, 94.73 W at ~1800 UTC on 2 June 2020 (Click to enlarge)
![GOES-16 “Red” Visible (0.64 µm) images, with SPC Storm Reports plotted in red [click to play animation | MP4]](https://cimss.ssec.wisc.edu/satellite-blog/images/2020/06/G16_VIS_MN_WI_02JUN2020_B2_2020154_222951_GOES-16_0001PANEL_FRAME00330.GIF)
GOES-16 “Red” Visible (0.64 µm) images, with SPC Storm Reports plotted in red [click to play animation | MP4]
1-minute
Mesoscale Domain Sector GOES-16 “Red” Visible (
0.64 µm) images with time-matched plots of
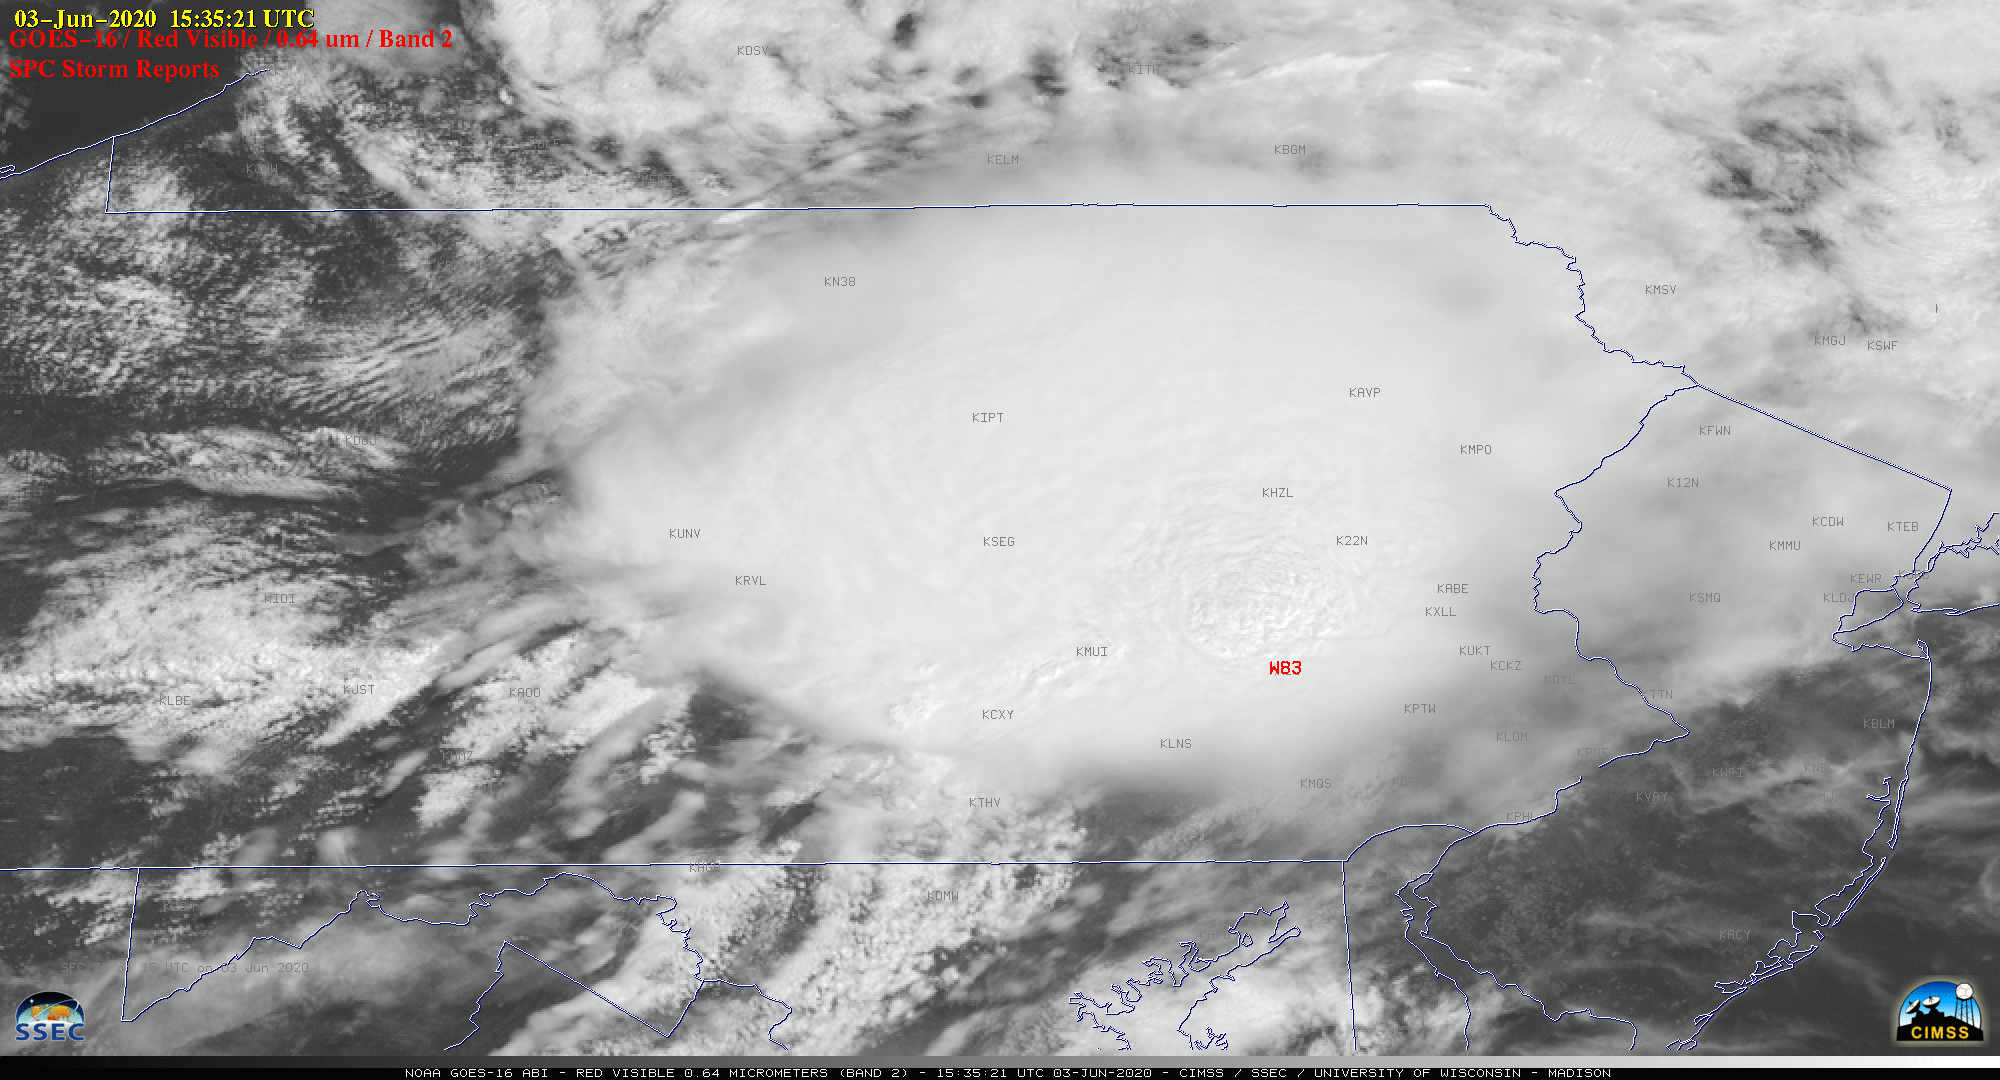
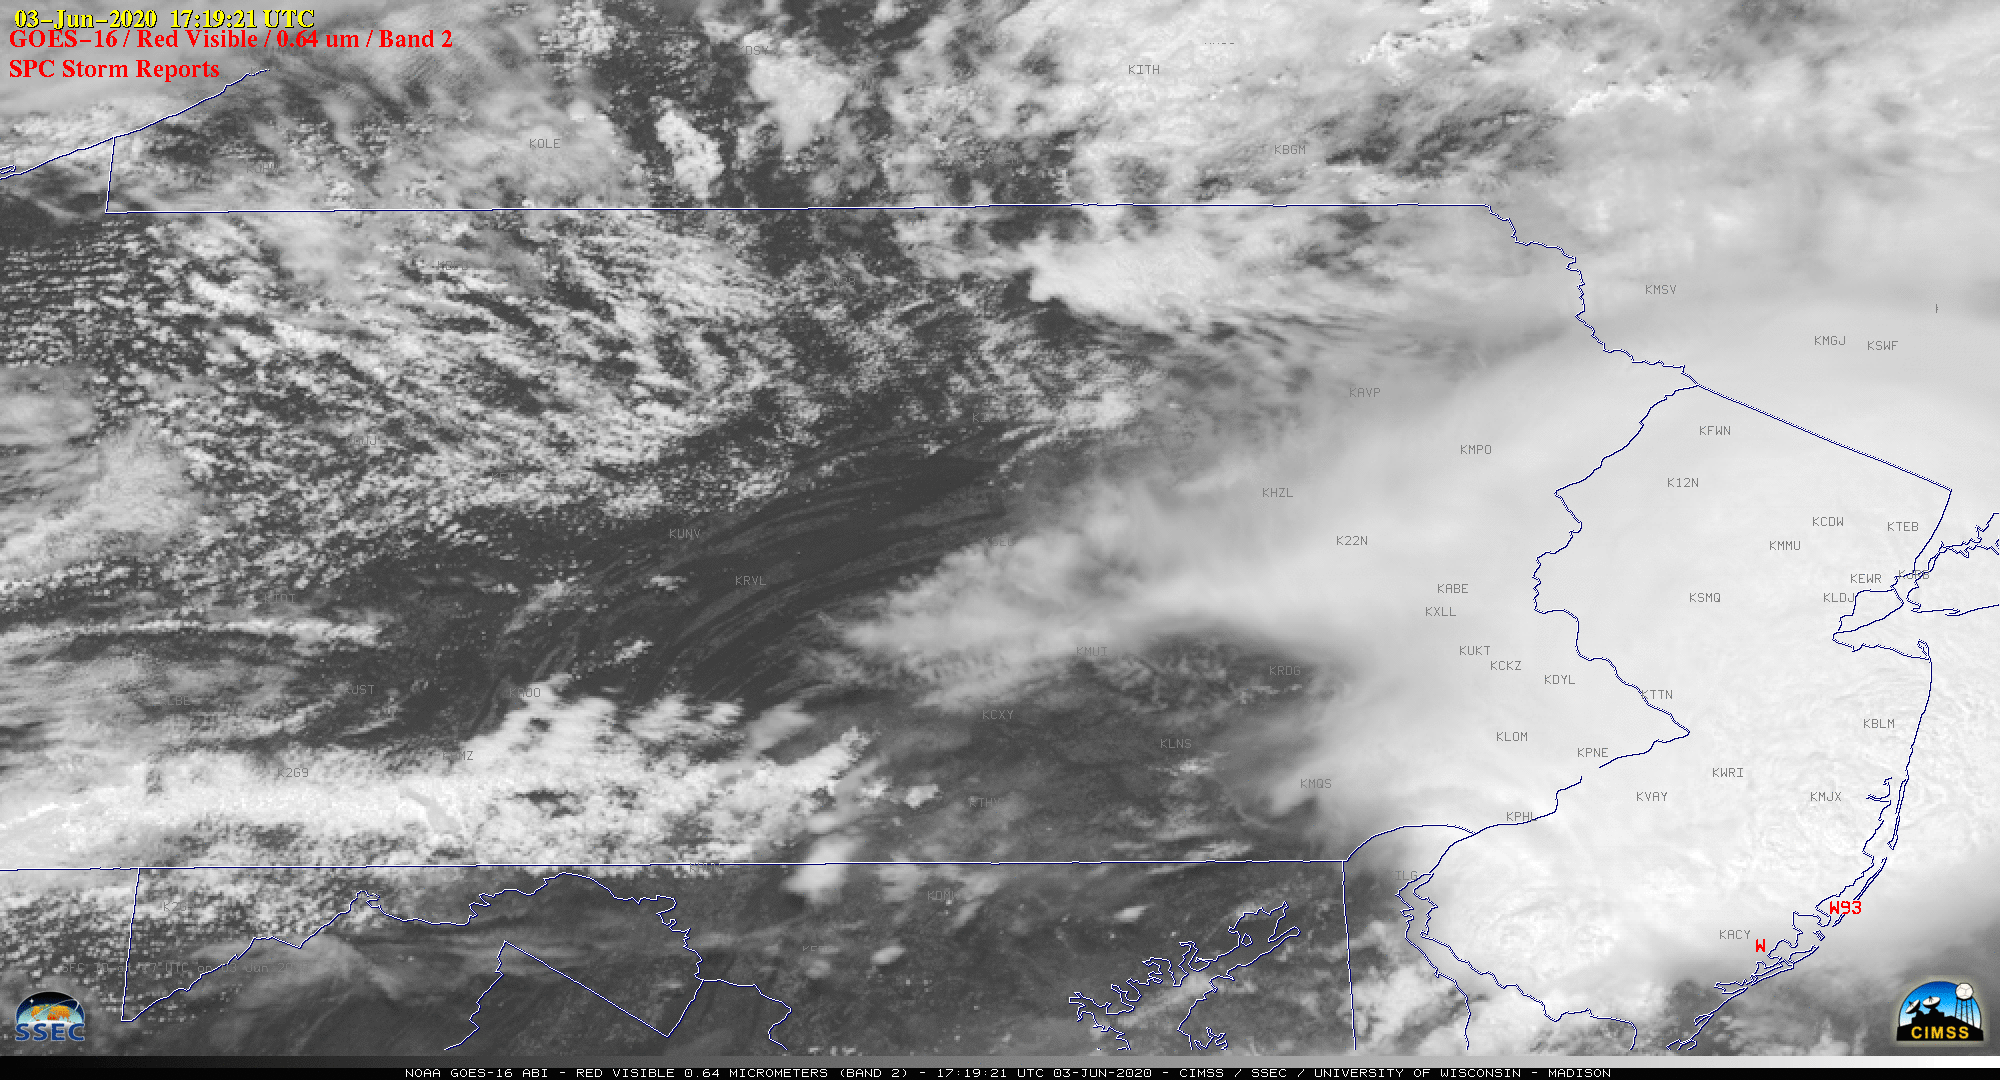
SPC Storm Reports (above) showed the development of these storms during the 1700-0112 UTC period.
The corresponding GOES-16 “Clean” Infrared Window (10.35 µm) images (below) revealed pulsing overshooting tops which exhibited cloud-top infrared brightness temperatures in the -70 to -79ºC range (darker black to brighter shades of white). Evidence of Above-Anvil Cirrus Plumes (reference | VISIT training) was seen in the Visible and Infrared imagery.
![GOES-16 “Clean” Infrared Window (10.35 µm) images, with SPC storm reports plotted in cyan [click to play animation | MP4]](https://cimss.ssec.wisc.edu/satellite-blog/images/2020/06/G16_IR_MN_WI_02JUN2020_B13_2020154_222951_GOES-16_0001PANEL_FRAME00330.GIF)
GOES-16 “Clean” Infrared Window (10.35 µm) images, with SPC storm reports plotted in cyan [click to play animation | MP4]
View only this post
Read Less
![GOES-16 “Red” Visible (0.64 µm) images, with SPC Storm Reports plotted in red [click to play animation | MP4]](https://cimss.ssec.wisc.edu/satellite-blog/images/2020/06/200603_goes16_visible_spcStormReports_PA_NJ_derecho_anim.gif)

![GOES-16 “Red” Visible (0.64 µm) images, with SPC Storm Reports plotted in red [click to play animation | MP4]](https://cimss.ssec.wisc.edu/satellite-blog/images/2020/06/200602_goes16_visible_spcStormReports_MN_WI_anim.gif)
![GOES-16 “Clean” Infrared Window (10.35 µm) images, with SPC storm reports plotted in cyan [click to play animation | MP4]](https://cimss.ssec.wisc.edu/satellite-blog/images/2020/06/200602_goes16_infrared_spcStormReports_MN_WI_anim.gif)
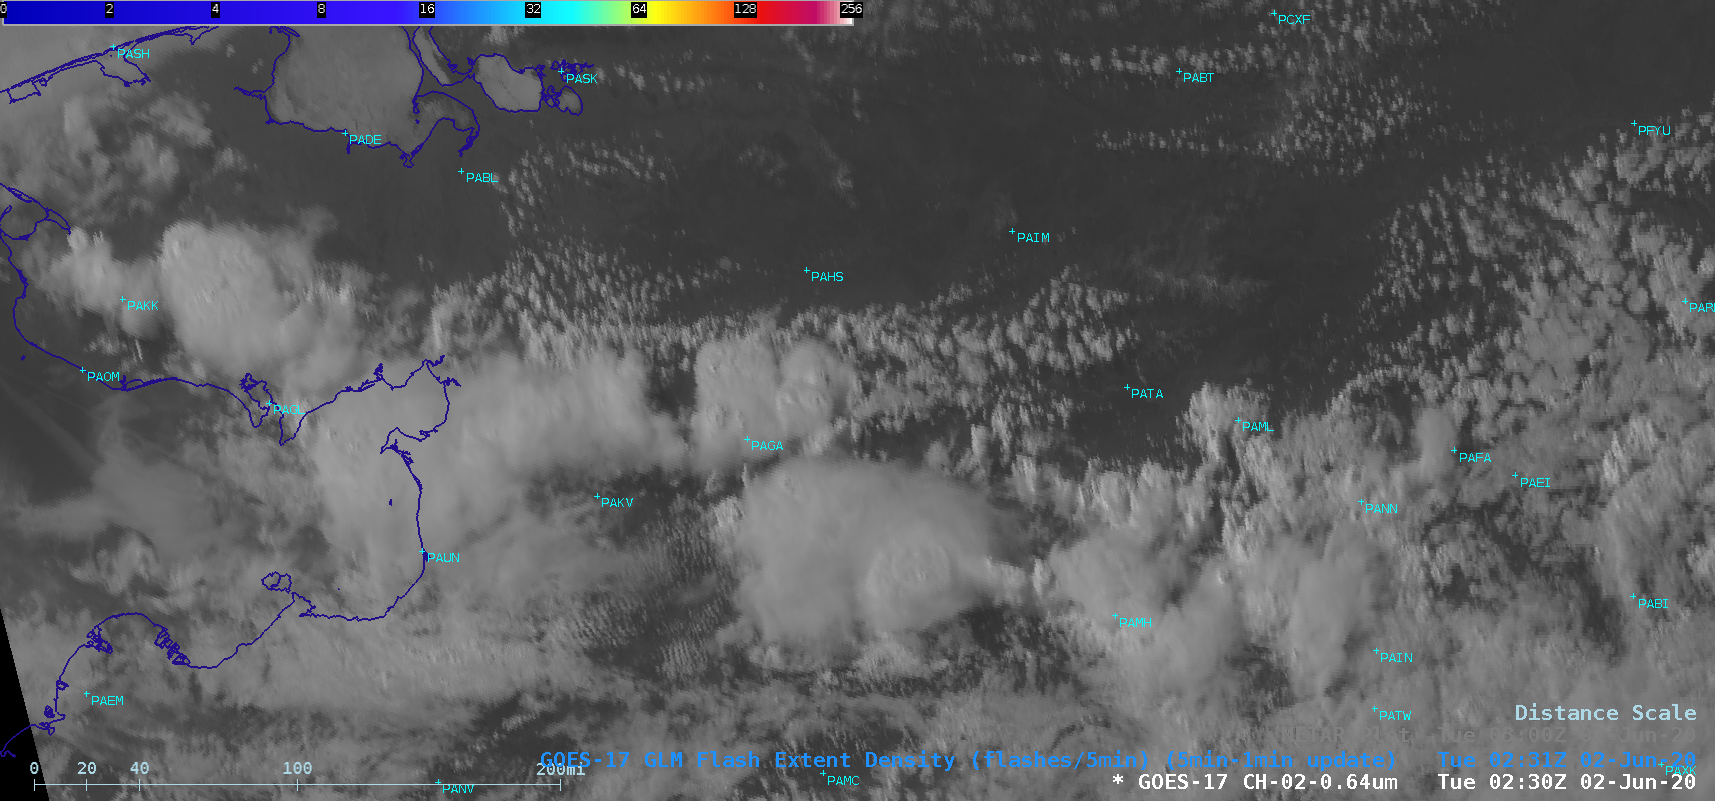

![GOES-17 "Red" Visible (0.64 µm) images [click to play animation | MP4]](https://cimss.ssec.wisc.edu/satellite-blog/images/2020/06/200601_goes17_infrared_AK_anim.gif)
![Suomi NPP VIIRS Visible (0.64 µm) and Infrared Window (11.45 µm) images at 2123 UTC [click to enlarge]](https://cimss.ssec.wisc.edu/satellite-blog/images/2020/06/200601_2123utc_suomiNPP_viirs_visible_infrared_AK_anim.gif)
![Suomi NPP VIIRS Visible (0.64 µm) and Infrared Window (11.45 µm) images at 2306 UTC [click to enlarge]](https://cimss.ssec.wisc.edu/satellite-blog/images/2020/06/200601_2306utc_suomiNPP_viirs_visible_infrared_AK_anim.gif)
