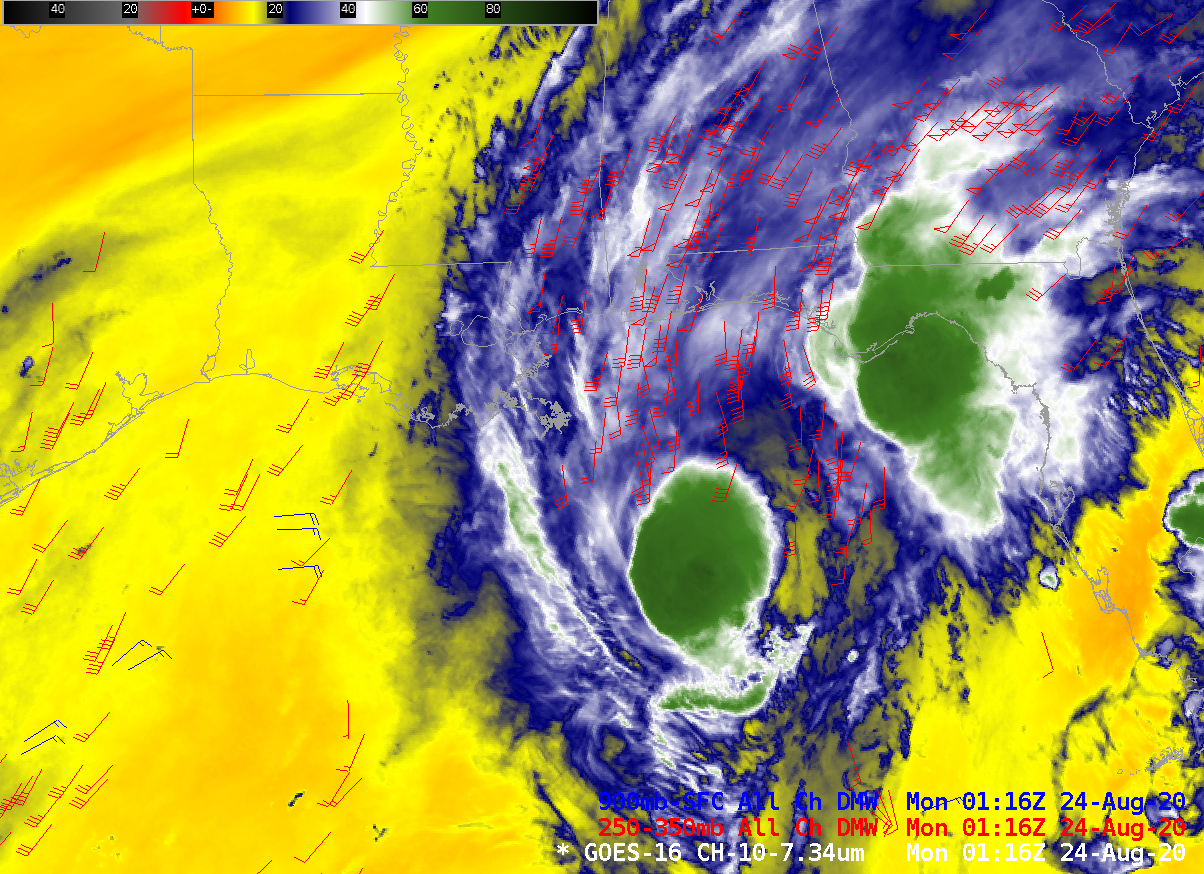

GOES-16 Low-level Water Vapor Infrared imagery (7.34 µm), half-hourly from 0116 thorugh 1316 UTC, 24 August 2020, overlain with GOES-16 derived motion wind vectors at 250-350 mb (red) and Surface-900 mb (blue) (Click to animate)
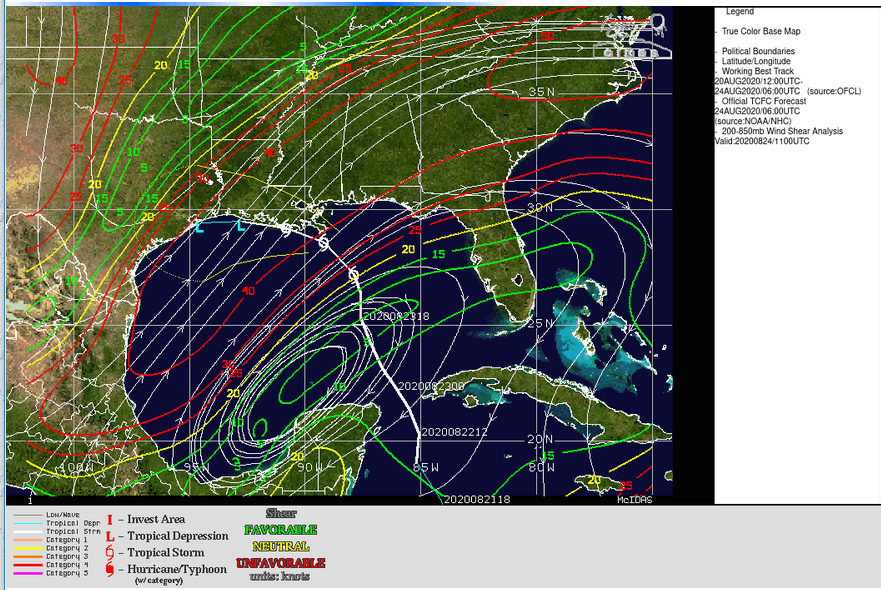
Tropical system Marco (formerly a category 1 Hurricane) was weakened by shear overnight and early morning on 24 August (as forecast). The half-hourly animation above, of GOES-16 Band 10, i.e., infrared “low-level” water vapor (7.3 µm), overlain with derived motion winds at upper (red) and lower (blue) levels (Click here to see only the water vapor animation; here is the shear analysis from the SSEC Tropical website; Note in the animation how the number of low-level vectors increases greatly at the end of the animation as visible imagery becomes available at sunrise. Also: the shear in the eastern part of the domain, over the Florida Straits, suggests a favorable environment for Tropical Cyclone Laura, approaching western Cuba from the east) shows the effect of shearing.
Low level easterlies and upper-level southwesterlies mean that the vertical structure of the storm was interrupted: the low-level circulation decoupled from the upper-level. That is, the low-level circulation moved to the west as the mid- and upper-level parts of the storm moved north and east. Result: By sunrise, visible imagery (0.64 µm) showed the low-level swirl of the elongating near-surface circulation southeast of the mouth of the Mississippi River, and south and west of the main convection over and offshore of the northwest Florida panhandle.

GOES-16 Visible Imagery (0.64 µm) from Mesoscale Sector 2, 1129-1328 UTC 24 August 2020 (Click to enlarge)
For more information on Tropical Storm Marco, refer to the pages of the National Hurricane Center.
View only this post Read Less
![GOES-17 “Red” Visible (0.64 µm), Shortwave Infrared (3.9 µm) and “Clean” Infrared Window (10.3 µm) images [click to play animation | MP4]](https://cimss.ssec.wisc.edu/satellite-blog/images/2020/08/200823_goes17_visible_shortwaveInfrared_infrared_Castle_Fire_CA_pyrocb_anim.gif)
![Plot of 00 UTC rawinsonde data from Las Vegas, NV [click to enlarge]](https://cimss.ssec.wisc.edu/satellite-blog/images/2020/08/200824_00UTC_KVEF_RAOB.GIF)
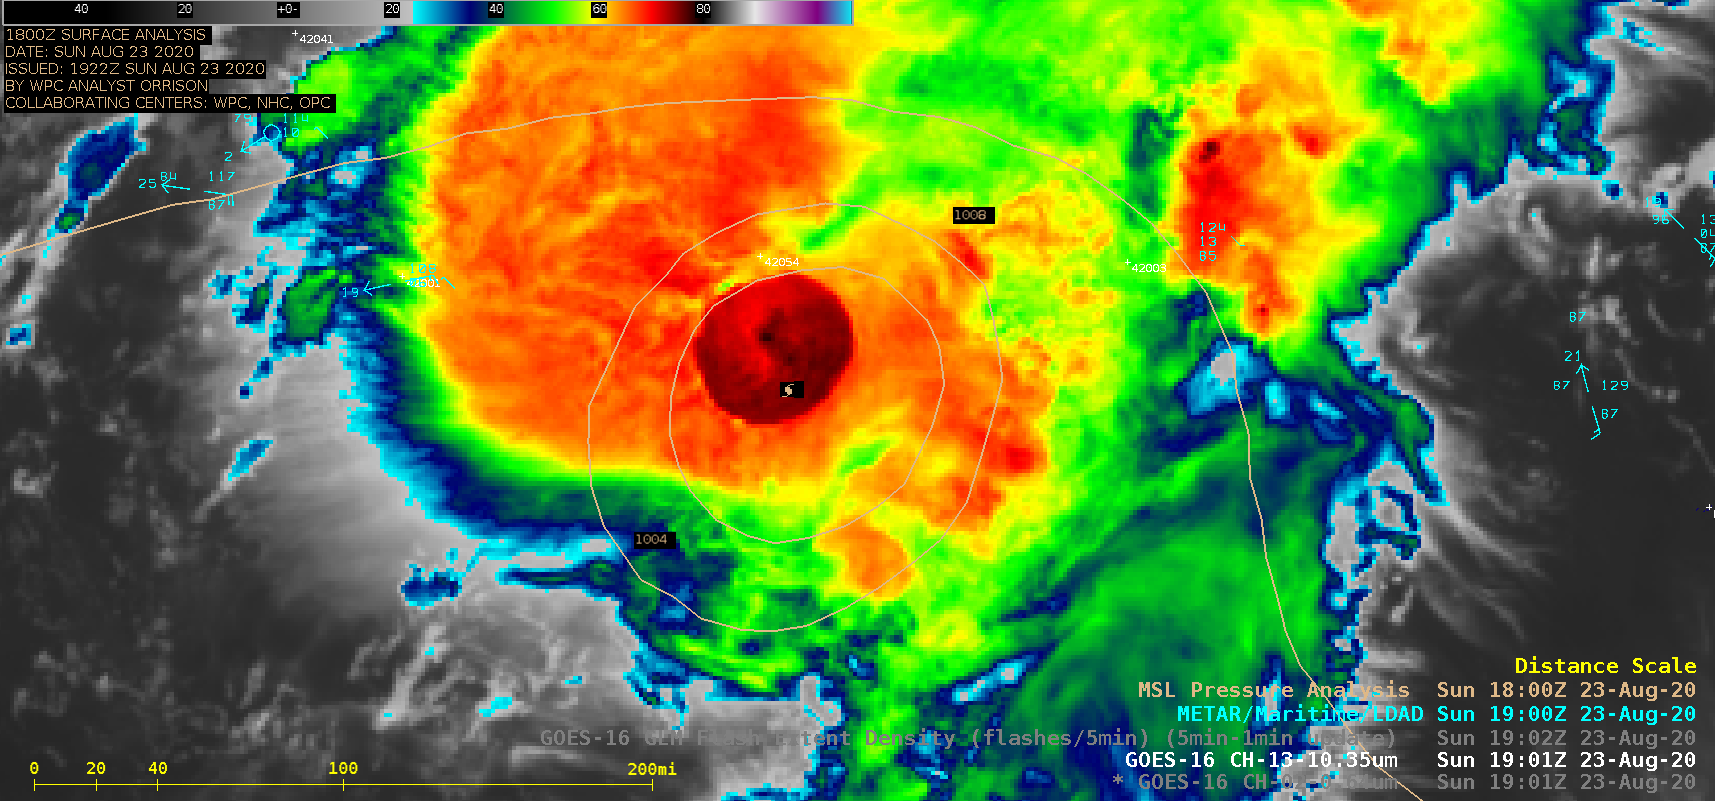
![GOES-16 “Red” Visible (0.64 µm) and “Clean” Infrared Window (10.35 µm) images (with and without an overlay of GLM Flash Extent Density) [click to play animation | MP4]](https://cimss.ssec.wisc.edu/satellite-blog/images/2020/08/200823_goes16_visible_infrared_glmFlashExtentDensity_Hurricane_Marco_anim.gif)
![Infrared images from Suomi NPP and GOES-16 [click to enlarge]](https://cimss.ssec.wisc.edu/satellite-blog/images/2020/08/200823_1842utc_suomiNPP_goes16_infrared_Hurricane_Marco_anim.gif)

