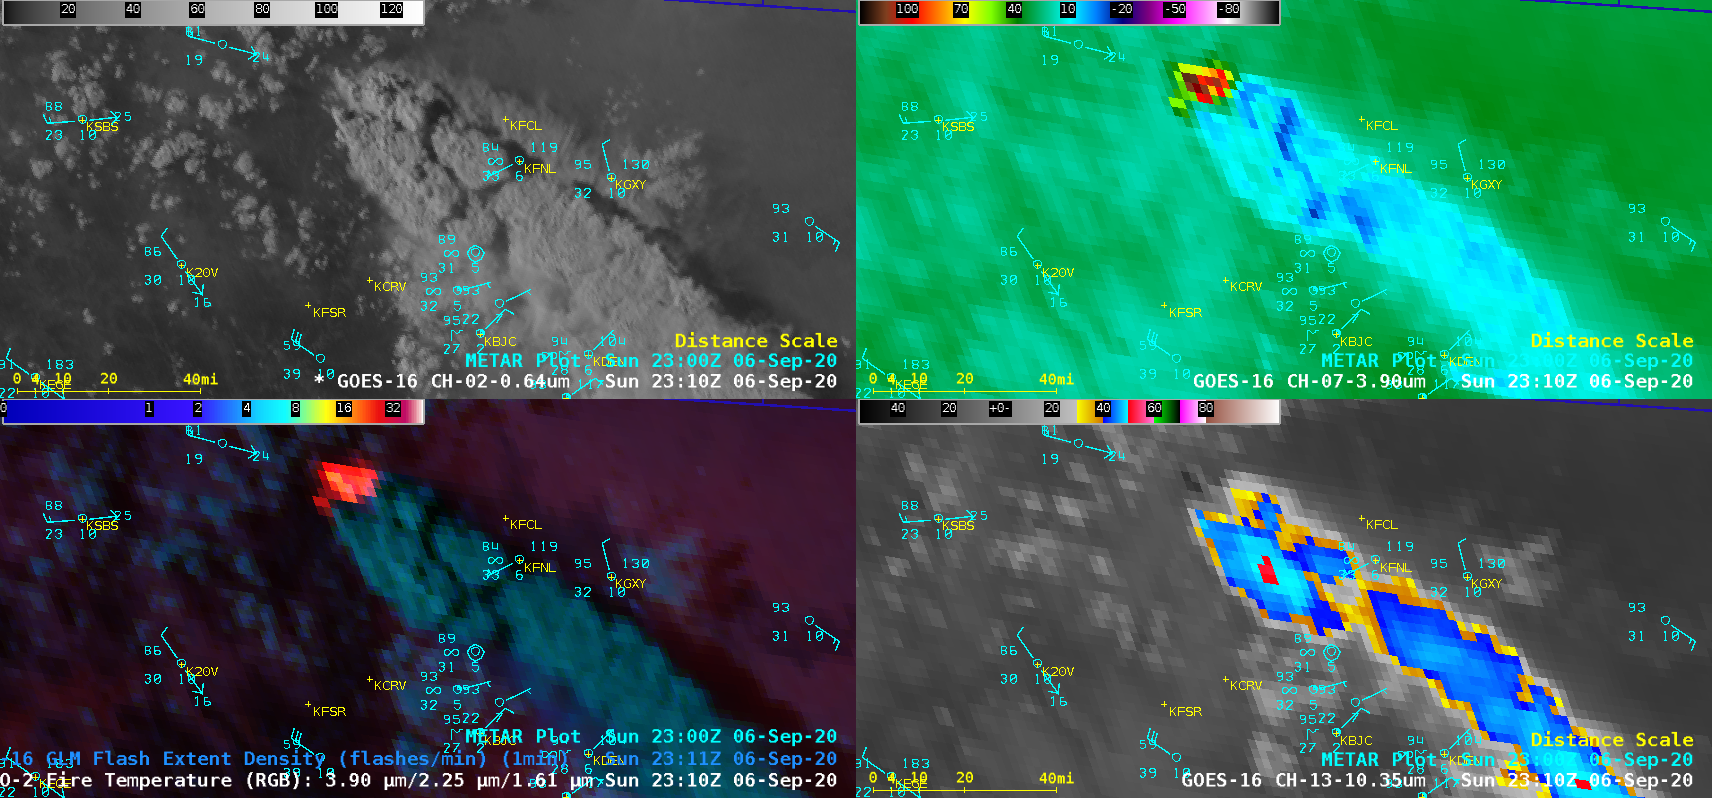
![GOES-16 “Red” Visible (0.64 µm, top left), Shortwave Infrared (3.9 µm, top right), Fire Temperature RGB + GLM Flash Extent Density (bottom left) and “Clean” Infrared Window (10.35 µm, bottom right) [click to play animation | MP4]](https://cimss.ssec.wisc.edu/satellite-blog/images/2020/09/200906_goes16_visible_shortwaveInfrared_fireTemperatureRGB_glmFlashExtentDensity_infraredWindow_CO_pyroCb_anim.gif)
GOES-16 “Red” Visible (0.64 µm, top left), Shortwave Infrared (3.9 µm, top right), Fire Temperature RGB + GLM Flash Extent Density (bottom left) and “Clean” Infrared Window (10.35 µm, bottom right) [click to play animation | MP4]
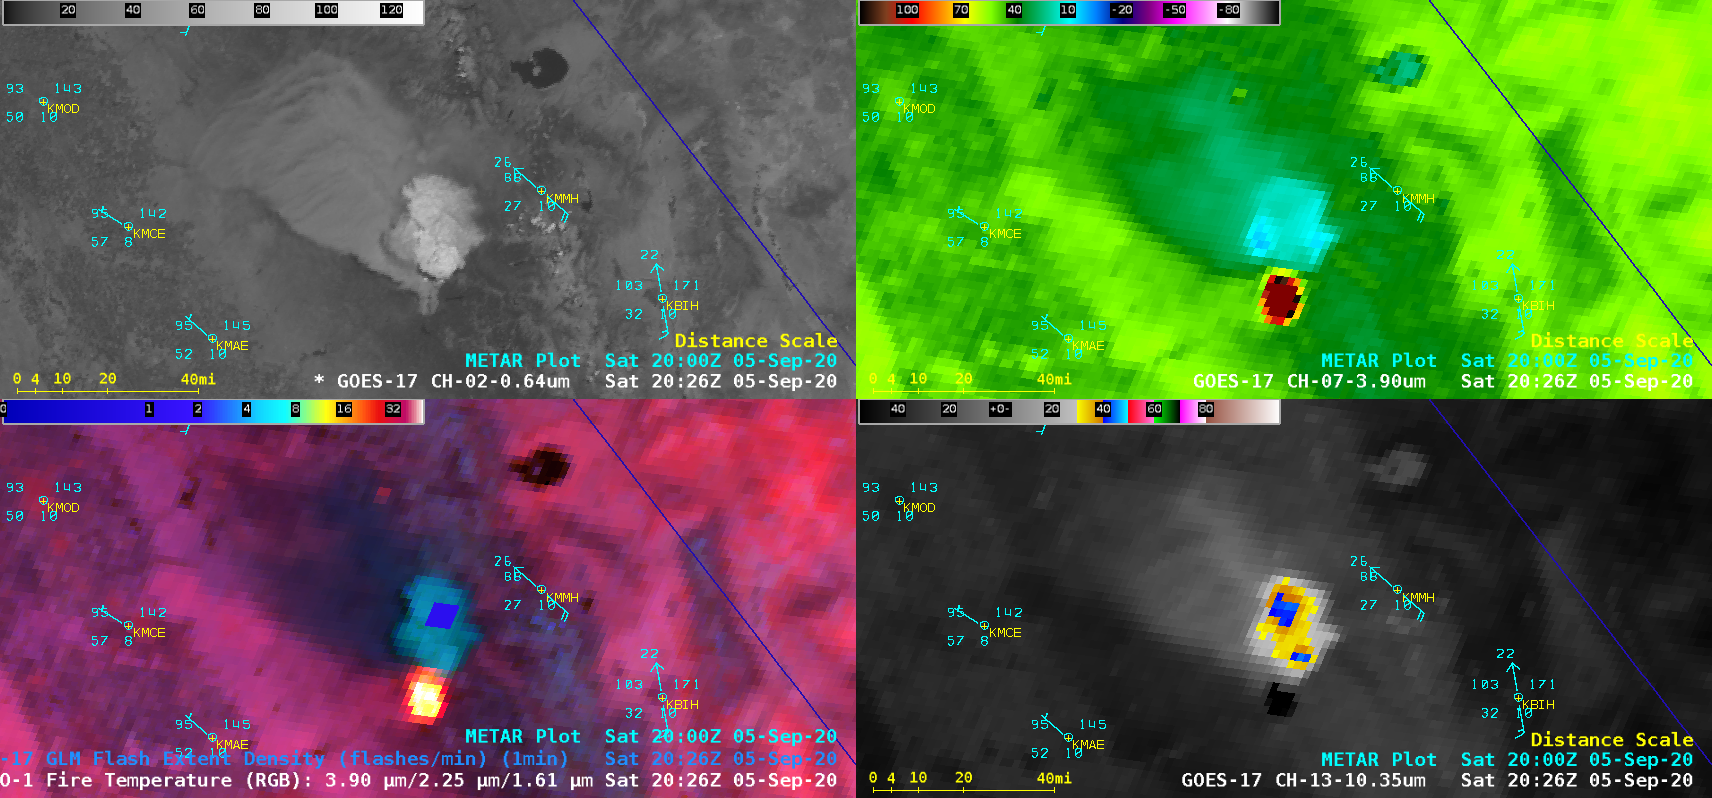
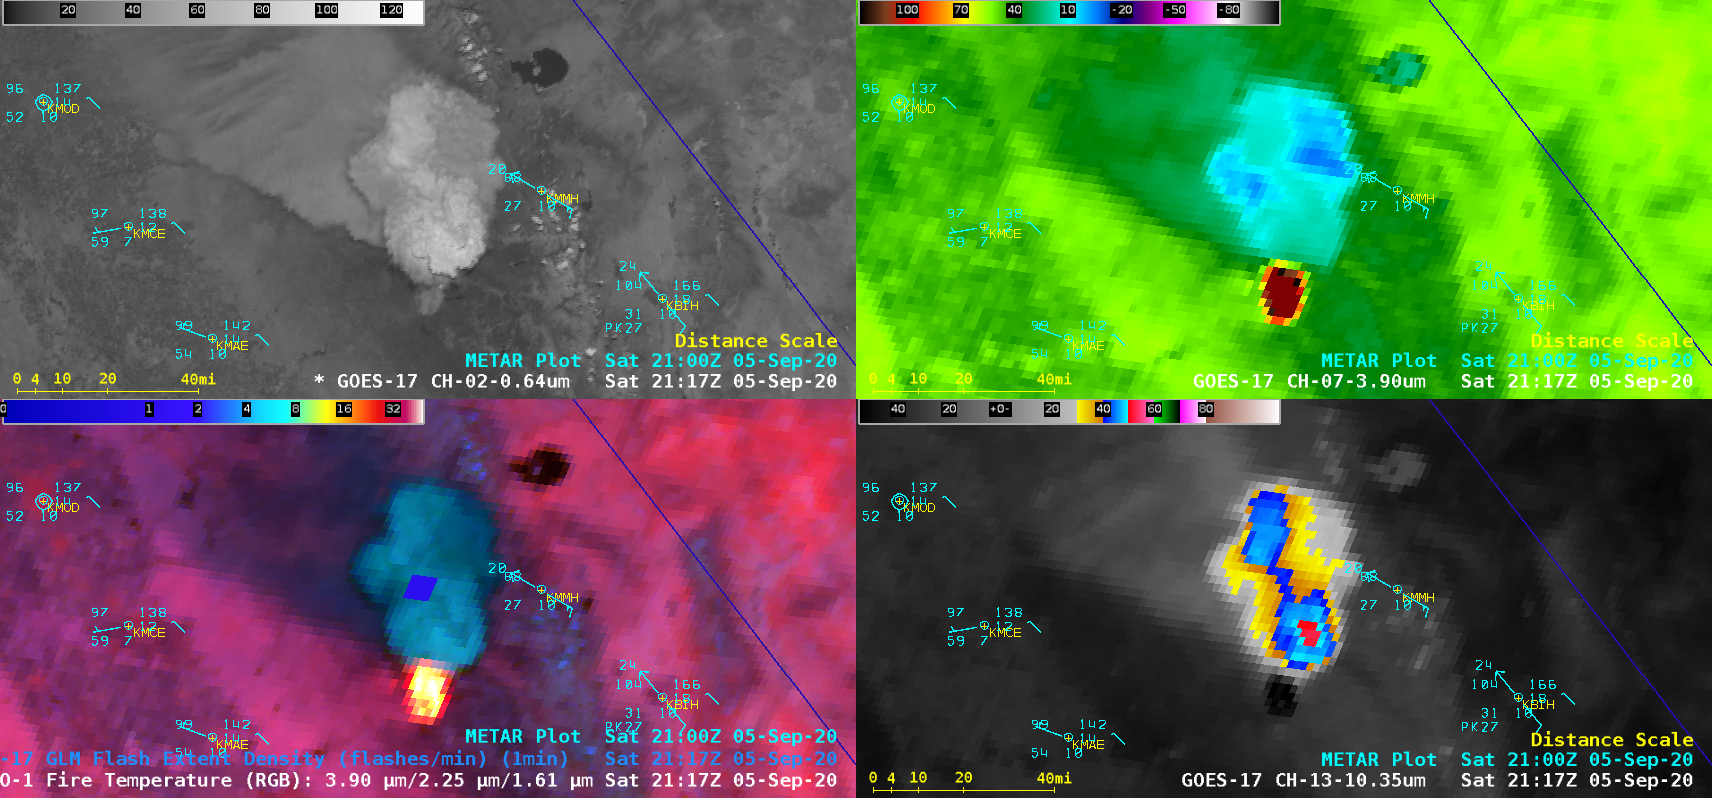
This fire also produced a brief pyroCb cloud on the previous day (below), as shown by a single blue (-40ºC) pixel on the 10.35 µm image at 2301 UTC — however, since no Mesoscale Sector was positioned over the area, the fire was only sampled by 5-minute CONUS Sector images. The presence of cloud-top infrared brightness temperatures of -40ºC and colder assures heterogeneous nucleation of all supercooled water droplets to form ice crystals, thereby meeting the criteria of a pyroCb.
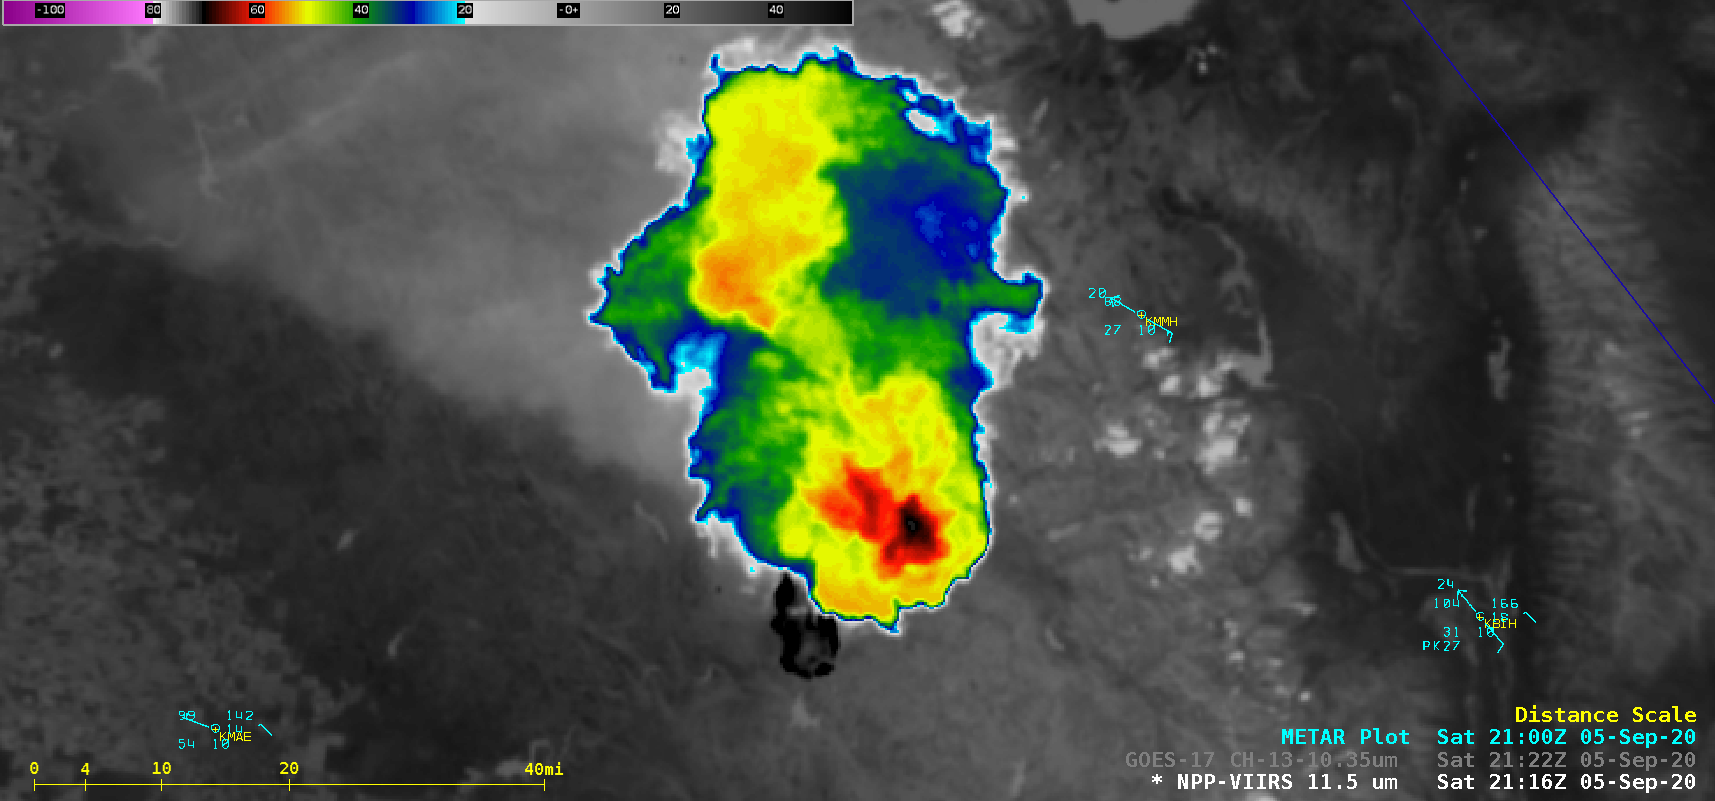
![GOES-16 “Red” Visible (0.64 µm, top left), Shortwave Infrared (3.9 µm, top right), Fire Temperature RGB + GLM Flash Extent Density (bottom left) and “Clean” Infrared Window (10.35 µm, bottom right) [click to play animation | MP4]](https://cimss.ssec.wisc.edu/satellite-blog/images/2020/09/200905_goes16_visible_shortwaveInfrared_fireTemperatureRGB_glmFlashExtentDensity_infraredWindow_CO_pyroCb_anim.gif)
GOES-16 “Red” Visible (0.64 µm, top left), Shortwave Infrared (3.9 µm, top right), Fire Temperature RGB + GLM Flash Extent Density (bottom left) and “Clean” Infrared Window (10.35 µm, bottom right) [click to play animation | MP4]
===== 07 September Update =====
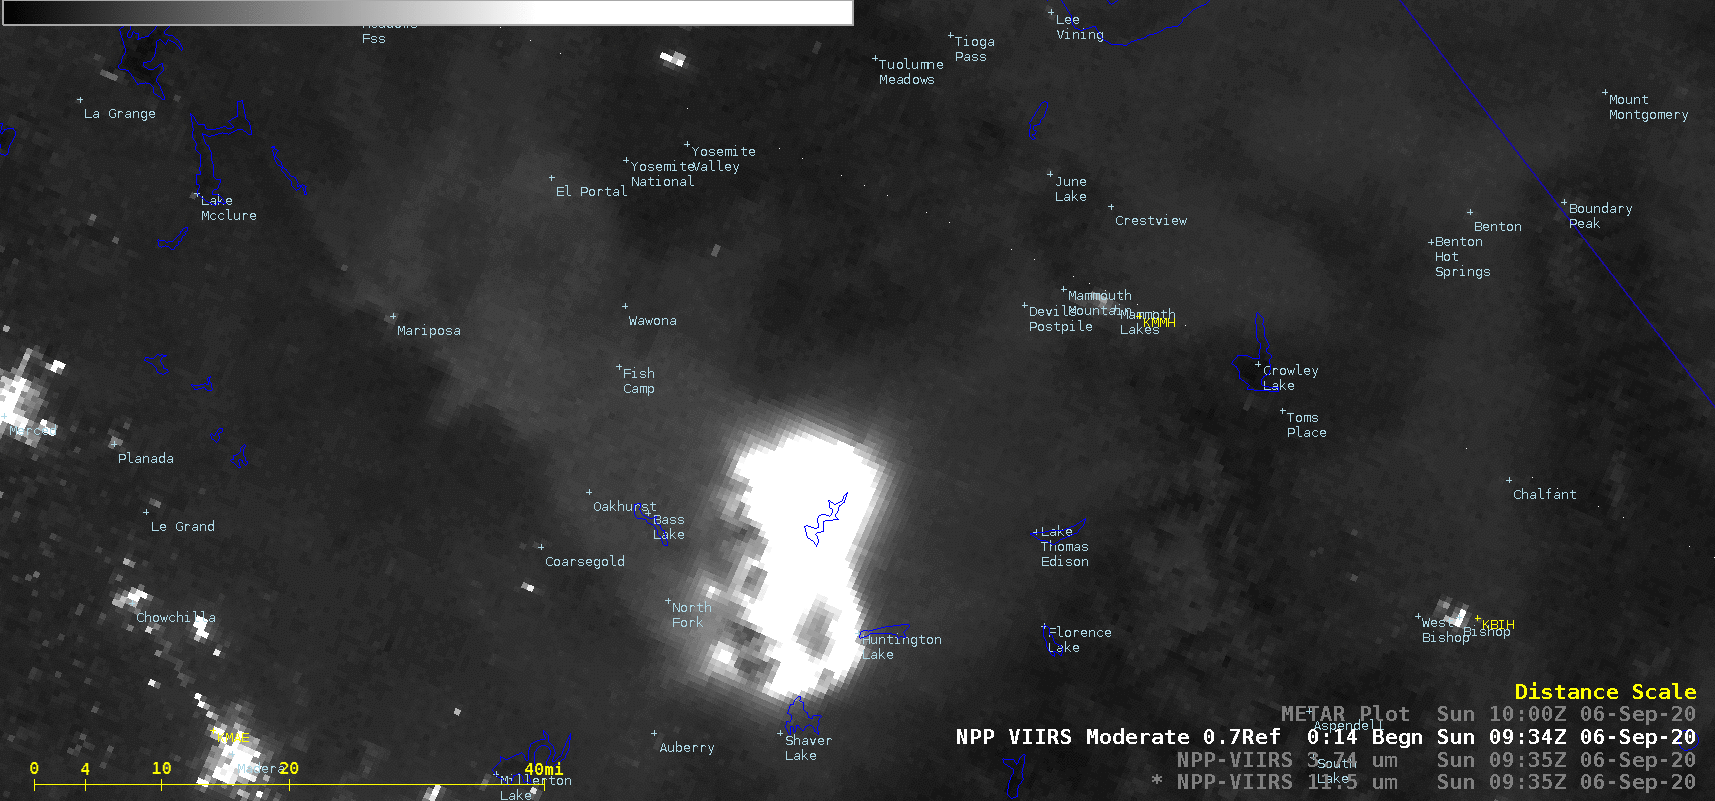
![Suomi NPP VIIRS Shortwave Infrared (3.74 µm) and Day/Night Band (0.7 µm) images, with plots of METAR surface reports [click to enlarge]](https://cimss.ssec.wisc.edu/satellite-blog/images/2020/09/200907_0916utc_suomiNPP_viirs_shortwaveInfrared_dayNightBand_Cameron_Peak_Fire_CO_anim.gif)
Suomi NPP VIIRS Shortwave Infrared (3.74 µm) and Day/Night Band (0.7 µm) images, with plots of METAR surface reports [click to enlarge]
A toggle between Shortwave Infrared images from Suomi NPP VIIRS (3.74 µm) and GOES-16 ABI (3.9 µm) is shown below — the shape of the Cameron Peak Fire thermal anomaly as well as locations of ongoing hot fires along its perimeter were more accurately seen in the 375-m resolution VIIRS image, compared to the 2-km resolution (at satellite sub-point) ABI image. The 2 images are time-matched to correspond to the 0922 UTC time of the Suomi NPP satellite’s overpass.
![Shortwave Infrared images from Suomi NPP (3.74 µm) and GOES-16 (3.9 µm), with plots of METAR surface reports [click to enlarge]](https://cimss.ssec.wisc.edu/satellite-blog/images/2020/09/200907_0916utc_suomiNPP_goes16_shortwaveInfrared_Cameron_Peak_Fire_CO_anim.gif)
Shortwave Infrared images from Suomi NPP (3.74 µm) and GOES-16 (3.9 µm), with plots of METAR surface reports [click to enlarge]
View only this post Read Less

![Infrared Window images from Suomi NPP and GOES-17 [click to enlarge]](https://cimss.ssec.wisc.edu/satellite-blog/images/2020/09/200905_2122utc_suomiNPP_goes17_infrared_CA_pyroCb_anim.gif)

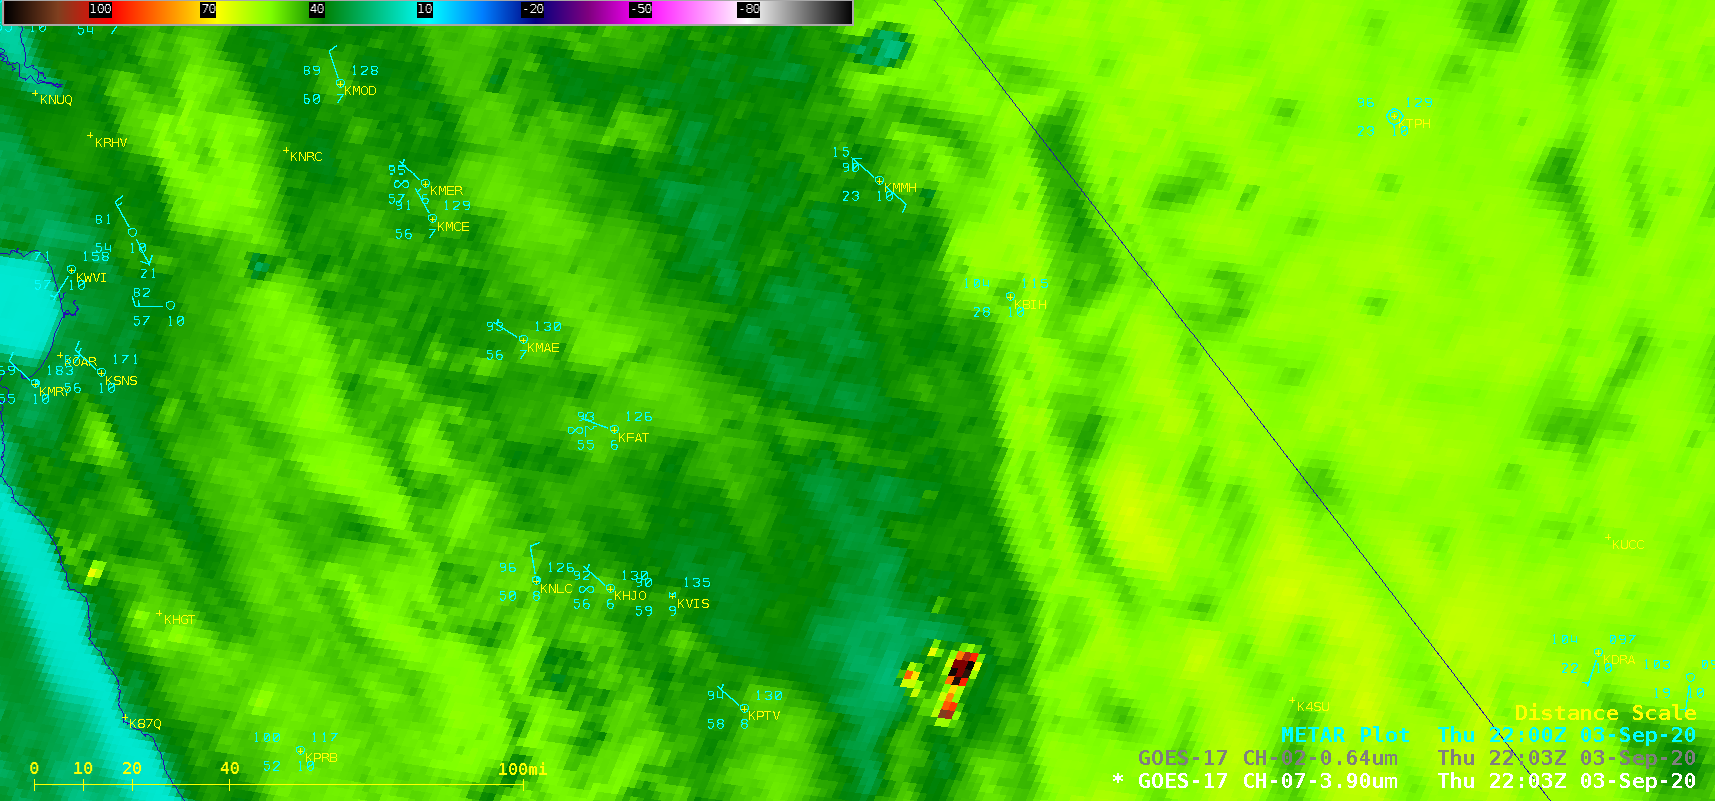
![GOES-17 “Red” Visible (0.64 µm) and Shortwave Infrared (3.9 µm) images [click to play animation | MP4]](https://cimss.ssec.wisc.edu/satellite-blog/images/2020/09/200903_goes17_visible_shortwaveInfrared_SQF_Complex_CA_anim.gif)
