1-minute Mesoscale Domain Sector GOES-17 (GOES-West) “Red” Visible (0.64 µm) and “Clean” Infrared Window (10.35 µm) images (above) showed the development of severe thunderstorms over southern/central Arizona from 1600-1900 UTC on 23 September 2019. The far western storm exhibited a well-defined Above-Anvil Cirrus Plume (AACP) that extended northeastward from the cold overshooting top (whose coldest infrared brightness temperature... Read More
![GOES-17 “Red” Visible (0.64 µm) and “Clean” Infrared Window (10.35 µm) images, with surface reports plotted in cyan [click to play animation | MP4]](https://cimss.ssec.wisc.edu/satellite-blog/wp-content/uploads/sites/5/2019/09/az_vis-20190923_181027.png)
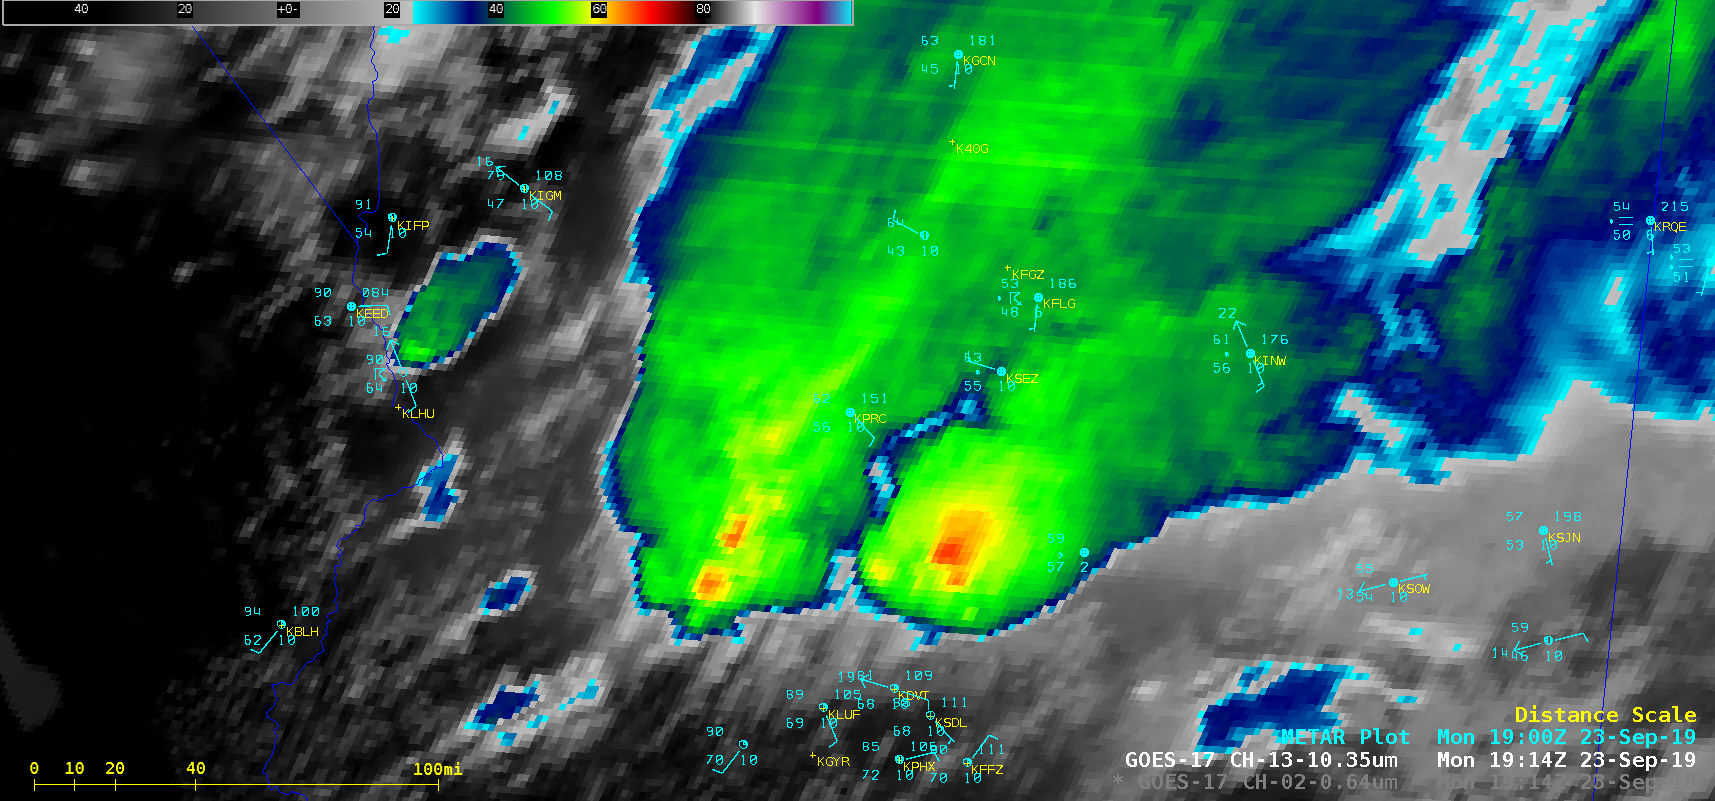
GOES-17 “Red” Visible (0.64 µm) and “Clean” Infrared Window (10.35 µm) images, with surface reports plotted in cyan [click to play animation | MP4]
1-minute
Mesoscale Domain Sector GOES-17
(GOES-West) “Red” Visible (
0.64 µm) and “Clean” Infrared Window (
10.35 µm) images
(above) showed the development of severe thunderstorms over southern/central Arizona from 1600-1900 UTC on
23 September 2019. The far western storm exhibited a well-defined
Above-Anvil Cirrus Plume (AACP) that extended northeastward from the cold overshooting top (whose coldest infrared brightness temperature was -74ºC); note that the AACP feature appeared colder
(shades of yellow to orange) on the Infrared images (for example, at
1817 UTC).
As the western storm began to weaken somewhat, a new storm just to the east (located about 20-30 miles north-northeast of the Phoenix metro area) began to intensify, prompting the issuance of a Tornado Warning at 1914 UTC (the last tornado warning issued by NWS Phoenix was 21 January 2010) — a brief EF0 tornado was documented (NWS Phoenix summary).
![GOES-17 “Clean” Infrared Window (10.35 µm) images, with surface reports plotted in cyan [click to play animation | MP4]](https://cimss.ssec.wisc.edu/satellite-blog/wp-content/uploads/sites/5/2019/09/az_ir-20190923_191427.png)
GOES-17 “Clean” Infrared Window (10.35 µm) images, with surface reports plotted in cyan [click to play animation | MP4]
Much of the moisture helping to fuel the development of this severe convection was from the remnants of Tropical Storm Lorena in the East Pacific Ocean — the northward transport of this moisture could be seen using the hourly MIMIC Total Precipitable Water product (below).
![MIMIC Total Precipitable Water product [click to play animation | MP4]](https://cimss.ssec.wisc.edu/satellite-blog/wp-content/uploads/sites/5/2019/09/comp20190923.230000_tpw.png)
MIMIC Total Precipitable Water product [click to play animation | MP4]
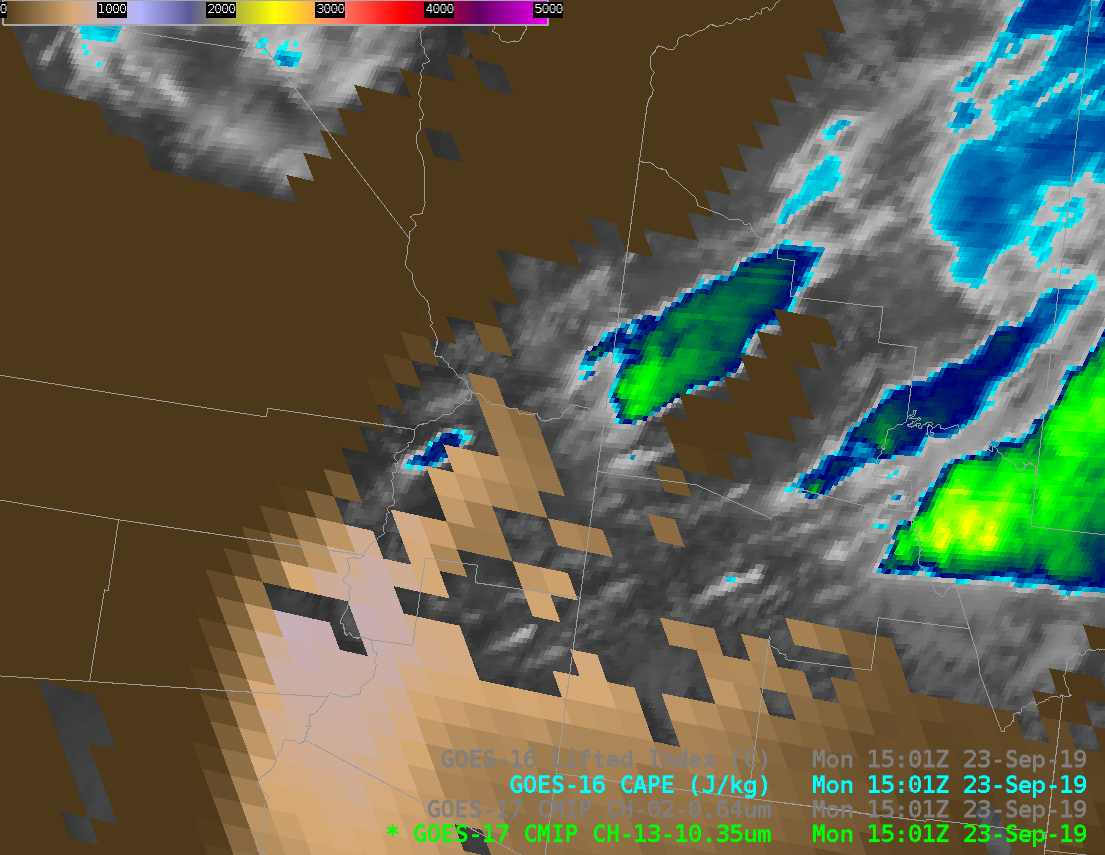
GOES-17 ABI Band 13 (10.35 µm) Clean Window Imagery and Derived Convective Available Potential Energy, 1501 – 1856 UTC on 23 September 2019 (Click to animate)
Stability parameters from GOES-16 showed that the reigon of thunderstorm development was just east of a strong gradient in Convective Available Potential Energy. The animation above shows the GOES-17 Clean Window; in regions of clear sky, the baseline Derived Stability Index CAPE is shown. CAPE values are zero over much of California (except for the southeasternmost corner) but they increase rapidly over Arizona to values approaching 1000 J/kg.
On 23 September, skies were clear enough that an instability signal was obvious in the clear-sky baseline CAPE. An ‘All-Sky’ product has been developed that can be used on days with more widespread cloudiness; it is available at this link. Values of All-Sky CAPE at 1156 and 1556 UTC on 23 September are shown below, and they also show a sharp gradient in the instability, and the link down to moisture from Lorena’s remants.

‘All-Sky’ values of Convective Available Potential Energy (CAPE) at 1156 and 1556 UTC on 23 September 2019 (Click to enlarge)
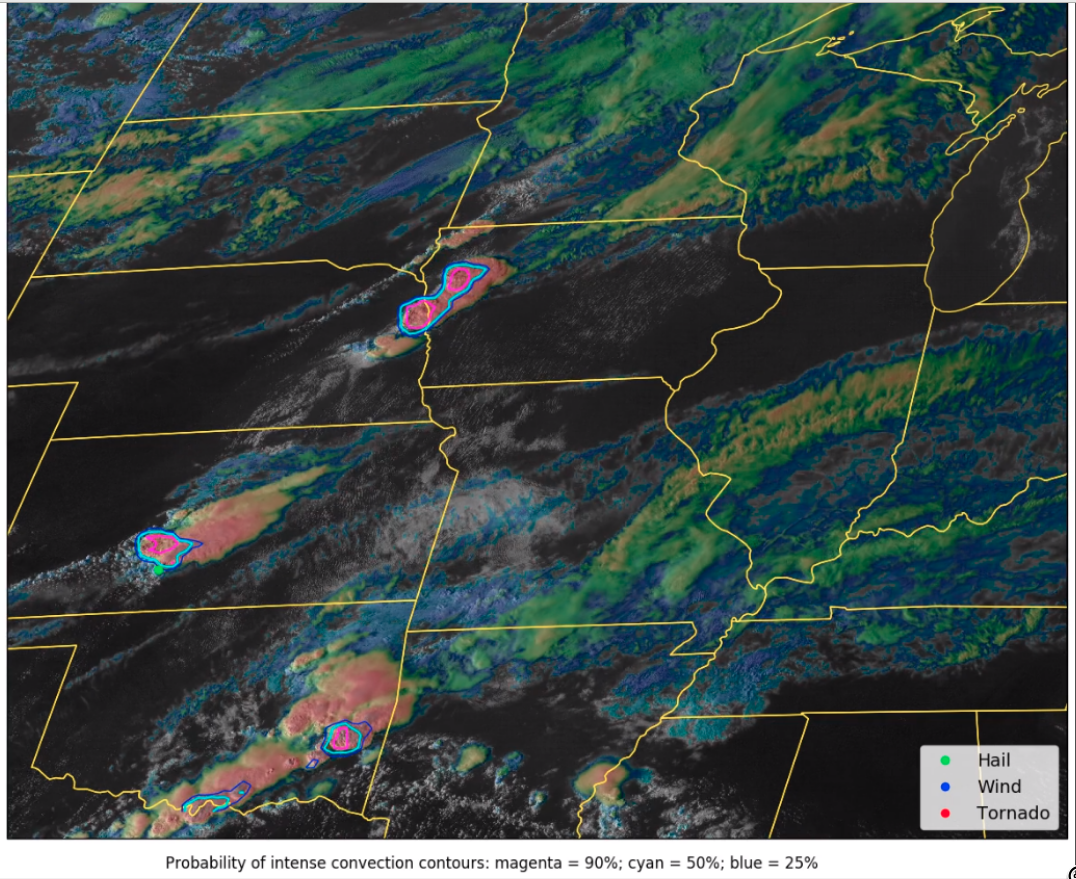
NOAA/CIMSS ProbSevere is a product designed to indicate the likelihood that a given object will produce severe weather within the next 60 minutes. An animation of the product at 5-minute intervals, below, shows that the right-moving radar cell (also associated, as noted above, with an AACP) that developed over far southwestern Arizona (becoming a warned storm at 1647 UTC) was very likely to produce severe weather.
NOAA/CIMSS ProbSevere from 16:30 UTC to 18:00 UTC. Contours surrounding radar objects are color-coded such that pink/magenta contours are the highest probability. Warning polygons (yellow for severe thunderstorm) are also shown (Click to enlarge)
Parameters that are used to determine the probability can be revealed at the ProbSevere site by mousing over the colored object contours. The values for the warned storm over SW Arizona are shown below at 1650 UTC, 3 minutes after the warning was issued. This image shows the 1710 UTC readout with the highest ProbWind value (76%); this image shows the 1725 UTC readout with the highest ‘ProbHail’ value (99%); ProbTor values on this day were not exceptionally large — for the later tornado-warned storm farther east, they were 28% at 1915 UTC and 30% at 1920 UTC.
NOAA/CIMSS ProbSevere display from 1650 UTC on 23 September 2019; parameters used in the probability computation, and Severe Thunderstorm Warning polygon parameters are also shown (Click to enlarge)
CIMSS is developing a machine-learning tool that combines ABI and GLM imagery (that is, only satellite data) to identify regions where supercellular thunderstorms capable of producing severe weather might be occurring. An mp4 animation for this event (courtesy John Cintineo, CIMSS) is shown below. (This experimental product was also shown in this blog post)
View only this post
Read Less
![GOES-16 “Clean” Infrared Window (10.35 µm) images [click to play animation | MP4]](https://cimss.ssec.wisc.edu/satellite-blog/wp-content/uploads/sites/5/2019/09/190926_goes16_infrared_Lorenzo_anim.gif)
![VIIRS True Color RGB and Infrared Window<em> (11.45 µm)</em> images from Suomi NPP and NOAA-20 [click to enlarge]](https://cimss.ssec.wisc.edu/satellite-blog/wp-content/uploads/sites/5/2019/09/190926_15utc_suomiNPP_16utc_noaa20_viirs_trueColorRGB_infraredWindow_Lorenzo_anim.gif)
![DMSP-18 SSMIS Microwave (85 GHz) image at 1941 UTC [click to enlarge]](https://cimss.ssec.wisc.edu/satellite-blog/wp-content/uploads/sites/5/2019/09/190926_1941utc_dmsp18_ssmis_microwave_Lorenzo.png)
![GOES-16 “Clean” Infrared Window (10.35 µm) images, with SPC Storm Reports plotted in cyan [click to play animation | MP4]](https://cimss.ssec.wisc.edu/satellite-blog/wp-content/uploads/sites/5/2019/09/190924_goes16_infrared_spcStormReports_Upper_Midwest_anim.gif)
![GOES-16 “Red” Visible (0.64 µm) images, with SPC Storm Reports plotted in red [click to play animation | MP4]](https://cimss.ssec.wisc.edu/satellite-blog/wp-content/uploads/sites/5/2019/09/190924_goes16_visible_spcStormReports_Upper_Midwest_anim.gif)


![GOES-17 “Red” Visible (0.64 µm) and “Clean” Infrared Window (10.35 µm) images, with surface reports plotted in cyan [click to play animation | MP4]](https://cimss.ssec.wisc.edu/satellite-blog/wp-content/uploads/sites/5/2019/09/190923_goes17_visible_infrared_AZ_convection_anim.gif)
![GOES-17 “Clean” Infrared Window (10.35 µm) images, with surface reports plotted in cyan [click to play animation | MP4]](https://cimss.ssec.wisc.edu/satellite-blog/wp-content/uploads/sites/5/2019/09/190923_goes17_1830-1945utc_infrared_AZ_convection_anim.gif)
![MIMIC Total Precipitable Water product [click to play animation | MP4]](https://cimss.ssec.wisc.edu/satellite-blog/wp-content/uploads/sites/5/2019/09/190920_190923_mimicTPW_anim.gif)

