1-minute Mesoscale Domain Sector GOES-16 (GOES-East) “Red” Visible (0.64 µm), Shortwave Infrared (3.9 µm), “Clean” Infrared Window (10.35 µm) and Fire Temperature Red-Green-Blue (RGB) images (above) showed diurnal changes in the Cameron Peak Fire in northern Colorado on 14 October 2020. Aided by strong westerly winds at the surface (with peak gusts in the 50-70 mph range), the fire’s thermal signature initially began... Read More
![GOES-16 “Red” Visible (0.64 µm, top left), Shortwave Infrared (3.9 µm, top right), “Clean” Infrared Window (10.35 µm, bottom left) and Fire Temperature RGB (bottom right) [click to play animation | MP4]](https://cimss.ssec.wisc.edu/satellite-blog/images/2020/10/co_4p-20201014_195722.png)
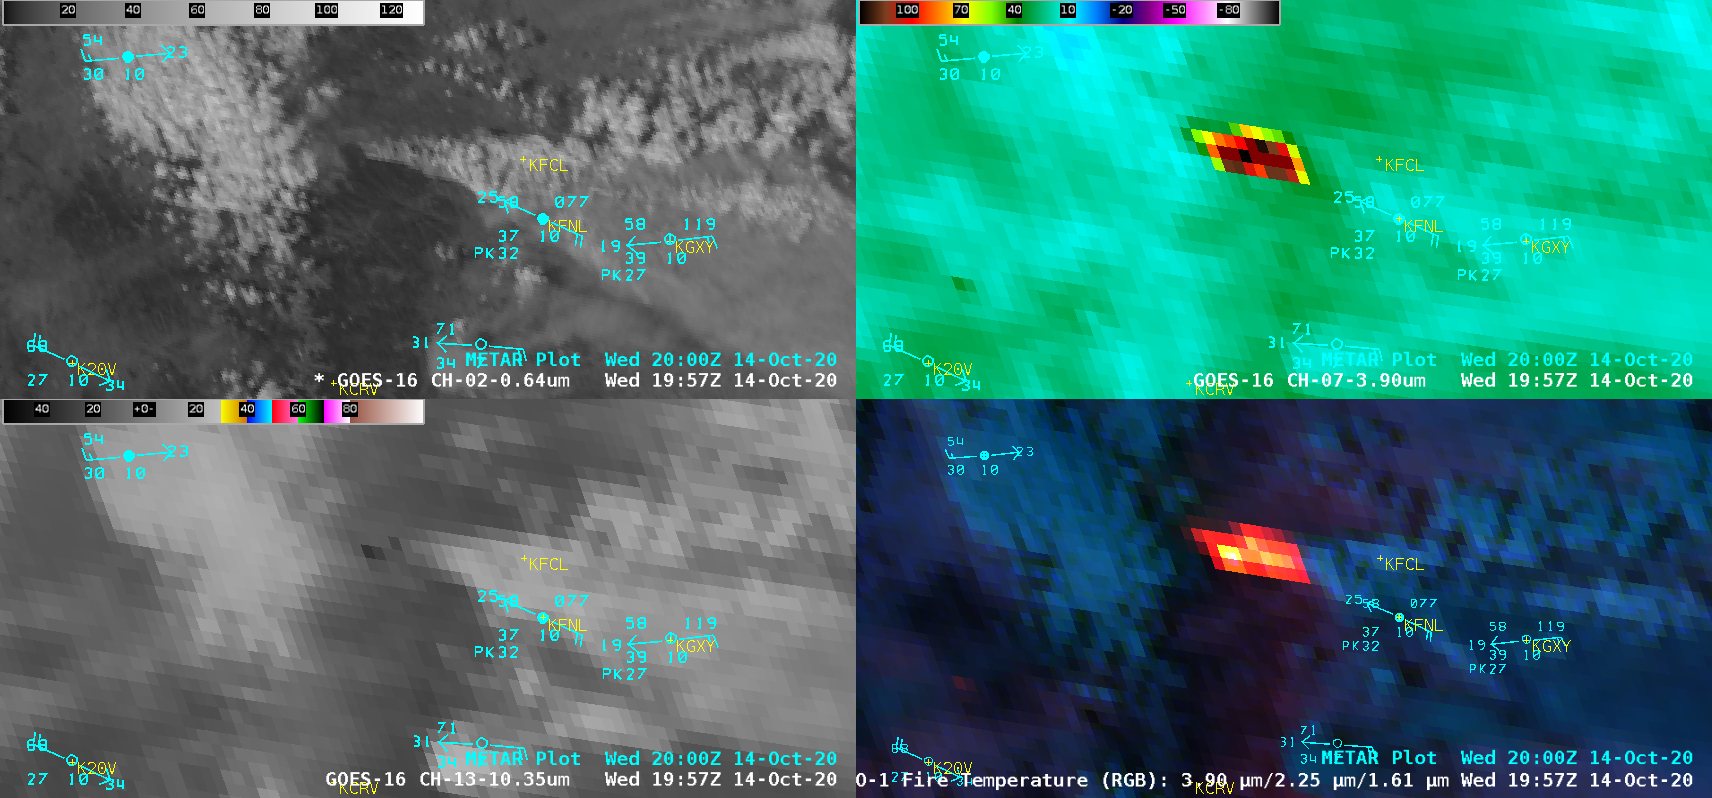
GOES-16 “Red” Visible (0.64 µm, top left), Shortwave Infrared (3.9 µm, top right), “Clean” Infrared Window (10.35 µm, bottom left) and Fire Temperature RGB (bottom right) [click to play animation | MP4]
1-minute
Mesoscale Domain Sector GOES-16
(GOES-East) “Red” Visible (
0.64 µm), Shortwave Infrared (
3.9 µm), “Clean” Infrared Window (
10.35 µm) and
Fire Temperature Red-Green-Blue (RGB) images
(above) showed diurnal changes in the
Cameron Peak Fire in northern Colorado on
14 October 2020. Aided by strong westerly winds at the surface (with peak gusts in the 50-70 mph range), the fire’s thermal signature initially began to increase in areal coverage and spread rapidly eastward — however, following the passage of a
cold front around 18 UTC, an influx of cooler air with higher relative humidity halted this eastward expansion of the fire (with the thermal signature then retreating westward and diminishing in size). By that evening, the fire’s total burned area had grown to 158,300 acres, making it Colorado’s largest wildfire on record. While there was some pyrocumulus development over the fire source region, this large and hot fire did not produce a pyrocumulonimbus cloud.
Another view of the fire using 5-minute imagery from GOES-16 provided quantitative products such as Fire Power, Fire Temperature and Fire Area (below) — these 3 products are components of the GOES Fire Detection and Characterization Algorithm (FDCA). Surface observations showed that during the morning hours smoke was restricting surface visibility to 3 miles at Fort Collins (KFNL) and 5 miles at Greeley (KGXY).
![GOES-16 Fire Temperature (top left), Shortwave Infrared (3.9 µm, top right), Fire Power (bottom left) and Fire Area (bottom right) [click to play animation | MP4]](https://cimss.ssec.wisc.edu/satellite-blog/images/2020/10/co_fire_4p-20201014_195114.png)
GOES-16 Fire Temperature (top left), Shortwave Infrared (3.9 µm, top right), Fire Power (bottom left) and Fire Area (bottom right) [click to play animation | MP4]
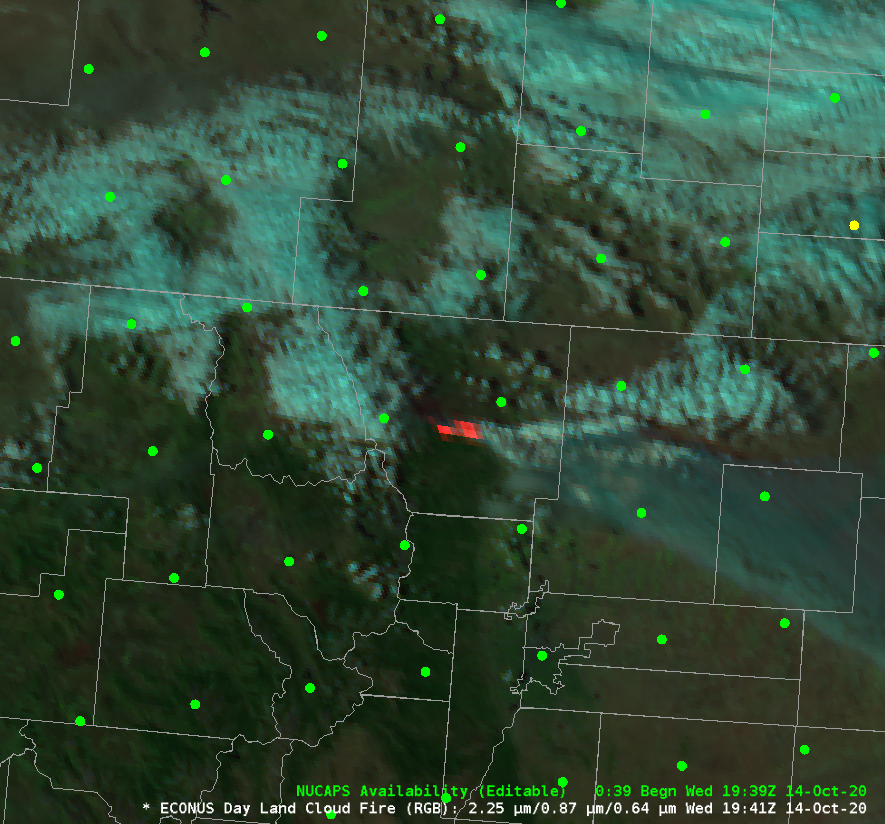
GOES-16 True Color Red-Green-Blue (RGB) images created using
Geo2Grid (below) indicated that one portion of the Cameron Peak Fire smoke plume was transported eastward across parts of Nebraska and Iowa, with another part of the plume moving southeastward across Kansas.
![GOES-16 True Color RGB images [click to play animation | MP4]](https://cimss.ssec.wisc.edu/satellite-blog/images/2020/10/GOES-16_ABI_RadC_true_color_2020288_213114Z.png)
GOES-16 True Color RGB images [click to play animation | MP4]
A toggle between Terra MODIS True Color and False Color RGB images on 14 October from the
MODIS Today site
(below) showed the Cameron Peak Fire smoke plume as well as its large burn scar
(shades of red).
![Terra MODIS True Color and False Color RGB images on 14 October [click to enlarge]](https://cimss.ssec.wisc.edu/satellite-blog/images/2020/10/201014_modis_truecolor_falsecolor_CO_anim.gif)
Terra MODIS True Color and False Color RGB images on 14 October [click to enlarge]
In a comparison of MODIS False Color RGB images from Aqua on 13 October and Terra on 14 October
(below) the growth of the Cameron Peak Fire along its southeast flank was evident — and several other large fire burn scars were evident across Colorado and southern Wyoming.
![MODIS False Color RGB images from Aqua (13 October) and Terra (14 October) [click to enlarge]](https://cimss.ssec.wisc.edu/satellite-blog/images/2020/10/201013_201014_modis_falsecolor_CO_anim.gif)
MODIS False Color RGB images from Aqua (13 October) and Terra (14 October) [click to enlarge]
Additional aspects of this fire and its environment are discussed
here.
View only this post
Read Less
![GOES-16 “Red” Visible (0.64 µm, top left), Shortwave Infrared (3.9 µm, top right), “Clean” Infrared Window (10.35 µm, bottom left) and Fire Temperature RGB (bottom right) [click to play animation | MP4]](https://cimss.ssec.wisc.edu/satellite-blog/images/2020/10/201014_goes16_visible_shortwaveInfrared_infraredWindow_fireTemperatureRGB_CameronPeakFire_CO_anim.gif)
![GOES-16 Fire Temperature (top left), Shortwave Infrared (3.9 µm, top right), Fire Power (bottom left) and Fire Area (bottom right) [click to play animation | MP4]](https://cimss.ssec.wisc.edu/satellite-blog/images/2020/10/201014_goes16_fireTemperature_shortwaveInfrared_firePower_fireArea_CameronPeak_Fire_CO_anim.gif)
![GOES-16 True Color RGB images [click to play animation | MP4]](https://cimss.ssec.wisc.edu/satellite-blog/images/2020/10/201014_goes16_trueColorRGB_Cameron_Peak_Fire_CO_smoke_plume_anim.gif)


![GOES-16 Upper-level Water Vapor (6.2 µm) images, with plots of hourly surface wind barbs and gusts [click to play animation | MP4]](https://cimss.ssec.wisc.edu/satellite-blog/images/2020/10/201011_goes16_waterVapor_band8_windGusts_Plains_anim.gif)
![GOES-16 Mid-level Water Vapor (6.9 µm) images, with plots of hourly surface wind barbs and gusts [click to play animation | MP4]](https://cimss.ssec.wisc.edu/satellite-blog/images/2020/10/201011_goes16_waterVapor_windGusts_Plains_anim.gif)
![GOES-16 “Red” Visible (0.64 µm) and CIMSS Natural Color RGB images [click to play animation | MP4]](https://cimss.ssec.wisc.edu/satellite-blog/images/2020/10/201011_goes16_visible_cimssNaturalColorRGB_CO_KS_blowing_dust_anim.gif)
![GOES-16 True Color images [click to play animation | MP4]](https://cimss.ssec.wisc.edu/satellite-blog/images/2020/10/201011_goes16_trueColorRGB_CO_KS_blowing_dust_v2_anim.gif)
