1-minute Mesoscale Domain Sector GOES-16 (GOES-East) “Clean” Infrared Window (10.35 µm) images — with and without an overlay of GLM Flash Extent Density — and “Red” Visible (0.64 µm) images (above) showed showed Hurricane Delta as it intensified from a Category 2 to a Category 3 storm over the Gulf of Mexico during the daytime hours on 08 October 2020. Cloud-top infrared brightness temperatures of... Read More
![GOES-16 “Clean” Infrared Window (10.35 µm) images (with and without an overlay of GLM Flash Extent Density) and “Red” Visible (0.64 µm) images [click to play animation | MP4]](https://cimss.ssec.wisc.edu/satellite-blog/images/2020/10/delta8_vis-20201008_212322.png)
GOES-16 “Clean” Infrared Window (10.35 µm) images (with and without an overlay of GLM Flash Extent Density) and “Red” Visible (0.64 µm) images [click to play animation | MP4]
1-minute
Mesoscale Domain Sector GOES-16
(GOES-East) “Clean” Infrared Window (
10.35 µm) images — with and without an overlay of
GLM Flash Extent Density — and “Red” Visible (
0.64 µm) images
(above) showed showed
Hurricane Delta as it intensified from a Category 2 to a Category 3 storm over the Gulf of Mexico during the daytime hours on 08 October 2020. Cloud-top infrared brightness temperatures of -90ºC and colder
(yellow pixels embedded within the darker shades of purple) were occasionally seen within the eyewall region of Delta, along with intermittent bursts of lightning activity.
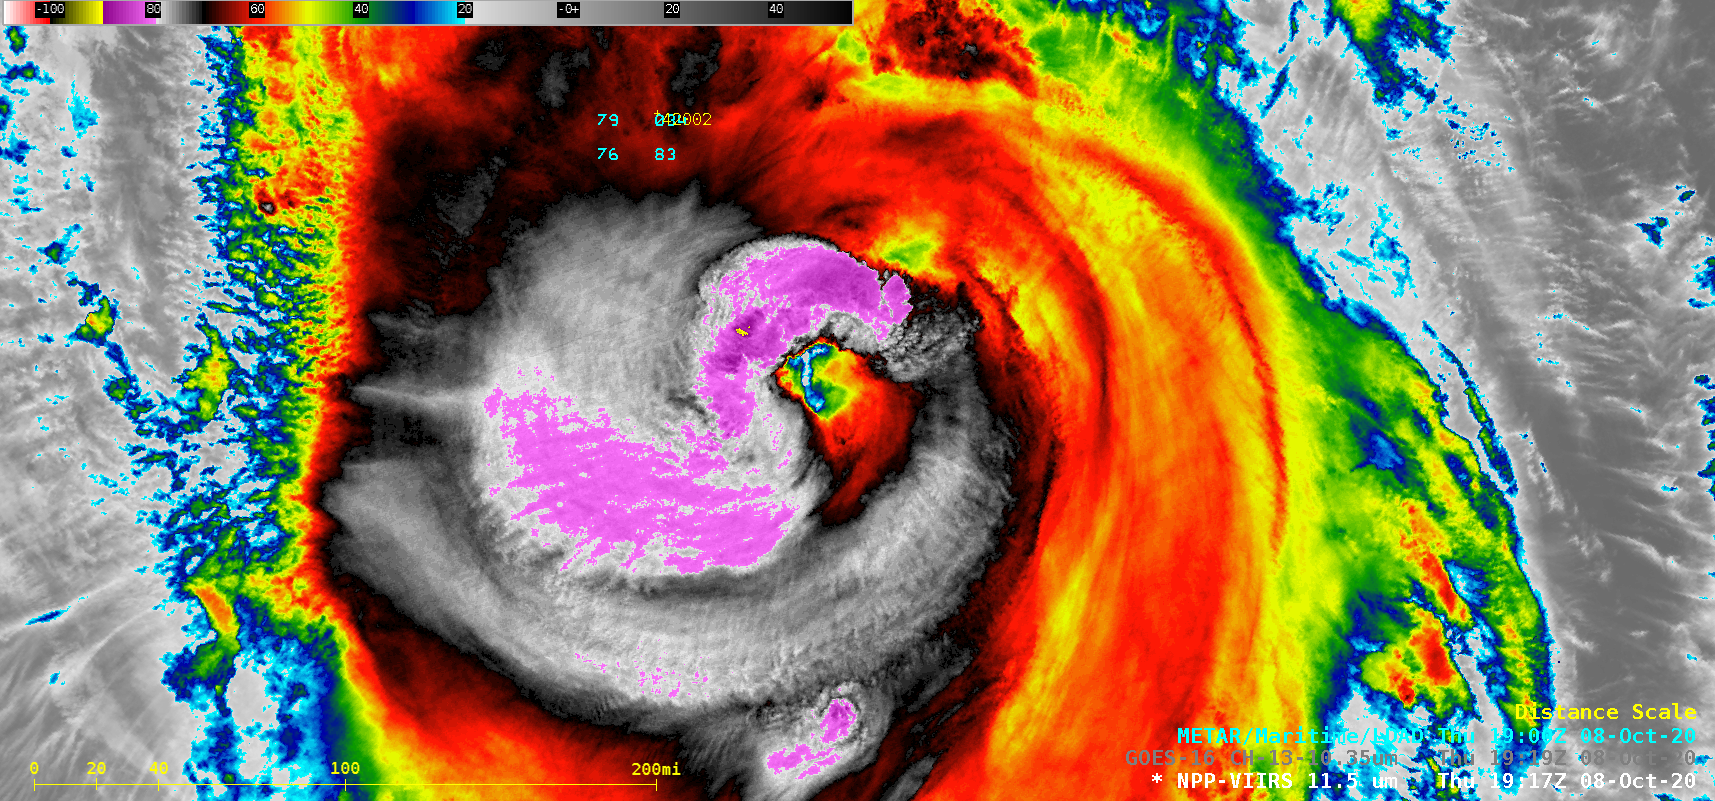
A toggle between Suomi NPP VIIRS Infrared Window (11.45 µm) and Visible (0.64 µm) images of Hurricane Delta shortly before it intensified to a Category 3 storm are shown below; the coldest cloud-top infrared brightness temperature at that time was -93.0ºC.
![Suomi NPP VIIRS Infrared Window (11.45 µm) and Visible (0.64 µm) images [click to enlarge]](https://cimss.ssec.wisc.edu/satellite-blog/images/2020/10/201008_1917utc_suomiNPP_viirs_infrared_visile_Hurricane_Delta_anim.gif)
Suomi NPP VIIRS Infrared Window (11.45 µm) and Visible (0.64 µm) images [click to enlarge]
In a t
ime-matched comparison of Infrared images from Suomi NPP and GOES-16
(below), the coldest cloud-top infrared brightness temperature sensed by GOES-16 was 5.6ºC warmer (-87.4ºC); note the small northwestward parallax displacement that is inherent with GOES-16 imagery over the Gulf of Mexico. The same color enhancement is applied to both images.
![Infrared images from Suomi NPP and GOES-16 [click to enlarge]](https://cimss.ssec.wisc.edu/satellite-blog/images/2020/10/201008_1919utc_suomiNPP_goes16_infrared_Hurricane_Delta_anim.gif)
Infrared images from Suomi NPP (11.45 µm) and GOES-16 (10.35 µm) [click to enlarge]
===== 09 October Update =====
![Suomi NPP VIIRS Infrared Window (11.45 µm) and Day/Night Band (0.7 µm) images [click to enlarge]](https://cimss.ssec.wisc.edu/satellite-blog/images/2020/10/201009_0734utc_suomiNPP_viirs_infraredWindow_dayNightBand_Hurricane_Delta_anim.gif)
Suomi NPP VIIRS Infrared Window (11.45 µm) and Day/Night Band (0.7 µm) images [click to enlarge]
In a toggle between Suomi NPP VIIRS Infrared Window (11.45 µm) and Day/Night Band (0.7 µm) images at 0734 UTC or 2:34 am CDT on 09 October
(above), the coldest cloud-top infrared brightness temperature was -93.8ºC (just northwest of the storm center).
1-minute GOES-16 Infrared and Visible images (below) showed Category 2 Hurricane Delta making landfall in southwestern Louisiana at 2300 UTC, producing wind gusts as high as 100 mph at Texas Point, Texas.
![GOES-16 “Clean” Infrared Window (10.35 µm) images (with and without an overlay of GLM Flash Extent Density) and “Red” Visible (0.64 µm) images [click to play animation | MP4]](https://cimss.ssec.wisc.edu/satellite-blog/images/2020/10/delta9_ir-20201009_230025.png)
GOES-16 “Clean” Infrared Window (10.35 µm) images (with and without an overlay of GLM Flash Extent Density) and “Red” Visible (0.64 µm) images [click to play animation | MP4]
The
MIMIC Total Precipitable Water product
(below) indicated that Hurricane Delta was transporting a large amount of moisture northward across the Gulf of Mexico —
rainfall totals included 15.64 inches at Evangeline Gardner, Louisiana.
![MIMIC Total Precipitable Water product [click to enlarge]](https://cimss.ssec.wisc.edu/satellite-blog/images/2020/10/201009_mimicTPW_Delta_landfall_anim.gif)
MIMIC Total Precipitable Water product [click to enlarge]
The
MIMIC-TC product
(below) showed the deterioration of the eye and eyewall structure as Delta approached the Gulf Coast.
MIMIC-TC product [click to enlarge]
===== 10 October Update =====
![Suomi NPP VIIRS True Color RGB images from 04 and 10 October [click to enlarge]](https://cimss.ssec.wisc.edu/satellite-blog/images/2020/10/201004_201010_suomiNPP_viirs_trueColorRGB_TX_LA_anim.gif)
Suomi NPP VIIRS True Color RGB images from 04 October and 10 October [click to enlarge]
A before (04 October) / after (10 October) comparison of Suomi NPP VIIRS True Color RGB images from the
VIIRS Today site
(above) revealed a marked increase of turbidity within the more shallow shelf waters of Texas and Louisiana, due to extensive mixing from the wind field associated with Delta. A comparison of VIIRS False Color images from those 2 days
(below) highlighted inland areas with significant flooding that resulted from heavy rainfall and/or storm surge
(darker shades of blue).
![Suomi NPP VIIRS False Color RGB images from 04 October and 10 October [click to enlarge]](https://cimss.ssec.wisc.edu/satellite-blog/images/2020/10/201004_201010_suomiNPP_viirs_falseColorRGB_TX_LA_anim.gif)
Suomi NPP VIIRS False Color RGB images from 04 October and 10 October [click to enlarge]
A GOES-16
River Flood Detection product viewed using
RealEarth (below) helped to quantify the severity of flooding resulting from the landfall of Delta.
![GOES-16 River Flood product [click to enlarge]](https://cimss.ssec.wisc.edu/satellite-blog/images/2020/10/201010_1900utc_goes16_flood.png)
GOES-16 River Flood Detection product valid at 1900 UTC on 10 October [click to enlarge]
View only this post
Read Less

![GOES-16 “Clean” Infrared Window (10.35 µm) images (with and without an overlay of GLM Flash Extent Density) and “Red” Visible (0.64 µm) images [click to play animation | MP4]](https://cimss.ssec.wisc.edu/satellite-blog/images/2020/10/201008_goes16_infrared_glmFlashExtentDensity_visible_Hurricane_Delta_anim.gif)
![GOES-16 “Clean” Infrared Window (10.35 µm) images (with and without an overlay of GLM Flash Extent Density) and “Red” Visible (0.64 µm) images [click to play animation | MP4]](https://cimss.ssec.wisc.edu/satellite-blog/images/2020/10/201009_goes16_infrared_glmFlashExtentDensity_visible_Hurricane_Delta_landfall_anim.gif)
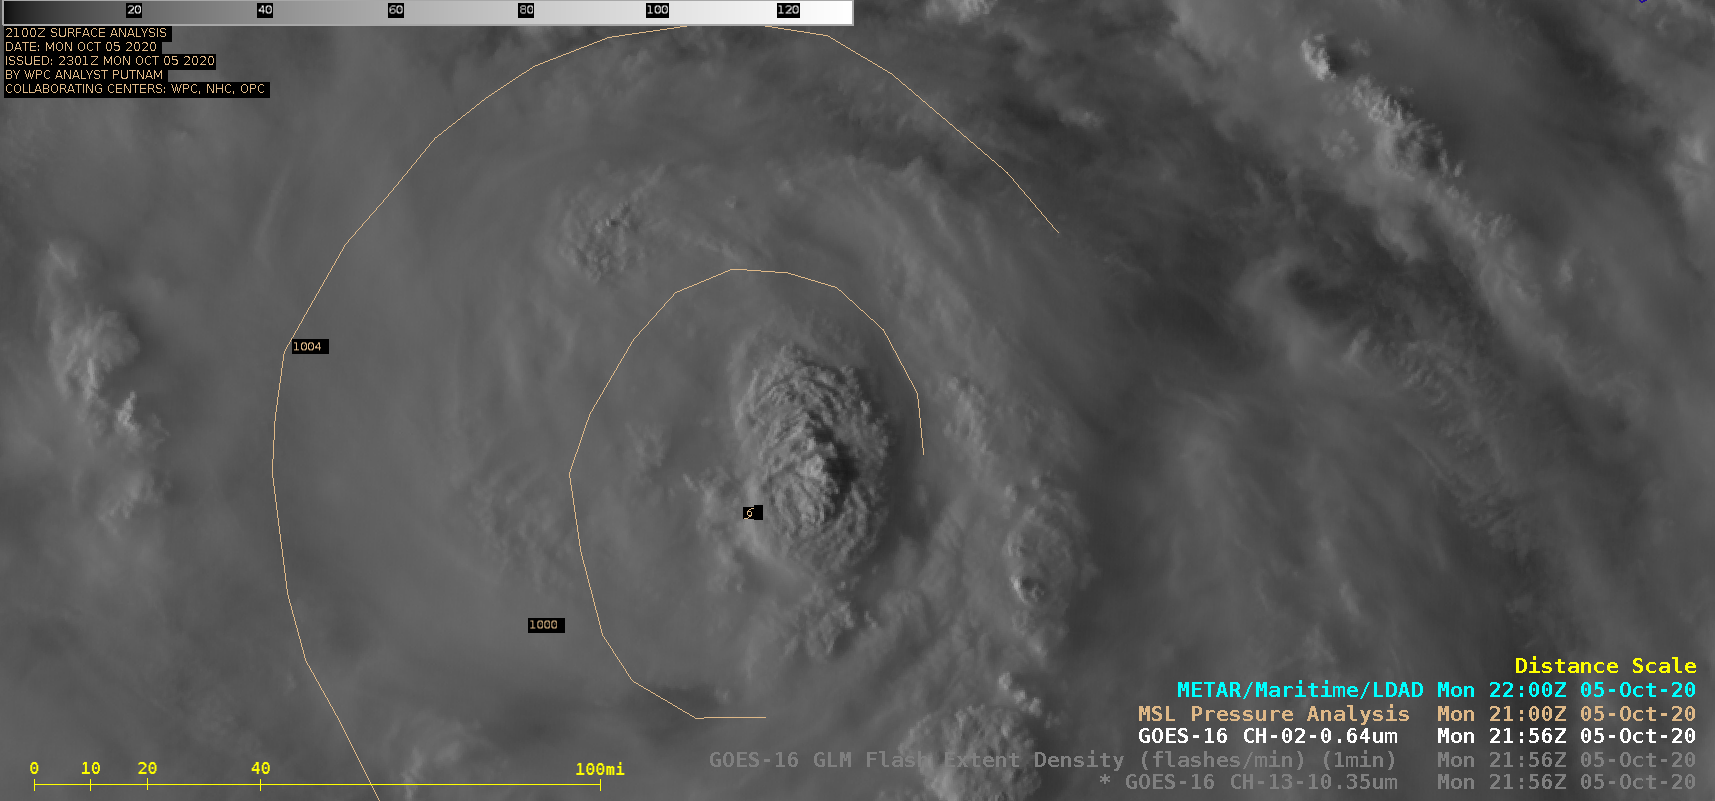

![GOES-16 “Clean” Infrared Window (10.35 µm) images (with an overlay of GLM Flash Extent Density) and "Red" Visible (0.64 µm) images at 2156 UTC [click to enlarge]](https://cimss.ssec.wisc.edu/satellite-blog/images/2020/10/201005_2156utc_goes16_visible_infrared_Delta_anim.gif)
![GOES-16 “Clean” Infrared Window (10.35 µm) images (with and without an overlay of GLM Flash Extent Density) and “Red” Visible (0.64 µm) images [click to play animation | MP4]](https://cimss.ssec.wisc.edu/satellite-blog/images/2020/10/201006_goes16_infrared_glmFlashExtentDensity_visible_Huricane_Delta_2_anim.gif)
![GOES-16 Infrared Window (11.2 µm) images, with an overlay of deep-layer wind shear [click to enlarge]](https://cimss.ssec.wisc.edu/satellite-blog/images/2020/10/201006_goes16_infrared_shear_Delta.gif)
![Suomi NPP VIIRS Infrared Window (11.45 µm) and Day/Night Band (0.7 µm) images [click to enlarge]](https://cimss.ssec.wisc.edu/satellite-blog/images/2020/10/201007_0632utc_suomiNPP_viirs_infraredWindow_dayNightBand_Hurricane_Delta_anim.gif)
![Infrared images from Suomi NPP and GOES-16 [click to enlarge]](https://cimss.ssec.wisc.edu/satellite-blog/images/2020/10/201007_0644utc_suomiNPP_goes16_infraredWindow_Hurricane_Delta_anim.gif)
![GOES-17 “Red” Visible (0.64 µm) and “Clean” Infrared Window (10.35 µm) images [click to play animation | MP4]](https://cimss.ssec.wisc.edu/satellite-blog/images/2020/10/201002_goes17_visible_infrared_Hurricane_Marie_anim.gif)
![GOES-17 Infrared Window (11.2 µm) images, with an overlay of deep-layer wind shear [click to enlarge]](https://cimss.ssec.wisc.edu/satellite-blog/images/2020/10/201002_goes17_infrared_shear_Marie_anim.gif)
![Infrared Window images from Suomi NPP (11.45 µm) and GOES-17 (10.35 µm) [click to enlarge]](https://cimss.ssec.wisc.edu/satellite-blog/images/2020/10/201003_0943utc_suomiNPP_goes17_infrared_Hurricane_Marie_anim.gif)
