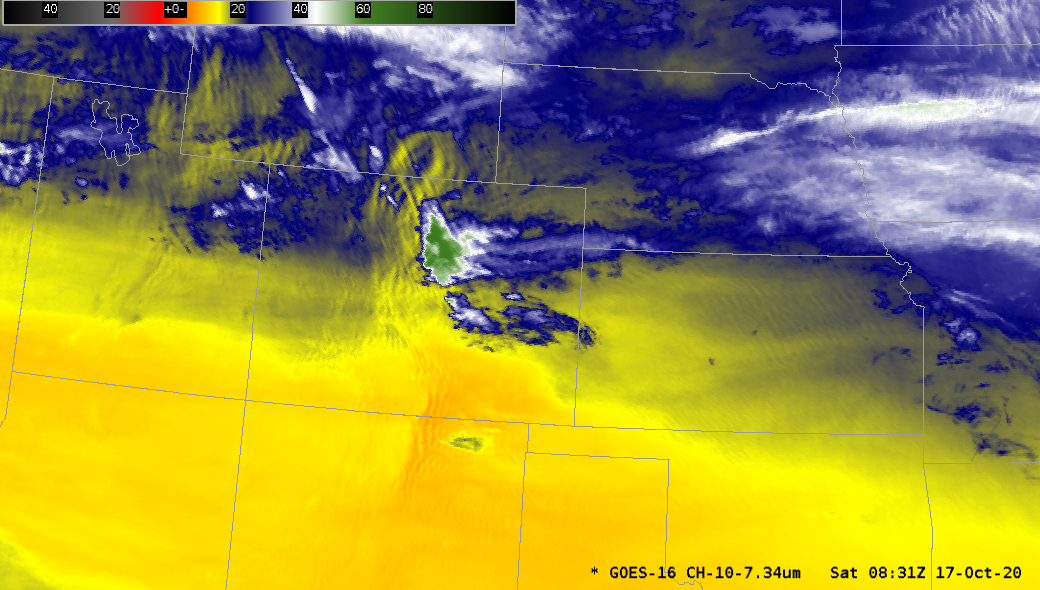
Low-level water vapor imagery, above, from early morning on 17 October 2020, shows the characteristics of strong low-level winds in the lee of the Colorado Rockies, namely a warm trench and herringbone-like structures that suggest turbulent flow. This region is near the Cameron Peak fire, a long-lived conflagration to the west of... Read More
GOES-16 Band 10 (7.3 µm) “Low-level water vapor” infrared imagery, 0831 – 1316 UTC (Click to animate)
Low-level water vapor imagery, above, from early morning on 17 October 2020, shows the characteristics of strong low-level winds in the lee of the Colorado Rockies, namely a warm trench and herringbone-like structures that suggest turbulent flow. This region is near the Cameron Peak fire, a long-lived conflagration to the west of Fort Collins (previous blog posts on this event are here, here and here).
Shortwave infrared imagery, below, captures the regions of hottest fire activity, both with Cameron Peak and with the newer East Troublesome fire to its southwest. Clouds moving down from the north impede the satellite view of the fires at the end of the animation.

GOES-16 Band 7 (3.9 µm) shortwave infrared imagery, 0921 – 1241 UTC, with surface observation plots (Click to animate)
NOAA-20 overflies Colorado twice daily; do the NUCAPS soundings produced from radiances observed by the CrIS (Cross-track Infrared Sounder) and ATMS (Advanced Technology Microwave Sounder) instruments on board NOAA-20 detect atmospheric structures (i.e., inversions) that trap energy and accompany downslope wind events? On 16 October, in the afternoon, NOAA-20 NUCAPS soundings, below, did not show inversions.
NOAA-20 NUCAPS Profiles at the locations indicated, at ~1900 UTC on 16 October 2020 (click to enlarge)
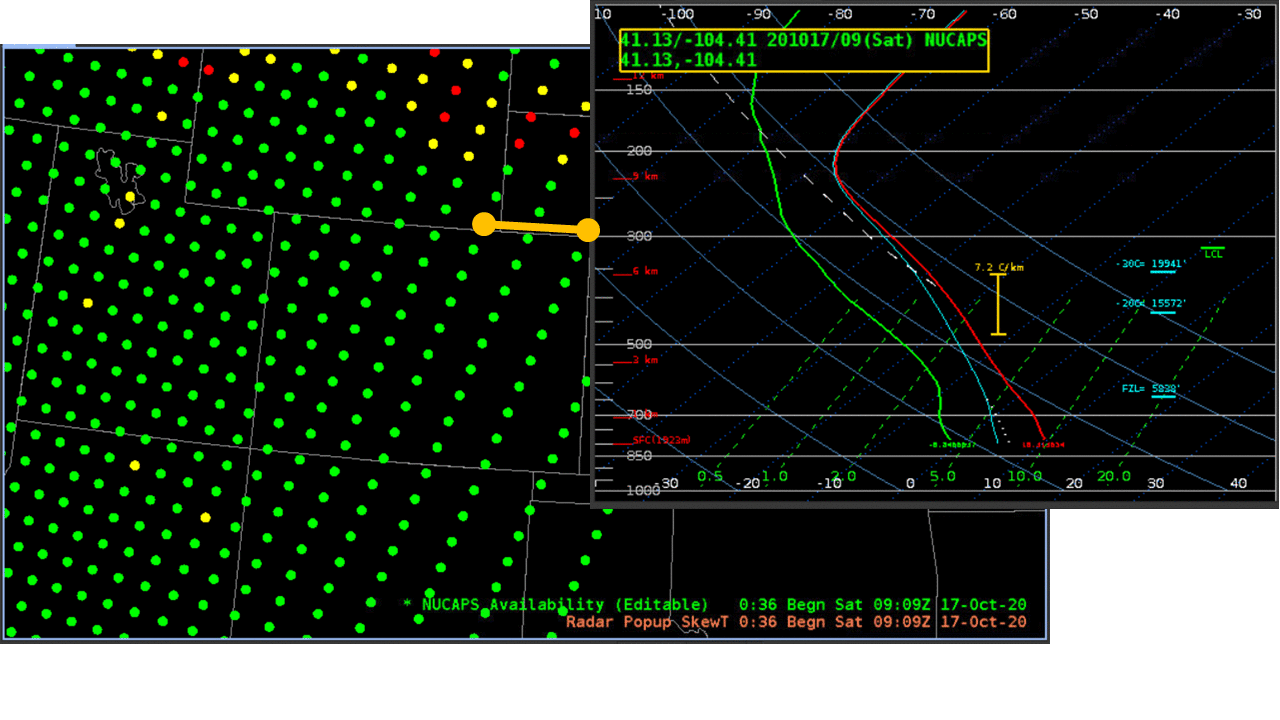
Similarly, NUCAPS profiles from the morning pass on 17 October, however, around 0900 UTC, did not show mid-tropospheric inversions over eastern Colorado, over the High Plains.

NOAA-20 NUCAPS Profiles at the locations indicated, at ~0900 UTC on 17 October 2020 (click to enlarge)
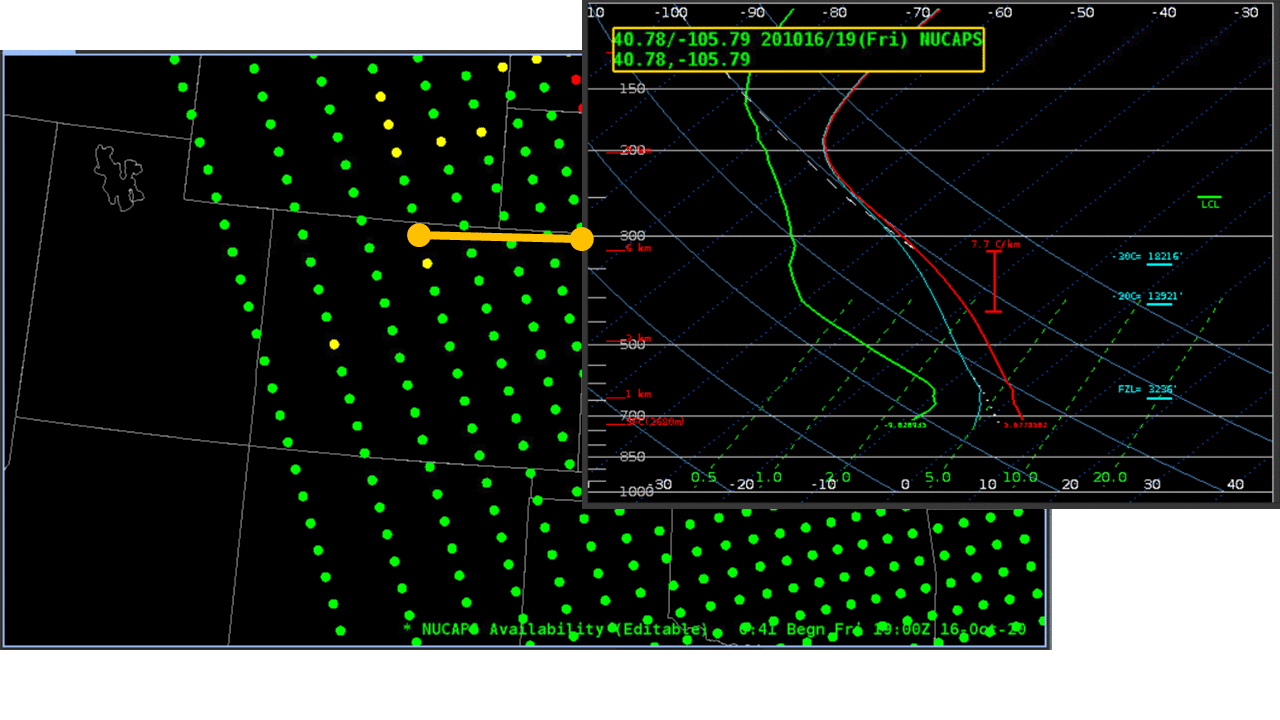
Some NUCAPS profiles upstream of the Front Range of the Rockies, however, showed ample evidence of inversions, especially in a region over central Colorado.
NOAA-20 NUCAPS Profiles at the locations indicated, at ~0900 UTC on 17 October 2020 (click to enlarge)
The 7.3 µm infrared image (Band 10, low-level water vapor), below, has turbulent structure near the regions where inversions were detected by NUCAPS.
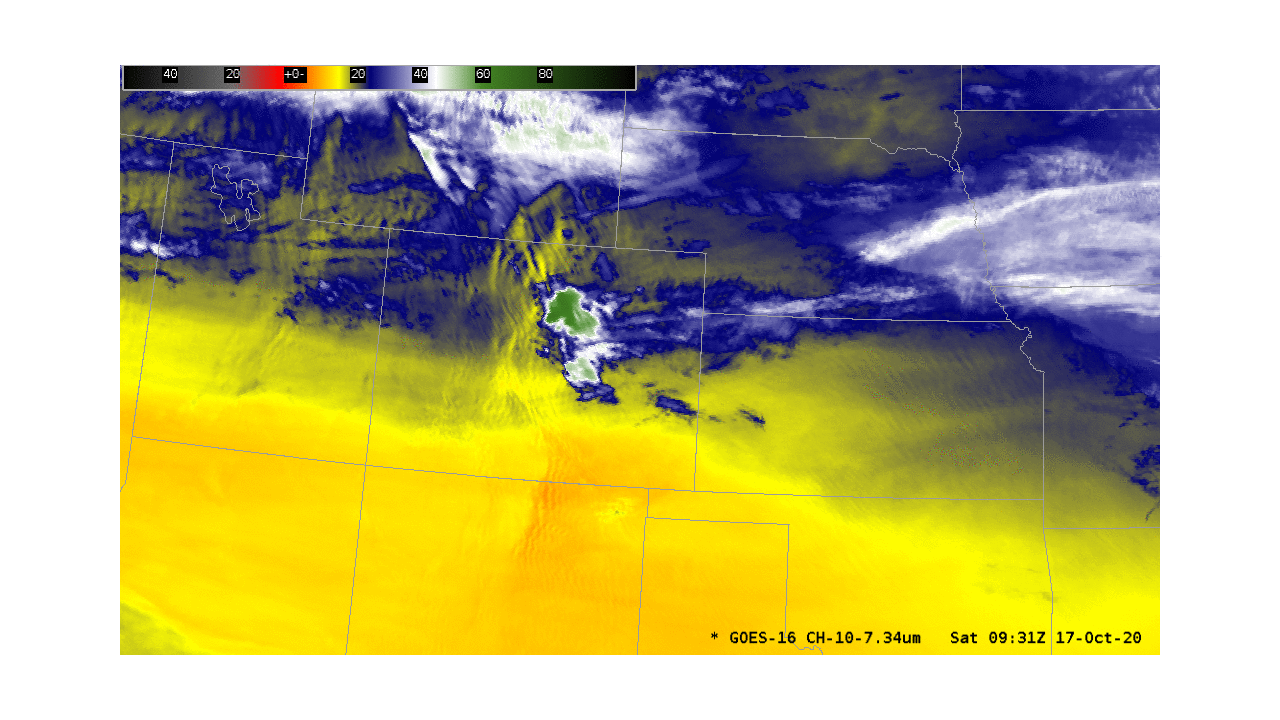
GOES-16 ABI Band 10 (7.3 µm) at 0931 UTC, 17 October 2020. The blue-circled region roughly corresponds to the region where NUCAPS profiles show a mid-tropospheric inversion consistent with downslope winds to the east (Click to enlarge)
A wind speed plot from the NCAR Mesa Lab in Boulder, below (source), shows the periodic strong and gusty winds on 17 October.

Wind speeds and gusts for the 24 hours ending 11:52 MDT (1652 UTC) on 17 October 2020 (Click to enlarge)
Use NUCAPS profiles to gauge the strength of the inversion that is associated with downslope events.
Thanks to Paul Schlatter, SOO at WFO BOU, for the idea for this blog post!
View only this post
Read Less
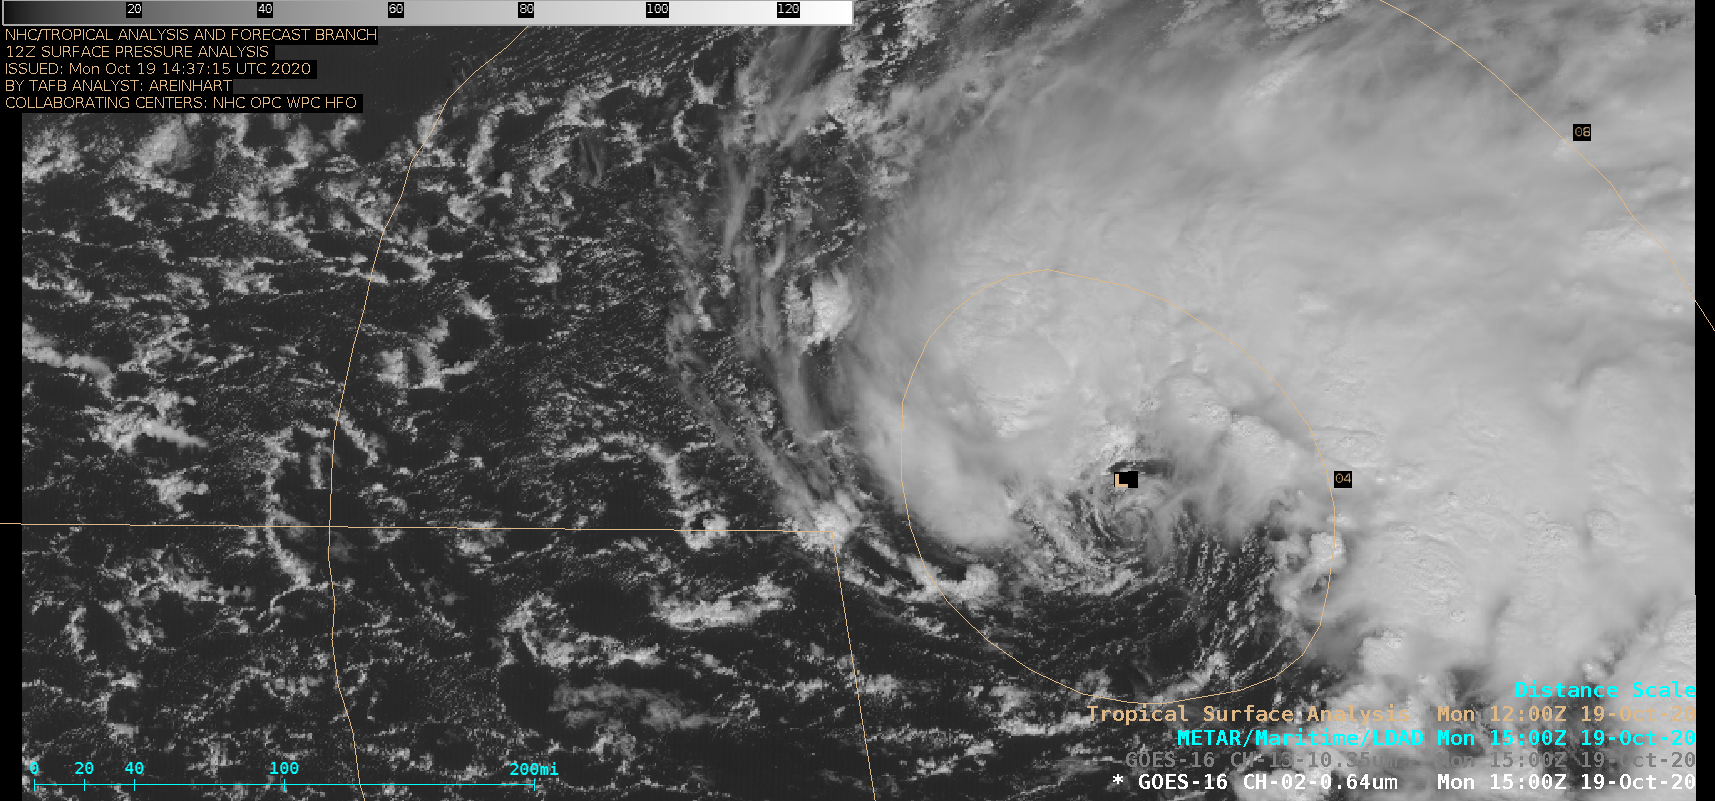
![GOES-16 “Red” Visible (0.64 µm) and “Clean” Infrared Window (10.35 µm) images [click to play animation | MP4]](https://cimss.ssec.wisc.edu/satellite-blog/images/2020/10/201019_goes16_visible_infrafred_TS_Epsilon_anim.gif)
![GOES-16 Visible image with plots of available NUCAPS profiles [click to enlarge]](https://cimss.ssec.wisc.edu/satellite-blog/images/2020/10/201019_1640utc_visible_nucapsAvailability.png)
![NUCAPS profile just southeast of the center of Tropical Storm Epsilon [click to enlarge]](https://cimss.ssec.wisc.edu/satellite-blog/images/2020/10/201019_16utc_nucaps_profile.png)
![GOES-16 “Red” Visible (0.64 µm) images, with overlays of deep-layer wind shear and GLM Flashes [click to enlarge]](https://cimss.ssec.wisc.edu/satellite-blog/images/2020/10/201019_goes16_visible_glm_shear_TS_Epsilon_anim.gif)
![MIMIC Total Precipitable Water and Saharan Air Layer product [click to enlarge]](https://cimss.ssec.wisc.edu/satellite-blog/images/2020/10/201019_mimicTPW_SAL_TS_Epsilon_anim.gif)
![Sea Surface Temperature and Ocean Heat Content [click to enlarge]](https://cimss.ssec.wisc.edu/satellite-blog/images/2020/10/201019_seaSurfaceTemperature_oceanHeatContent_TS_Epsilon_anim.gif)


![NOAA-20 Sea Surface Temperature product and Infrared Window (11.45 µm) images at 0843 UTC [click to enlarge]](https://cimss.ssec.wisc.edu/satellite-blog/images/2020/10/201016_0843utc_noaa20_seaSurfaceTemperature_infrared_ND_anim.gif)
![GOES-16 Day Cloud Phase Distinction RGB images [click to play animation | MP4]](https://cimss.ssec.wisc.edu/satellite-blog/images/2020/10/201017_goes16_dayCloudPhaseDistinctionRGB_MT_ND_snowfall_anim.gif)

