Kincade Fire in Northern California
![GOES-17 multi-panel images showing all 16 ABI spectral bands [click to play animation | MP4]](https://cimss.ssec.wisc.edu/satellite-blog/wp-content/uploads/sites/5/2019/10/191024_goes17_16panel_Kincade_Fire_CA_anim.gif)
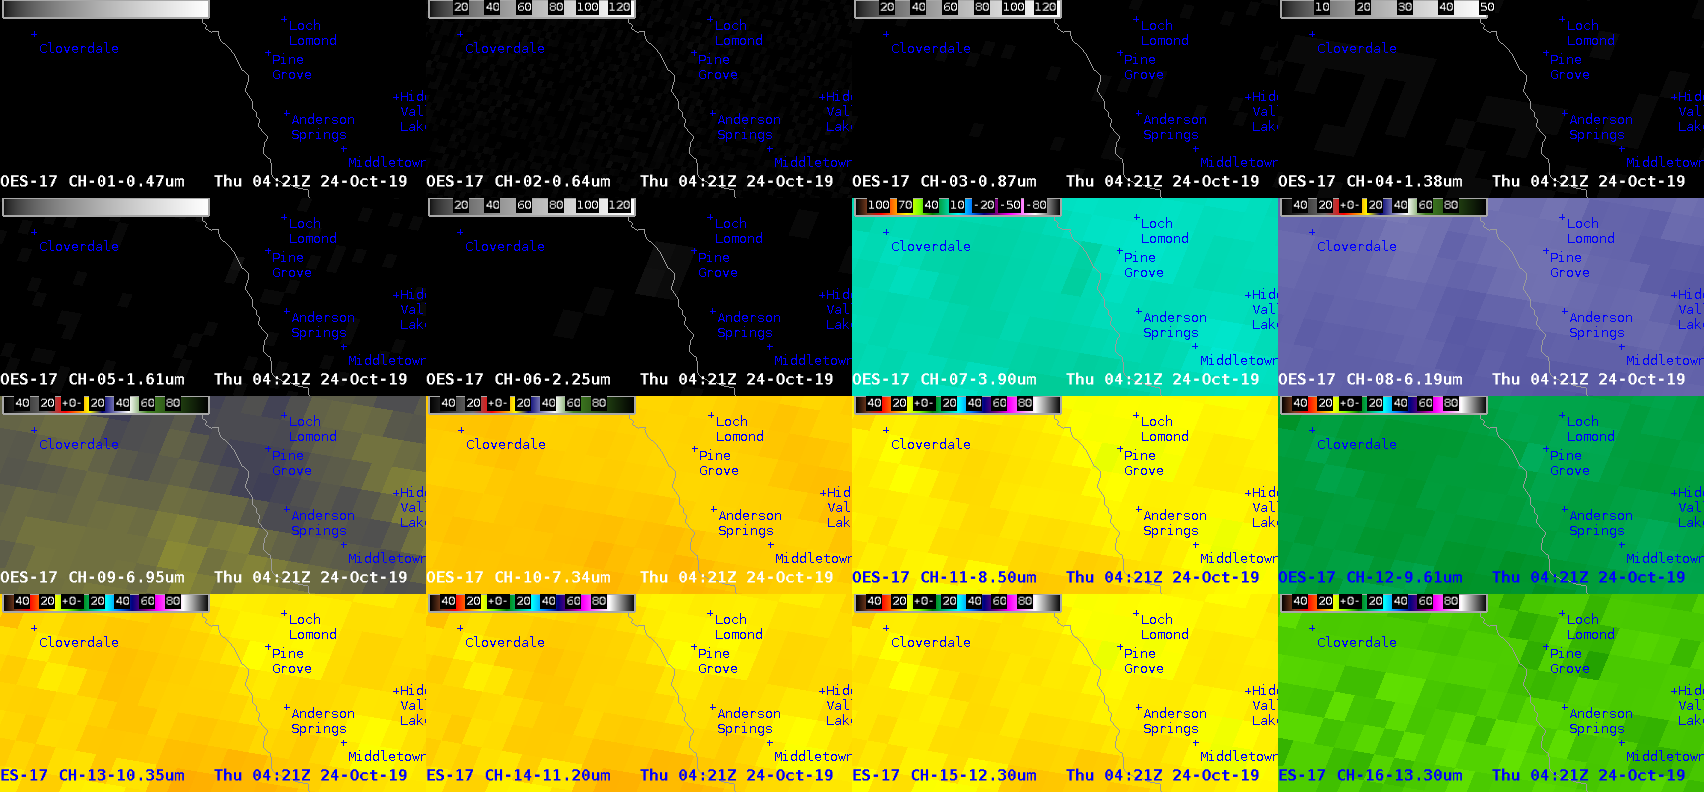
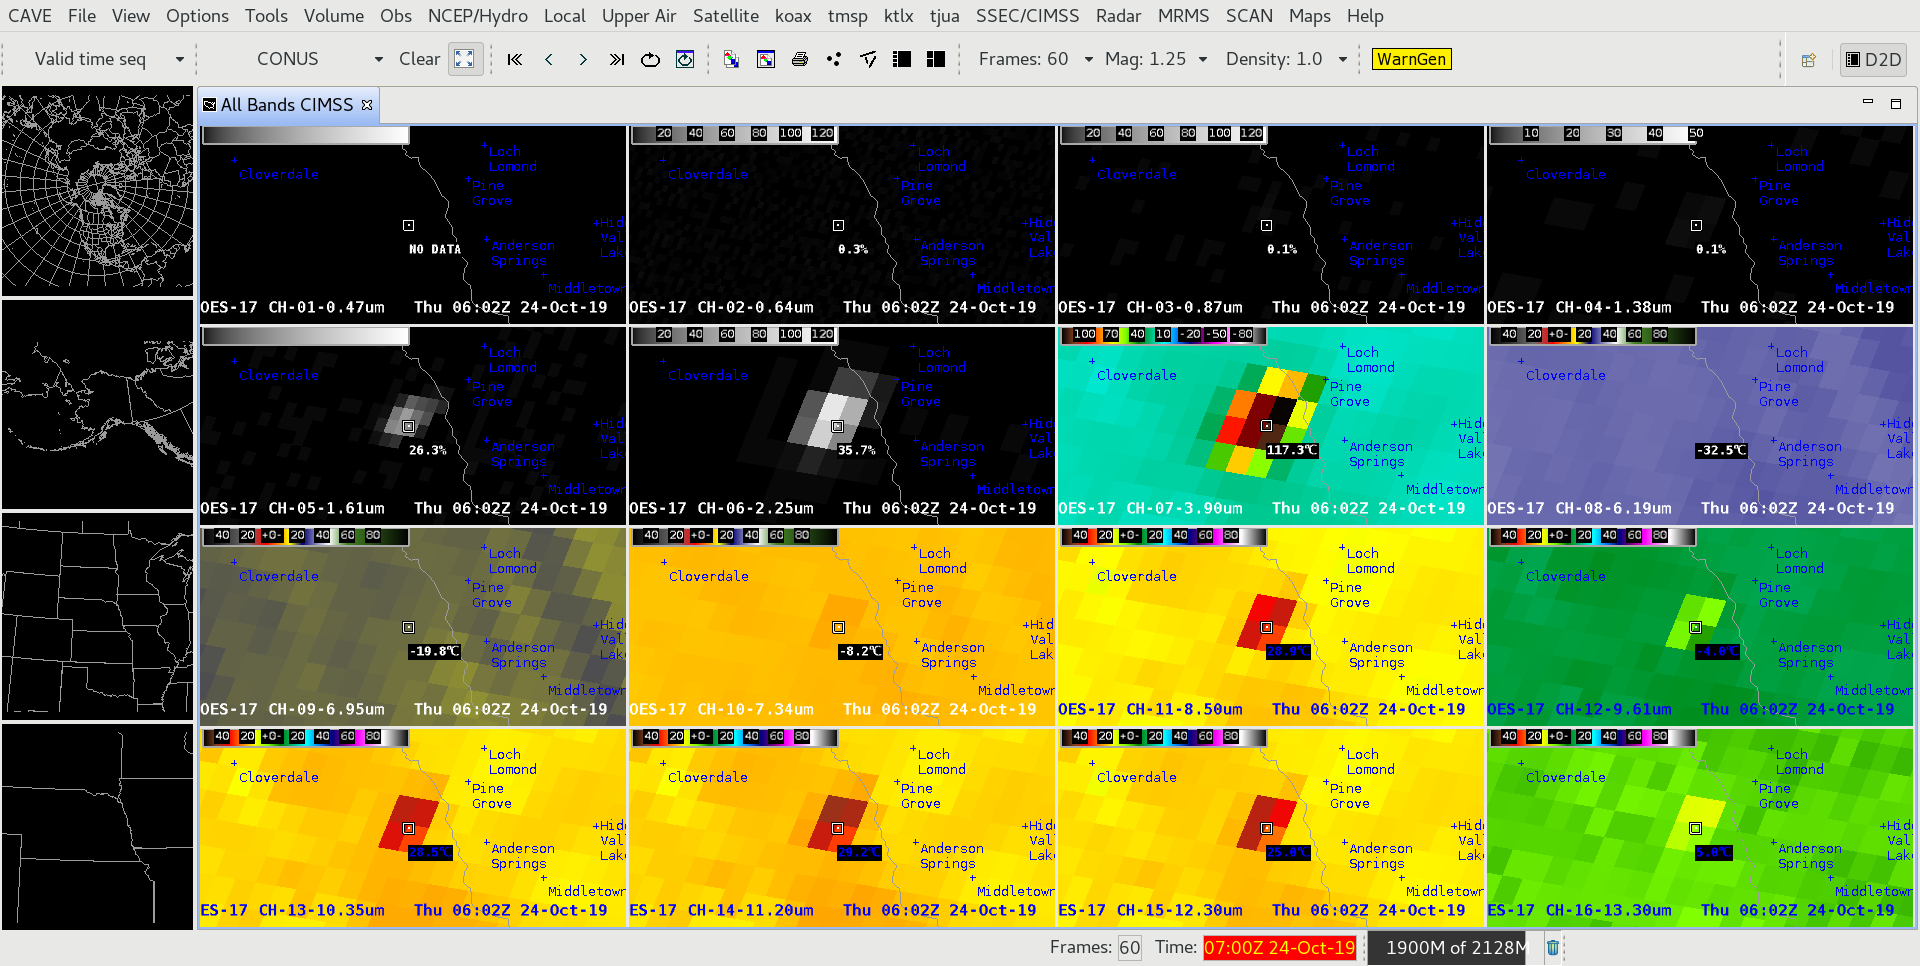
GOES-17 multi-panel images showing all 16 ABI spectral bands [click to play animation | MP4]
At times the fire’s hot thermal emissions were detected by 13 of the 16 spectral bands — including very subtle signatures in the “Red” Visible (0.64 µm), Near-Infrared “Vegetation” (0.86 µm) and “Cirrus” (1.38 µm), and Low-level Water Vapor (7.34 µm) bands (below). The hottest Shortwave Infrared (3.9 µm) brightness temperature observed was 138.7ºC (411.9 K), which is the saturation temperature for those ABI detectors.
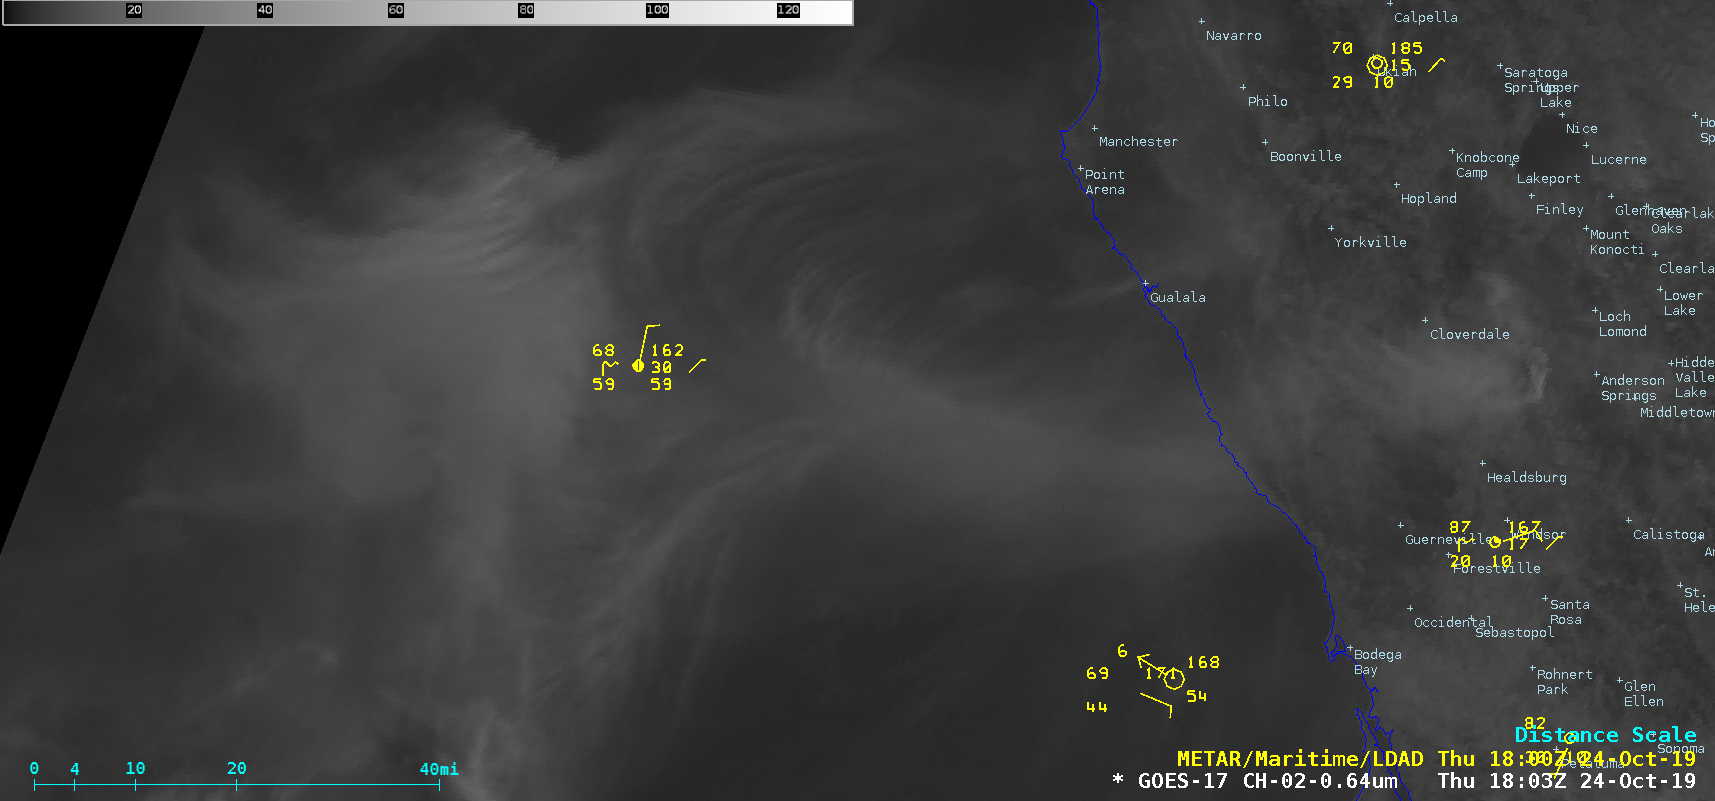
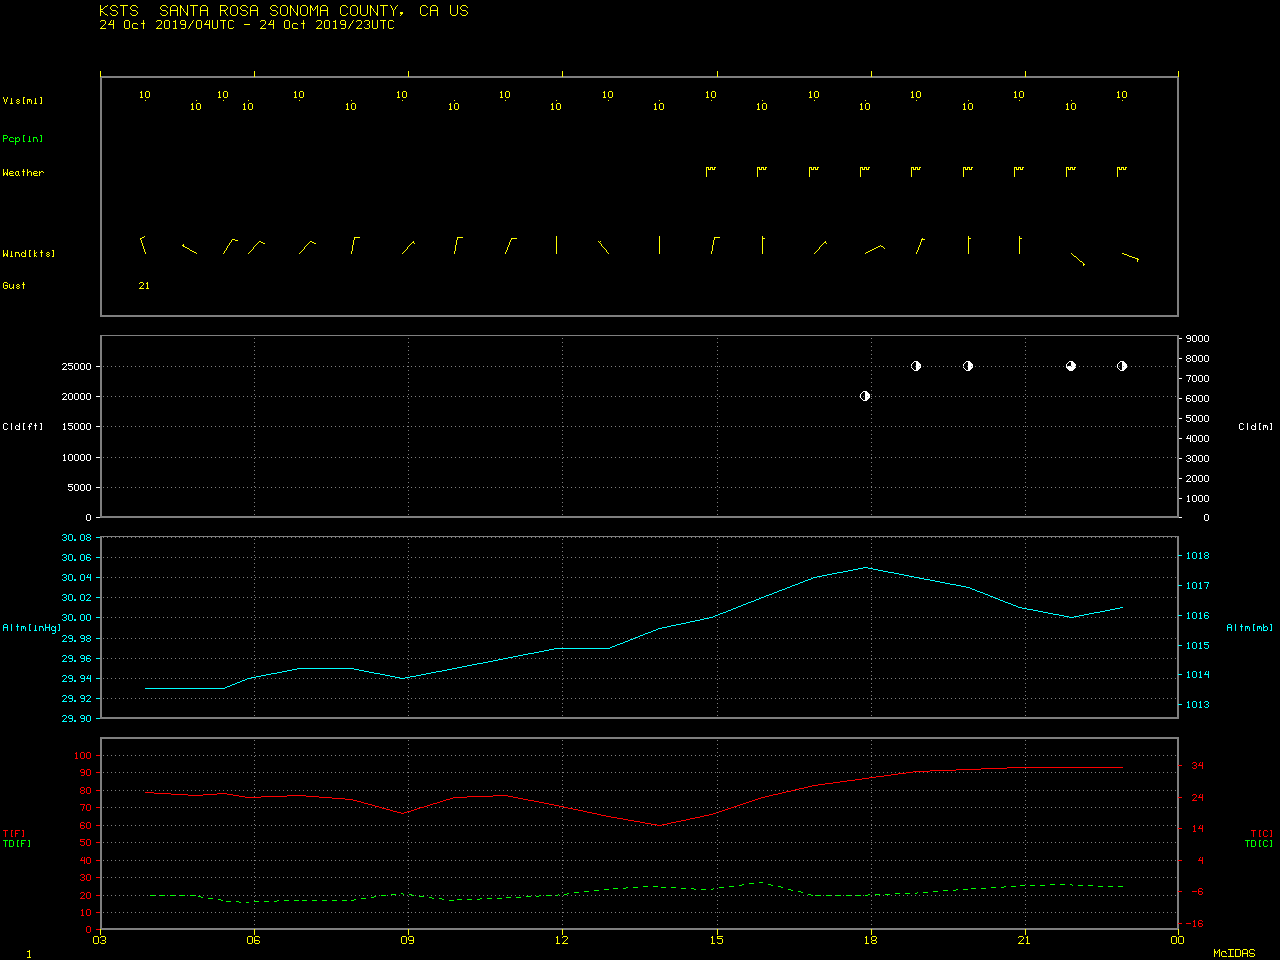
Since overlapping 1-minute GOES-17 Mesoscale Sectors provided 30-second Visible images, the westward transport of dense smoke from the fire source could be followed in great temporal and spatial detail (below). Note that a ship about 50 miles offshore reported smoke at 18 UTC. Just south of the dense plume, smoke was being reported at Santa Rosa — but the surface visibility remained at 10 miles.

GOES-17 “Red” Visible (0.64 µm) images, with surface reports plotted in yellow [click to play animation | MP4]
![GOES-17 CIMSS Natural Color RGB images [click to play animation | MP4]](https://cimss.ssec.wisc.edu/satellite-blog/wp-content/uploads/sites/5/2019/10/191024_goes17_naturalColorRGB_Kincade_Fire_CA_anim.gif)
GOES-17 CIMSS Natural Color RGB images [click to play animation | MP4]
![Terra MODIS True Color and False Color RGB images [click to enlarge]](https://cimss.ssec.wisc.edu/satellite-blog/wp-content/uploads/sites/5/2019/10/191024_1826utc_terra_modis_truecolor_falsecolor_CA_anim.gif)
Terra MODIS True Color and False Color RGB images at 1826 UTC [click to enlarge]
![Suomi NPP VIIRS Shortwave Infrared (3.74 µm) images at 0900 and 2023 UTC [click to enlarge]](https://cimss.ssec.wisc.edu/satellite-blog/wp-content/uploads/sites/5/2019/10/191024_suomiNPP_viirs_shortwaveInfrared_Kincade_Fire_CA_anim.gif)
Suomi NPP VIIRS Shortwave Infrared (3.74 µm) images at 0900 and 2023 UTC; the solid violet line west of the fire is California Highway 101. [click to enlarge]