GOES-16 (GOES-East) “Red” Visible (0.64 µm) and Shortwave Infrared (3.9 µm) images (above) showed the afternoon/evening smoke plume and the persistent thermal anomaly (cluster of hot pixels) associated with the Decker Fire burning just southwest of Salida, Colorado on 02 October 2019.A closer view of the fire was provided by a 4-panel comparison of GOES-16... Read More
![GOES-16 “Red” Visible (0.64 µm) and Shortwave Infrared (3.9 µm) images [click to play animation | MP4]](https://cimss.ssec.wisc.edu/satellite-blog/wp-content/uploads/sites/5/2019/10/co_vis-20191002_230123.png)
GOES-16 “Red” Visible (0.64 µm) and Shortwave Infrared (3.9 µm) images [click to play animation | MP4]
GOES-16
(GOES-East) “Red” Visible (
0.64 µm) and Shortwave Infrared (
3.9 µm) images
(above) showed the afternoon/evening smoke plume and the persistent thermal anomaly
(cluster of hot pixels) associated with the
Decker Fire burning just southwest of Salida, Colorado on
02 October 2019.
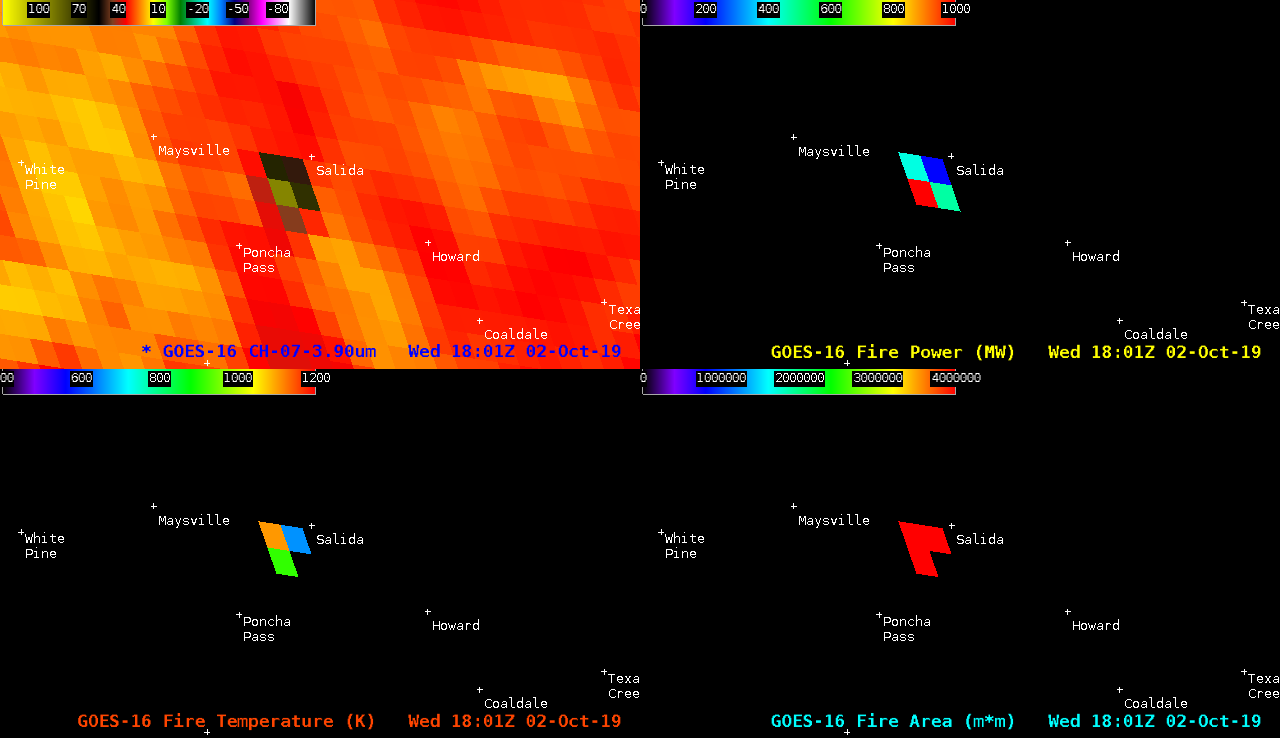
A closer view of the fire was provided by a 4-panel comparison of GOES-16 Shortwave Infrared, Fire Power, Fire Temperature and Fire Area products (below). More information on these GOES Fire Detection and Characterization Algorithm (FDCA) products can be found here. Windy conditions on this day — with sustained speeds of 20-30 mph and gusts to 46 mph — promoted rapid fire growth during the afternoon hours.
![GOES-16 Shortwave Infrared (3.9 µm), Fire Power, Fire Temperature and Fire Area [click to play animation | MP4]](https://cimss.ssec.wisc.edu/satellite-blog/wp-content/uploads/sites/5/2019/10/co_4panel-20191002_180123.png)
GOES-16 Shortwave Infrared (3.9 µm), Fire Power, Fire Temperature and Fire Area [click to play animation | MP4]
A sequence of VIIRS True Color Red-Green-Blue (RGB) and Infrared Window images from Suomi NPP and NOAA-20 as viewed using
RealEarth (below) showed the smoke plume and the fire’s thermal anomaly
(cluster of dark black pixels).
![VIIRS True Color RGB and Infrared Window (11.45 um) images from Suomi NPP and NOAA-20 [click to enlarge]](https://cimss.ssec.wisc.edu/satellite-blog/wp-content/uploads/sites/5/2019/10/191002_suomiNPP_noaa20_viirs_trueColorRGB_infraredWindow_Decker_Fire_CO_anim.gif)
VIIRS True Color RGB and Infrared Window (11.45 µm) images from Suomi NPP and NOAA-20 [click to enlarge]
A time series of surface observation data from the Salida Airport (identifier KANK, located just northwest of the fire) revealed southwesterly winds gusting to 20-29 knots as the dew point dropped to the -1 to -11ºF range — creating Relative Humidity values as low as 4% — during the afternoon hours
(below).
![Time series of surface observation data from Salida, Colorado [click to enlarge]](https://cimss.ssec.wisc.edu/satellite-blog/wp-content/uploads/sites/5/2019/10/191002_KANK_SFCMG.GIF)
Time series of surface observation data from Salida, Colorado [click to enlarge]
===== 03 October Update =====
![GOES-17 “Red” Visible (0.64 µm) and Shortwave Infrared (3.9 µm) images [click to play animation | MP4]](https://cimss.ssec.wisc.edu/satellite-blog/wp-content/uploads/sites/5/2019/10/co_swir-20191003_221227.png)
GOES-17 “Red” Visible (0.64 µm) and Shortwave Infrared (3.9 µm) images [click to play animation | MP4]
The Decker Fire continued to burn on 03 October, as seen using 1-minute
Mesoscale Domain Sector GOES-17 “Red” Visible and Shortwave Infrared images
(above). Although surface winds were still gusting as high as 30 knots at Salida, additional boundary layer moisture (dew points were in the 20s F) helped to slow the rate of fire growth compared to the previous day. The southeasterly winds transported some low-altitude smoke toward Salida, reducing the visibility to 5-7 miles at times
(below).
![Time series of surface observation data from Salida, Colorado [click to enlarge]](https://cimss.ssec.wisc.edu/satellite-blog/wp-content/uploads/sites/5/2019/10/191003_KANK_SFCMG.GIF)
Time series of surface observation data from Salida, Colorado [click to enlarge]
A comparison of GOES-16
(GOES-East) and GOES-17
(GOES-West) Shortwave Infrared images with topography
(below) demonstrated t
he effect of large satellite viewing angles on apparent fire location in areas of rugged terrain — note the offset in the position of the Decker Fire thermal anomaly between the 2 satellites (the viewing angle of the fire from each satellite is about 53 degrees).
![GOES-16 and GOES-17 Shortwave Infrared (3.9 µm) images, with topography [click to play animation | MP4]](https://cimss.ssec.wisc.edu/satellite-blog/wp-content/uploads/sites/5/2019/10/co_swir_g16-20191003_220124.png)
GOES-16 and GOES-17 Shortwave Infrared (3.9 µm) images, with topography (highways are plotted in cyan) [click to play animation | MP4]
View only this post
Read Less

![Suomi NPP VIIRS Visible (0.64 µm), Near-Infrared (1.61 µm), Shortwave Infrared (3.74 µm) and Infrared Window (11.45 µm) images [click to enlarge]](https://cimss.ssec.wisc.edu/satellite-blog/wp-content/uploads/sites/5/2019/10/191006_1918utc_suomiNPP_visible_nearInfrared_shortwaveInfrared_infraredWindow_WI_IL_aircraft_dissipation_trails_anim.gif)
![Time lapse of west-facing AOSS rooftop camera images [click to play YouTube video]](https://cimss.ssec.wisc.edu/satellite-blog/wp-content/uploads/sites/5/2019/10/191006_west_camera.png)
![Time lapse of east-facing AOSS rooftop camera images [click to play YouTube video]](https://cimss.ssec.wisc.edu/satellite-blog/wp-content/uploads/sites/5/2019/10/191006_east_camera.png)
![GOES-16 “Red” Visible (0.64 µm, top) and “Clean” Infrared Window (10.35 µm, bottom) images [click to play animation | MP4]](https://cimss.ssec.wisc.edu/satellite-blog/wp-content/uploads/sites/5/2019/10/191003_goes16_visible_infrared_Bermuda_orphan_anvil_anim_2.gif)
![GOES-16 “Red” Visible (0.64 µm) and “Clean” Infrared Window (10.35 µm) images at 2301 UTC [click to enlarge]](https://cimss.ssec.wisc.edu/satellite-blog/wp-content/uploads/sites/5/2019/10/191003_2301utc_goes16_visible_infrared_Bermuda_orphan_anvil_anim.gif)
![Plot of 00 UTC rawinsonde data from Cocoa Beach, Florida [click to enlarge]](https://cimss.ssec.wisc.edu/satellite-blog/wp-content/uploads/sites/5/2019/10/191004_00utc_kxmr_raob_spc.png)
![GOES-16 Low-level (7.3 µm, bottom), Mid-level (6.9 µm, middle) and Upper-level (6.2 µm, top) Water Vapor images [click to play animation | MP4]](https://cimss.ssec.wisc.edu/satellite-blog/wp-content/uploads/sites/5/2019/10/191003_goes16_waterVapor_Bermuda_orphan_anvil_anim.gif)
![GOES-16 “Red” Visible (0.64 µm) and Shortwave Infrared (3.9 µm) images [click to play animation | MP4]](https://cimss.ssec.wisc.edu/satellite-blog/wp-content/uploads/sites/5/2019/10/191002_goes16_visible_shortwaveInfrared_Decker_Fire_CO_anim.gif)
![GOES-16 Shortwave Infrared (3.9 µm), Fire Power, Fire Temperature and Fire Area [click to play animation | MP4]](https://cimss.ssec.wisc.edu/satellite-blog/wp-content/uploads/sites/5/2019/10/191002_goes16_shortwaveInfrared_firePower_fireTemperature_fireArea_Decker_Fire_CO_anim.gif)
![GOES-17 “Red” Visible (0.64 µm) and Shortwave Infrared (3.9 µm) images [click to play animation | MP4]](https://cimss.ssec.wisc.edu/satellite-blog/wp-content/uploads/sites/5/2019/10/191003_goes17_visible_shortwaveInfrared_Decker_Fire_CO_anim.gif)
![GOES-16 and GOES-17 Shortwave Infrared (3.9 µm) images, with topography [click to play animation | MP4]](https://cimss.ssec.wisc.edu/satellite-blog/wp-content/uploads/sites/5/2019/10/191003_goes16_goes17_shortwaveInfrared_Decker_Fire_CO_anim.gif)
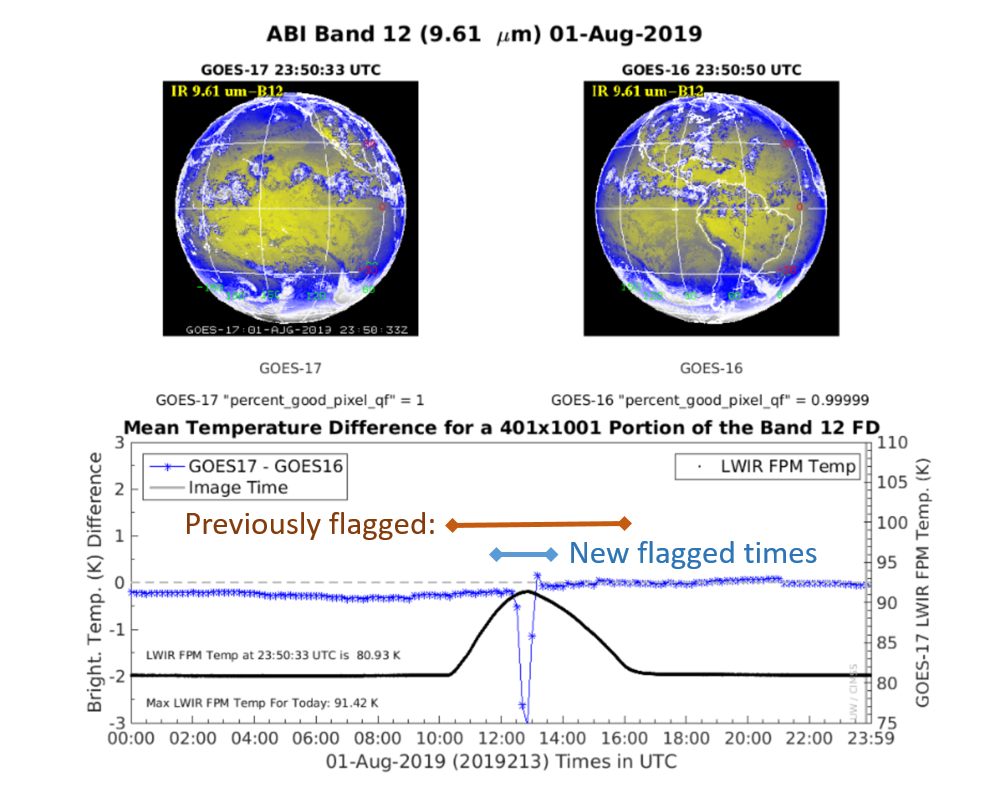
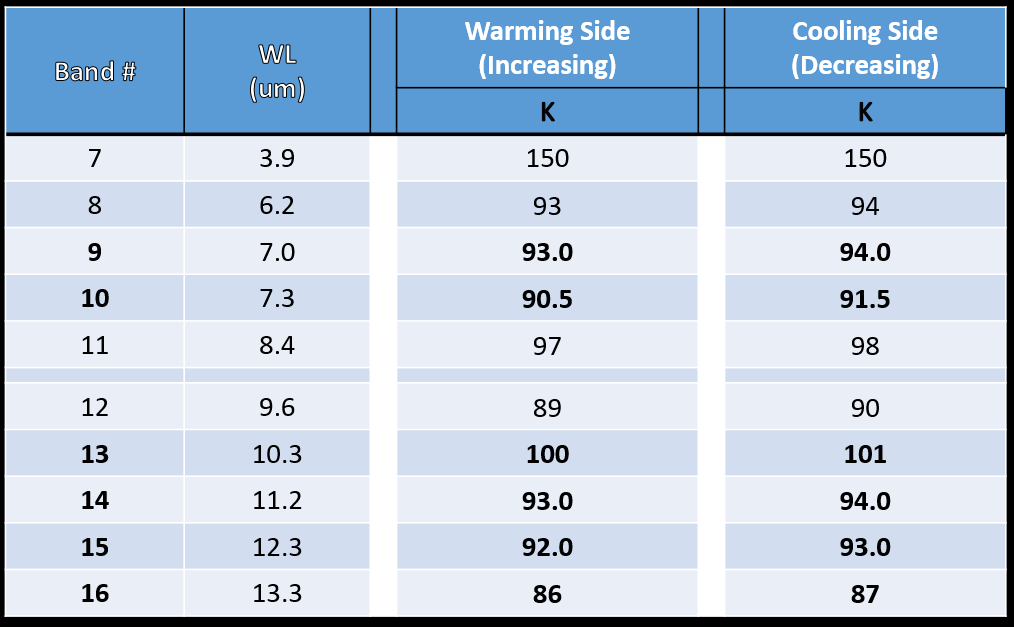
![Table of updated Temperature Quality Data Flag thresholds [click to enlarge]](https://cimss.ssec.wisc.edu/satellite-blog/wp-content/uploads/sites/5/2019/08/190808_tqdf_table.png)
