
NOAA-Unique Combined Atmospheric Processing System (NUCAPS) vertical profiles provide useful information derived from data from CrIS and ATMS instruments on board both Suomi-NPP and NOAA-20. Infrared Sounder information from CrIS gives profiles in clear/partly cloud regions, and ATMS supplies information in regions that are uniformly cloudy. (Click here for more... Read More
Temperature at 707 hPa at 0621 UTC on 20 September 2019, from NUCAPS profiles (Click to enlarge)
NOAA-Unique Combined Atmospheric Processing System (NUCAPS) vertical profiles provide useful information derived from data from CrIS and ATMS instruments on board both Suomi-NPP and NOAA-20. Infrared Sounder information from CrIS gives profiles in clear/partly cloud regions, and ATMS supplies information in regions that are uniformly cloudy. (Click here for more information on NUCAPS profiles in AWIPS (profiles are also available here) ; there are also CIMSS Blog entries on NUCAPS vertical profiles at this link, and at this link from the Hazardous Weather Testbed).
Polar2Grid is a Python-based data reader/converter designed as part of the Community Satellite Processing Package (CSPP) for Direct Broadcast data (such as found at this site); it also works with data downloaded from NOAA CLASS.
NUCAPS vertical profiles can be used to create horizontal fields using data from pressure levels at each sounding location — each sounding generates values at the same levels that are present in the radiative transfer model used in retrieval that creates data (including levels at 852.78, 706.57, 496.6, 300 mb). Polar2Grid can read these levels, but will not interpolate in the vertical (separate processing could be created for that).
The data that is downloaded (you might have to untar the data) from NOAA CLASS (choose “JPSS Sounder Products (JPSS_SND)” in the drop-down menu) will include file names that look something like this:
NUCAPS-EDR_v2r0_npp_s201909200622390_e201909200623090_c201909200758180.nc
The file above refers to an Environmental Data Record (EDR) from Suomi NPP (npp is in the filename; if these data were from NOAA-20, ‘j01’ would be there instead); the files contains data from 20 September 2019, starting at 0622 and ending at 0623 UTC. You might also see files with v1r0 — this flag distinguishes between NUCAPS 3 (v1r0) and NUCAPS 4.3 (v2r0). Polar2Grid will read both.
After ordering and downloading the data from NOAA CLASS, and downloading and installing the Polar2Grid data, use polar2grid to create a field (in this case, using multiple EDRs between 0620 and 0650 UTC that have been downloaded into the /data-hdd/NUCAPSFromCLASS/ directory:
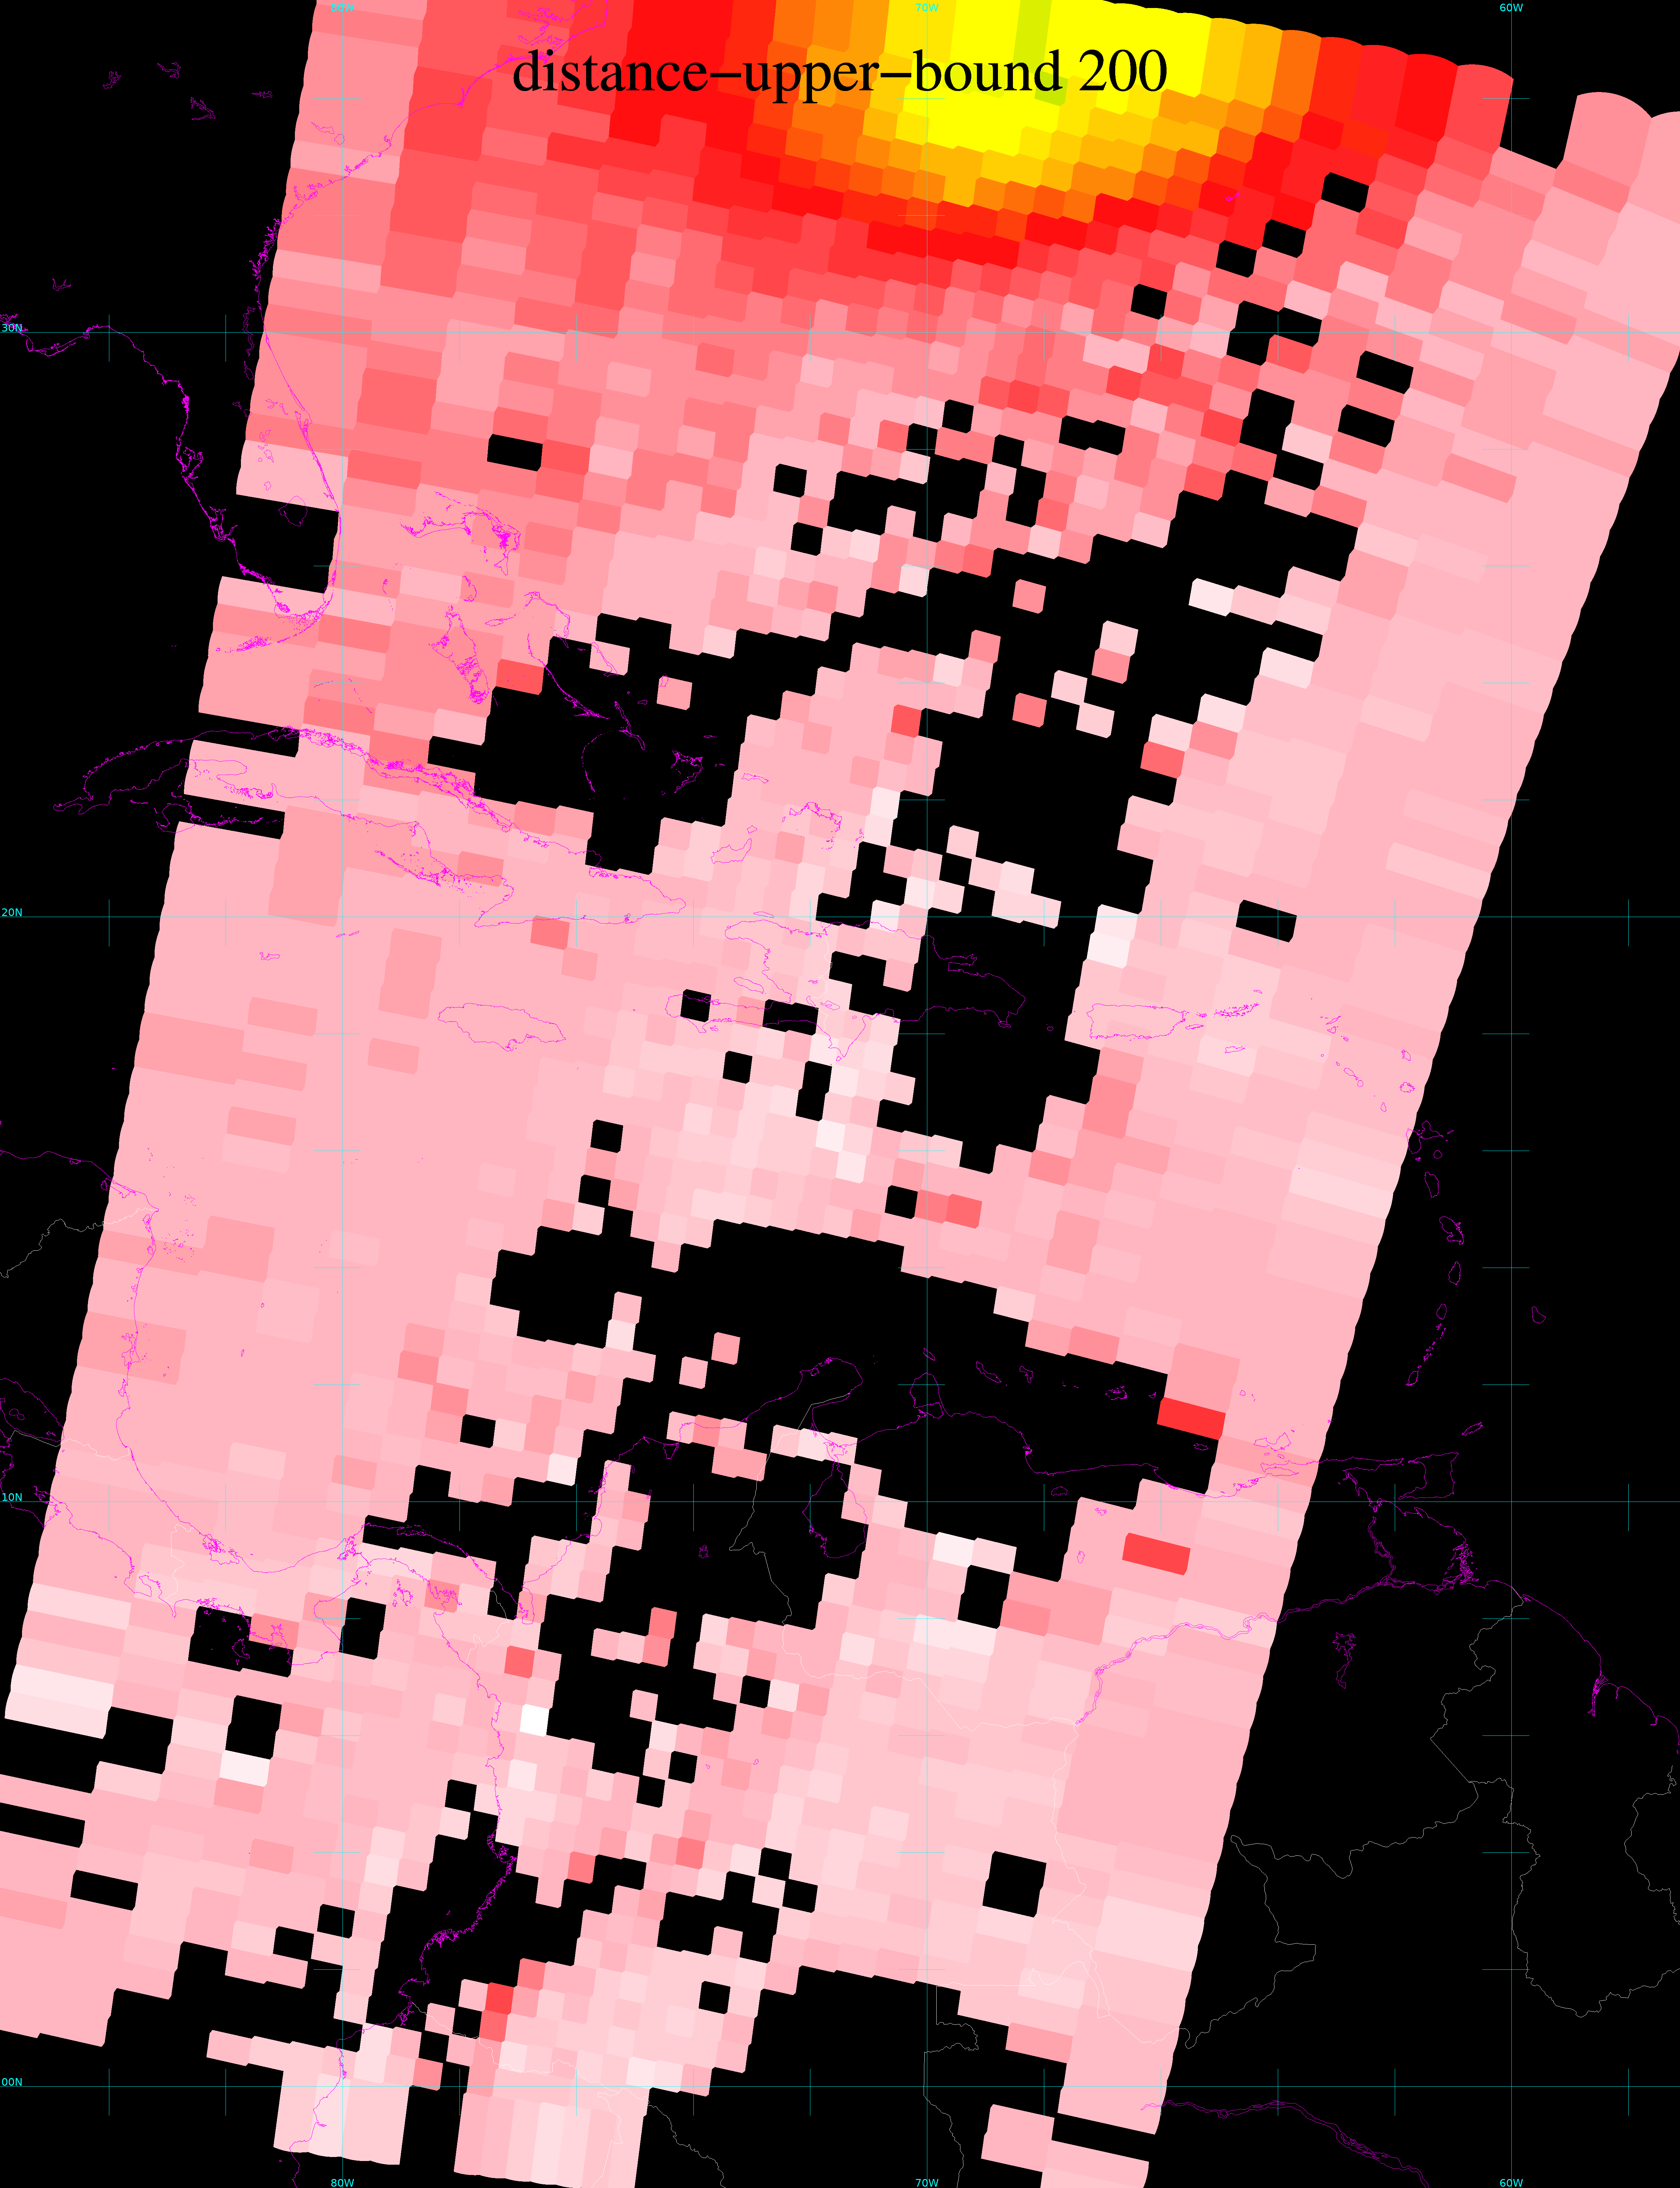
$POLAR2GRID_HOME/bin/polar2grid.sh nucaps gtiff -p Temperature_707mb –grid-coverage 0 -vvv -f /data-hdd/NUCAPSFromCLASS/NUCAPS-EDR_v2r0_npp_s2019092006*.nc –rescale-configs Temperature.ini –distance-upper-bound 200
$POLAR2GRID_HOME has been defined using the unix export function, and it tells the package into which directory Polar2Grid was installed. ‘nucaps gtiff’ tells the software that it will be reading nucaps data and outputting a geotiff file. The ‘-p’ flag controls which product is being created, in this case Temperature at 707 mb — the integer value closest to the 706.57 mb level in the Radiative Transfer Model (the valid pressure values can be determined by inspecting the netCDF file and finding “Pressure” values). (Other variables that can be displayed are listed at this website). The ‘-f’ flag directs the software to the directory holding the downloaded data; –distance-upper-bound 200 controls how far a data point extends its influence. By default Polar2Grid will automatically rescale fields based on the data’s maximum/minimum. To control this, create a file such as Temperature.ini, and include –rescale-configs flag. The Temperature.ini file used is below:
[rescale:temperature]
data_kind=air_temperature
method=linear
min_in=200.0
max_in=320.0
The output of the polar2grid invocation above will be a geotiff file: npp_nucaps_Temperature_707mb_20190920_062135_wgs84_fit.tif ; note that the time/day are contained within the filename, as well as the satellite, parameter and level.
Colormaps can be applied to the geotiffs with the add_colormaps.sh script:
$POLAR2GRID_HOME/bin/add_colormap.sh $POLAR2GRID_HOME/colormaps/T200_320.cmap npp_nucaps_Temperature_707mb_20190920_062135_wgs84_fit.tif
This will overwrite the greyscale tif file with a color-enhanced image controlled by the specified color map. In this case, I created a colormap that spans from 200 to 320 K, the wide range of data allowed in the Temperature.ini file. That cmap is shown below.
#0,128,0,127,255
# This is a cmap for temperatures from 200 to 320 K
0,0,0,0,0
1,75,0,130,255
# 75,0,130 is deep indigo — at the cold end
85,0,5,75,255
# 85 is at about 240 K — 1/3rd of the way from 200-320, 1/3rd of the way from 0-255
# 0,5,75 is a deep blue
129,0,200,200,255
# 129 is half-ish way from 1-255, so 260 K
# 0,200,200 is darkish cyan
# 140 is at about 265, 0, 150, 0 is a darkish green
140,0,150,0,255
# 155 is about 273, 255, 255, 0 is yellow
155,255,255,0,255
# 166 is about 278, 5K, 255,15,15 is red
166,255,15,15,255
# 176 is about 283 K, 255,182,193 is pink
176,255,182,193,255
# 186 is about 288 K, white
186,255,255,255,255
# 255 is at 320 K — slide from white at 288 K to grey at 320 K
255,127,127,127,255
Finally, apply a map to the tif file using the ‘add_coastlines.sh’ script. I usually move the color-enhanced tif file into the $POLAR2GRID_HOME/bin directory to do this, and for this case executed this command:
$POLAR2GRID_HOME/bin/add_coastlines.sh npp_nucaps_Temperature_707mb_20190920_062135_wgs84_fit.tif –coastlines-resolution=f –coastlines-level=6 –coastlines-outline=’magenta’ –add-coastlines –add-grid –add-borders –borders-level 1 –borders-resolution h
This will create a .png file. I’ve done this with two 707-mb temperature fields, with different –distance-upper-bound values: 200, and 100, as indicated. They are toggling together at the top of this blog post.
Polar2Grid v 2.3 (coming soon!) will allow the inclusion of a colorbar in the imagery. Polar2Grid documentation can be found here.
Update: November 2021.
Polar2Grid v 3.0 is slated to be released in late 2021/early 2022. Some features discussed above have been deprecated in the latest version. A new blog post will be forthcoming once the new version is released.
View only this post
Read Less
![GOES-16 Low-level (7.3 µm, left), Mid-level (6.9 µm, center) and Upper-level (6.2 µm, right) Water Vapor images, with plots of surface wind barbs and gusts in knots [click to play animation | MP4]](https://cimss.ssec.wisc.edu/satellite-blog/wp-content/uploads/sites/5/2019/10/191010_goes16_waterVapor_winds_gusts_Plains_cold_front_anim.gif)
![GOES-16 "Red" Visible (0.64 µm, left), Mid-level Water Vapor (6.9 µm, center) and Upper-level Water Vapor (6.2 µm, right) images, with plots of surface wind barbs and gusts in knots [click to play animation | MP4]](https://cimss.ssec.wisc.edu/satellite-blog/wp-content/uploads/sites/5/2019/10/191010_goes16_visible_waterVapor_winds_gusts_Plains_cold_front_anim.gif)
![Plot of rawinsonde data from Amarillo, Texas [click to enlarge]](https://cimss.ssec.wisc.edu/satellite-blog/wp-content/uploads/sites/5/2019/10/191010_12UTC_KAMA_RAOB.GIF)
![GOES-16 Water Vapor weighting functions, calculated using 12 UTC rawinsonde data from Amarillo, Texas [click to enlarge]](https://cimss.ssec.wisc.edu/satellite-blog/wp-content/uploads/sites/5/2019/10/191010_12utc_kama_wv_wf.png)

![VIIRS Infrared Window (11.45 µm) images from NOAA-20 and Suomi NPP (credit: William Straka, CIMSS) [click to enlarge]](https://cimss.ssec.wisc.edu/satellite-blog/wp-content/uploads/sites/5/2019/10/191007_1525utc_noaa20_1615utc_suomiNPP_viirs_infraredWindow_Hagibis_zoom_anim.gif)
![Himawari-8 "Red" Visible (0.64 µm) images [click to play animation | MP4]](https://cimss.ssec.wisc.edu/satellite-blog/wp-content/uploads/sites/5/2019/10/191007_himawari8_visible_Hagibis_anim.gif)
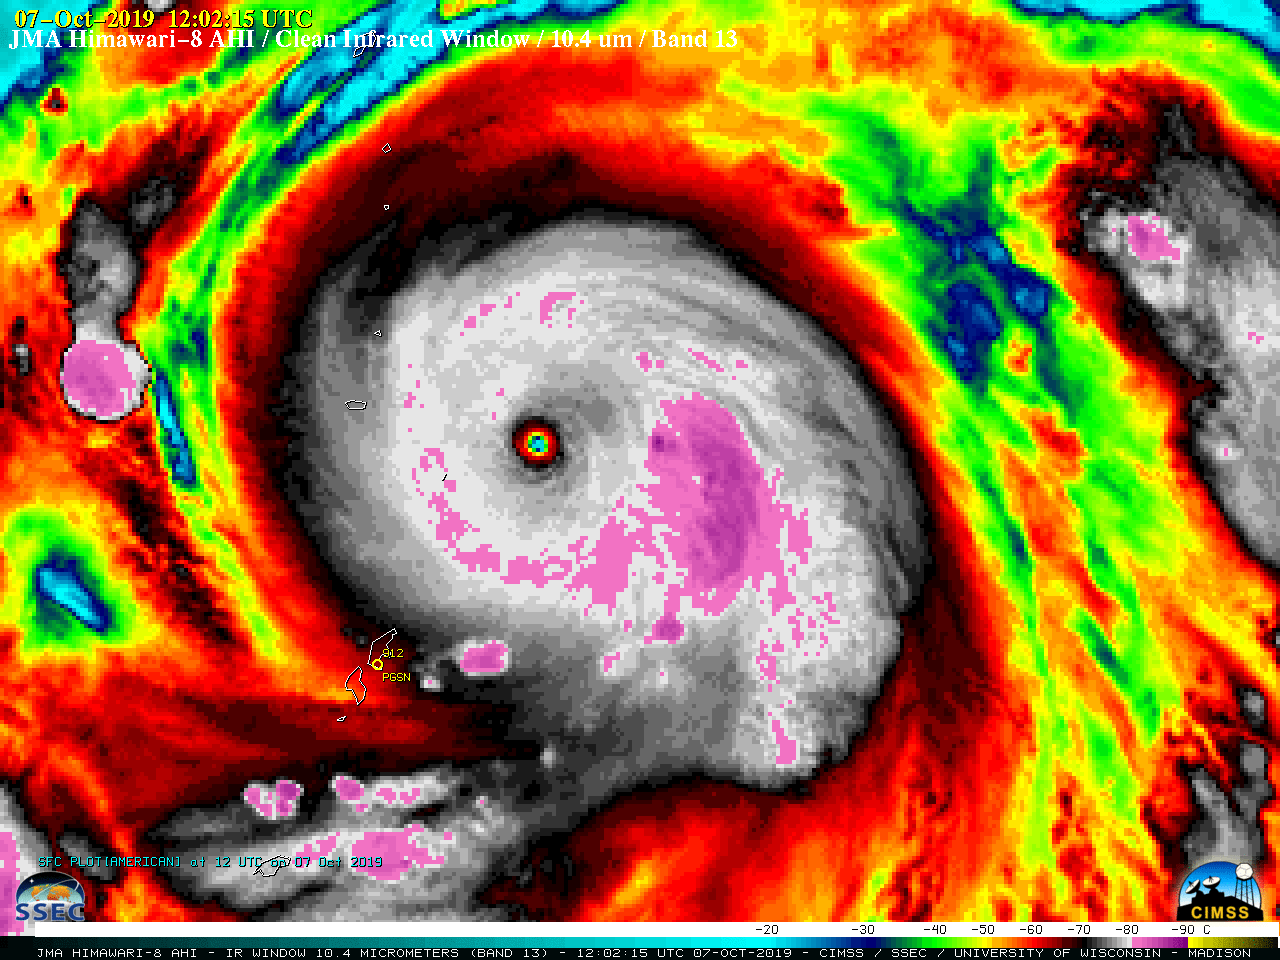
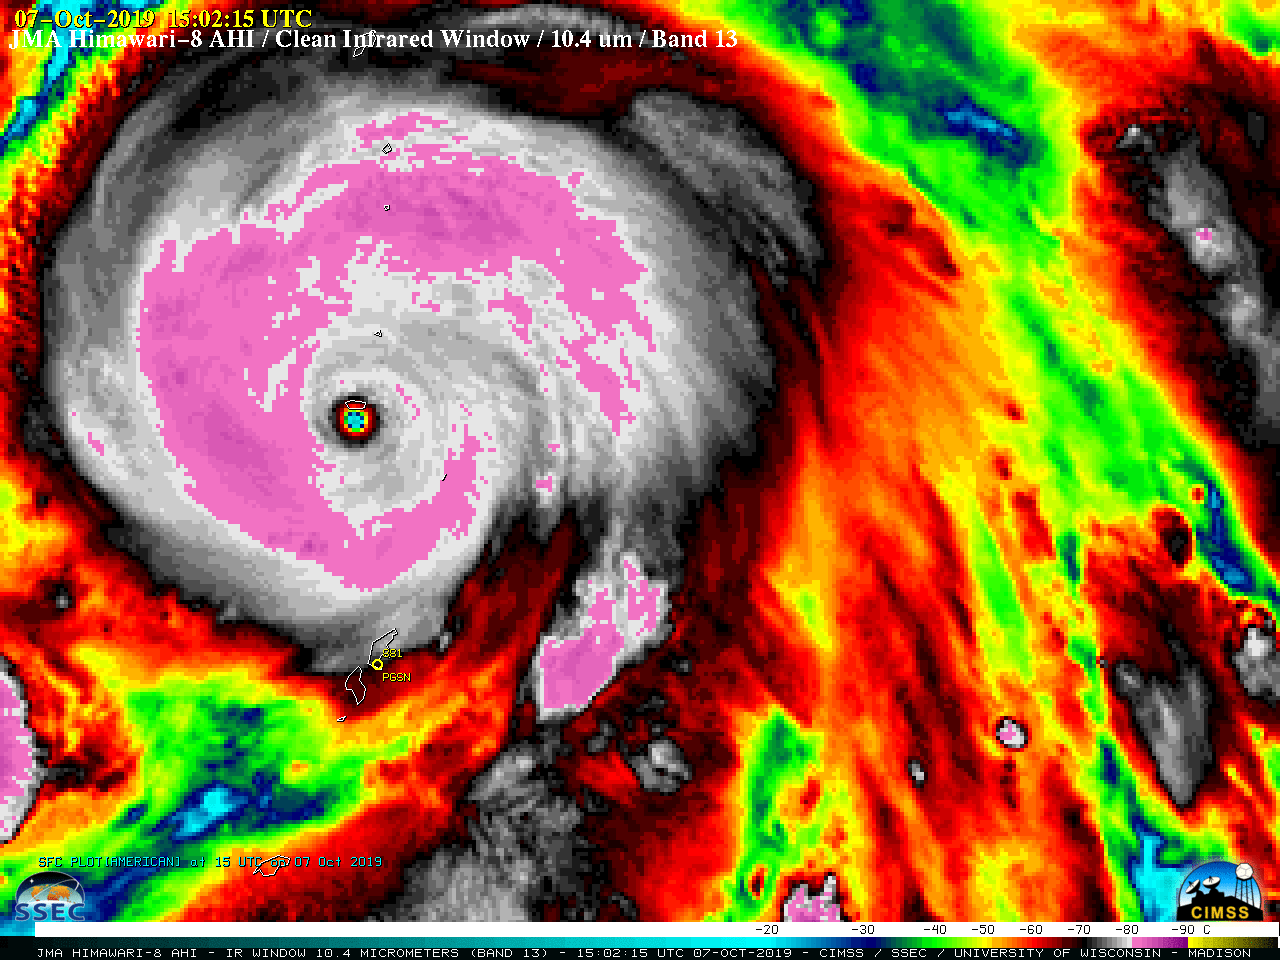
![Himawari-8 "Clean" Infrared Window (10.4 µm) images [click to play animation | MP4]](https://cimss.ssec.wisc.edu/satellite-blog/wp-content/uploads/sites/5/2019/10/191008_himawari8_infrared_Hagibis_anim.gif)
![VIIRS Infrared Window (11.45 µm) images from Suomi NPP and NOAA-20 [click to enlarge]](https://cimss.ssec.wisc.edu/satellite-blog/wp-content/uploads/sites/5/2019/10/191008_1556utc_suomiNPP_1646utc_noaa20_viirs_infrared_Hagibis_anim.gif)
![VIIRS Day/Night Band (0.7 µm ) and Infrared Window (11.45 µm) images at 1556 UTC [click to enlarge]](https://cimss.ssec.wisc.edu/satellite-blog/wp-content/uploads/sites/5/2019/10/191008_1556utc_suomiNPP_viirs_dayNightBand_infraredWindow_Hagibis_anim.gif)
