Cyclone spin-up over Samoa on 9 March 2025

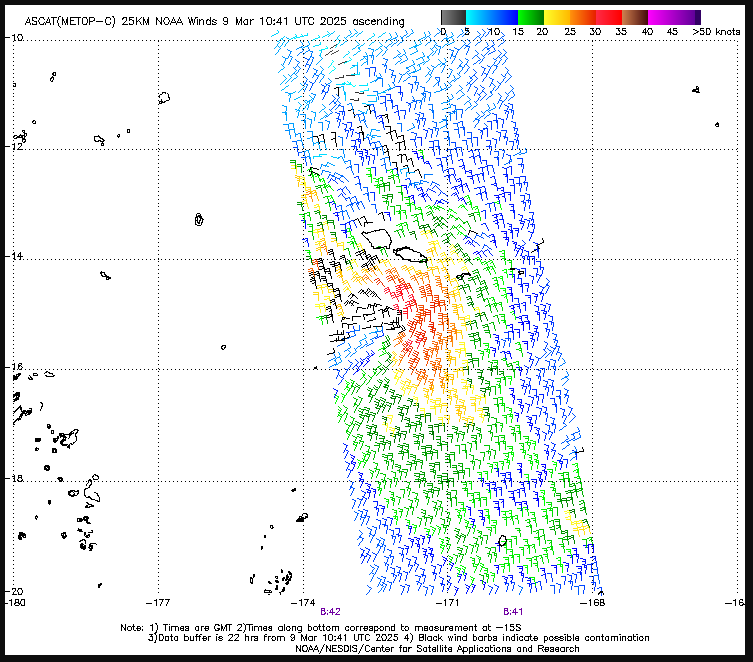
Clean-window infrared imagery centered on the Samoan Islands on 9 March 2025, above, show convective development north of Upolu that subsequently shows a cyclonic circulation. This system was accompanied by Flood Warnings, Heavy Rain Warnings and Marine Warnings and Wind Advisories over all of Samoa (Facebook link). Gusts exceeding 70 km/hr were reported. A very timely MetopC overpass, below (courtesy Joe LaPlante from the NWS in Pago Pago), shows the low-level circulation that developed. It does not appear to have cut off into a closed circulation at that time.
How well can a strong spin-up like this be anticipated? A deterministic ECMWF forecast initialized on 0000 UTC on 8 March, below, showed a region of active weather moving southward through the Samoan Island chain after 1800 UTC on 8 March. Note the small box drawn around the Samoan Islands. (Here is the 1200UTC/8 March ECMWF run that shows a similar evolution). Imagery is taken from the excellent TropicalTidbits website.

Deterministic models from the GFS (imagery also from the Tropical Tidbits site), below, show a similar scenario, both from the model initialized at 0000 UTC/8 March below, and the one starting at 1200 UTC/8 March at this link. All of the forecasts show a system sagging towards the south across Samoa.
MIMIC Total Precipitable Water (TPW) fields from 0000 UTC 8 March through 1200 UTC 9 March 2025, below (from this site), suggest a local maximum in moisture over the islands, and the fields also show the southward motion.
Visible imagery (from the CSPP Geosphere website) below shows active weather north of Samoa. It moves south throughout the animation.
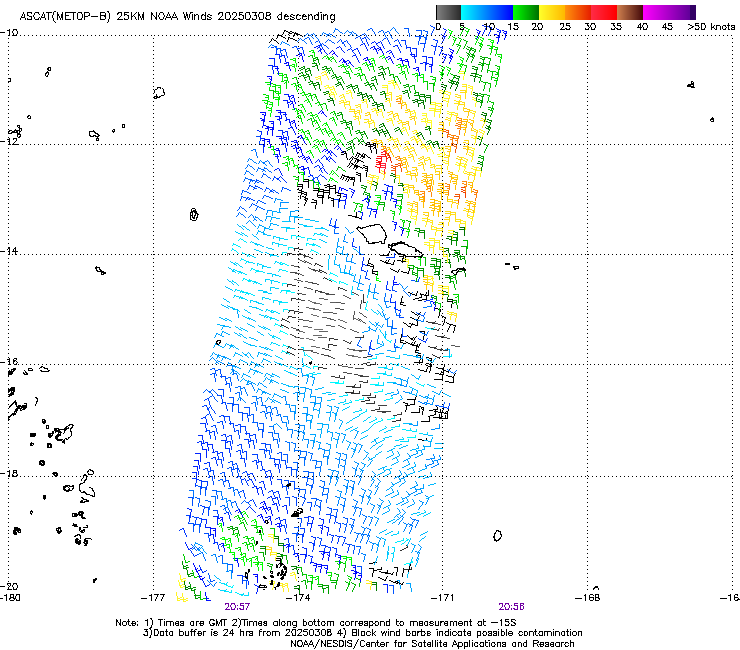
Now consider the Metop-B ASCAT winds below, from ca. 2100 UTC on 8 March 2025. A local maximum in wind (in red) is north of Savai’i, and the leading edge of a region of stronger winds. Is this single observational plot sufficient for a forecaster to prepare the weather that was observed?
The GOES-18 imagery at that time (pulled from the visible animation above) shows strong convection (circled in black) near that region of stronger winds. If you trace that convective region southward to Upolu and Savai’i, does it overspread the region that saw damage (downed trees, taken from here, for example) and heavy rain?
Clean window infrared imagery, below (the end of the animation below overlaps with the start of the infrared animation shown above), suggests that perhaps that region of strong winds in the ASCAT fields, if associated with strong convection can be tracked to the south.

Once the cyclonic circulation is apparent, would you expect it to persist in the environment? That is — are we seeing the development of a tropical cyclone? Shear values (from the CIMSS Tropical Weather Website), show a narrow region of favorable shear where the spin-up occurred. Like the forecasts and other fields, the favorable shear region is shifting south with time.
Upper-level divergence is similarly shifting southward, with strong values where the convection and spin-up occurred.
Low level convergence fields also show a southward progression, but are not as organized as upper levels. Maybe that’s why this cyclone did not persist with time.
Thanks to the Forecast Office in Pago Pago for alerting me to this interesting event.