GOES-16 Mesoscale Sector 1 imagery, in its default position over the metropolitan New York City aviation hub, also views western New York. It was therefore able to view the beginning of a large fire at a cardboard container recycling and manufacturing facility in Niagara Falls (Youtube link) on 20 November 2020. GOES-16 Band 7 shortwave... Read More
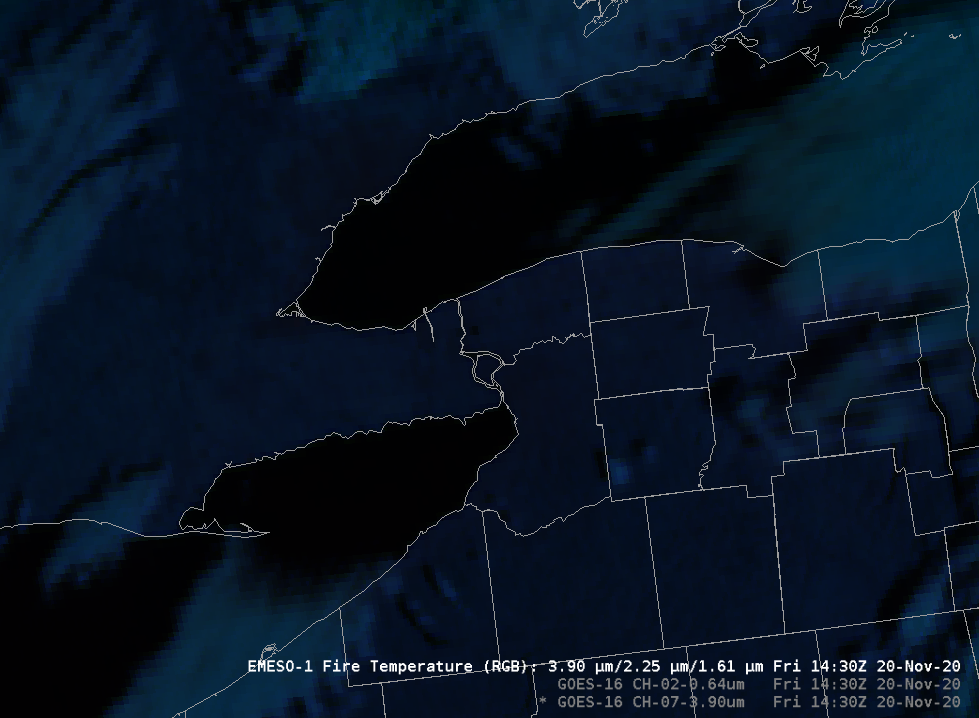
GOES-16 Mesoscale Sector-1 Shortwave Infrared (3.9 µm) Imagery, 1440 – 1450 UTC on 20 November 2020 (Click to enlarge)
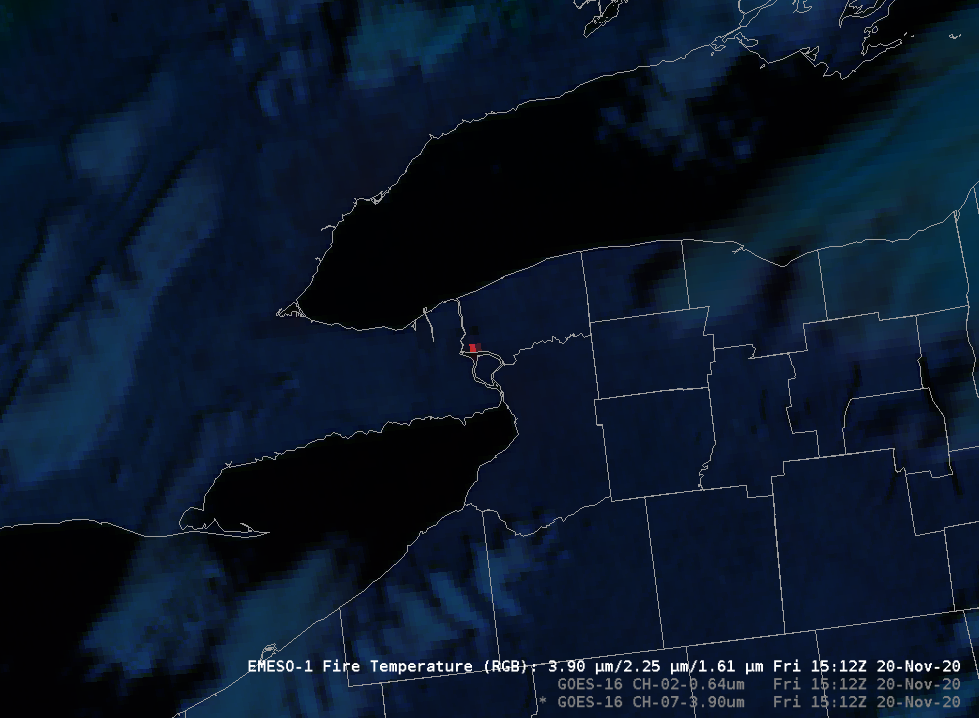
GOES-16 Mesoscale Sector 1 imagery, in its default position over the metropolitan New York City aviation hub, also views western New York. It was therefore able to view the beginning of a large fire at a cardboard container recycling and manufacturing facility in Niagara Falls (Youtube link) on 20 November 2020. GOES-16 Band 7 shortwave infrared (3.9 µm) imagery, above, first detected the fire hot spot at about 1441 UTC, or 9:41 AM EST (It becomes visually apparent in the imagery at about 1447 UTC). GOES-16 continued to observe the fire until clouds moved into the area around 1600 UTC, or 11 AM EST, as shown in the Fire RGB animation, below, from 1430 – 1630 UTC, and in this visible imagery animation. (Click here to view the Band 7 (3.9 µm) animation from 1430 – 1630)
The warmest GOES-16 Band 7 (3.9 µm) pixel temperature occurred at 1512 UTC: 53.5ºC. Click here to see the image; (here’s the Fire RGB for that time).
GOES-16 Fire RGB, 1430 – 1630 UTC on 20 November 2020 (Click to animate)
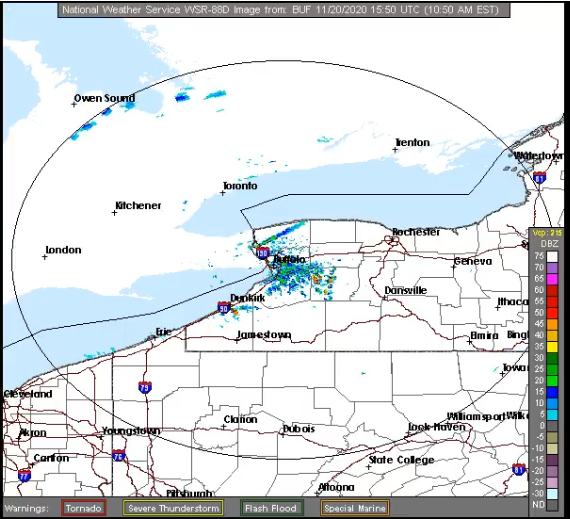
Radar observed the fire’s plume (link from 1550 UTC, courtesy Michael Fries, NWS BUF). Thanks also to Michael for alerting us to this event.
View only this post
Read Less
![1-minute images from all 16 ABI spectral bands of GOES-17 [click to play animation | MP4]](https://cimss.ssec.wisc.edu/satellite-blog/images/2020/11/201121_goes17_16spectralBands_Sentinel6_launch_CA_anim.gif)
![16-panel display of all GOES-17 ABI spectral bands, 1716-1728 UTC [click to play animation | MP4]](https://cimss.ssec.wisc.edu/satellite-blog/images/2020/11/201121_goes17_16panel_Sentinel6_launch_CA_anim.gif)

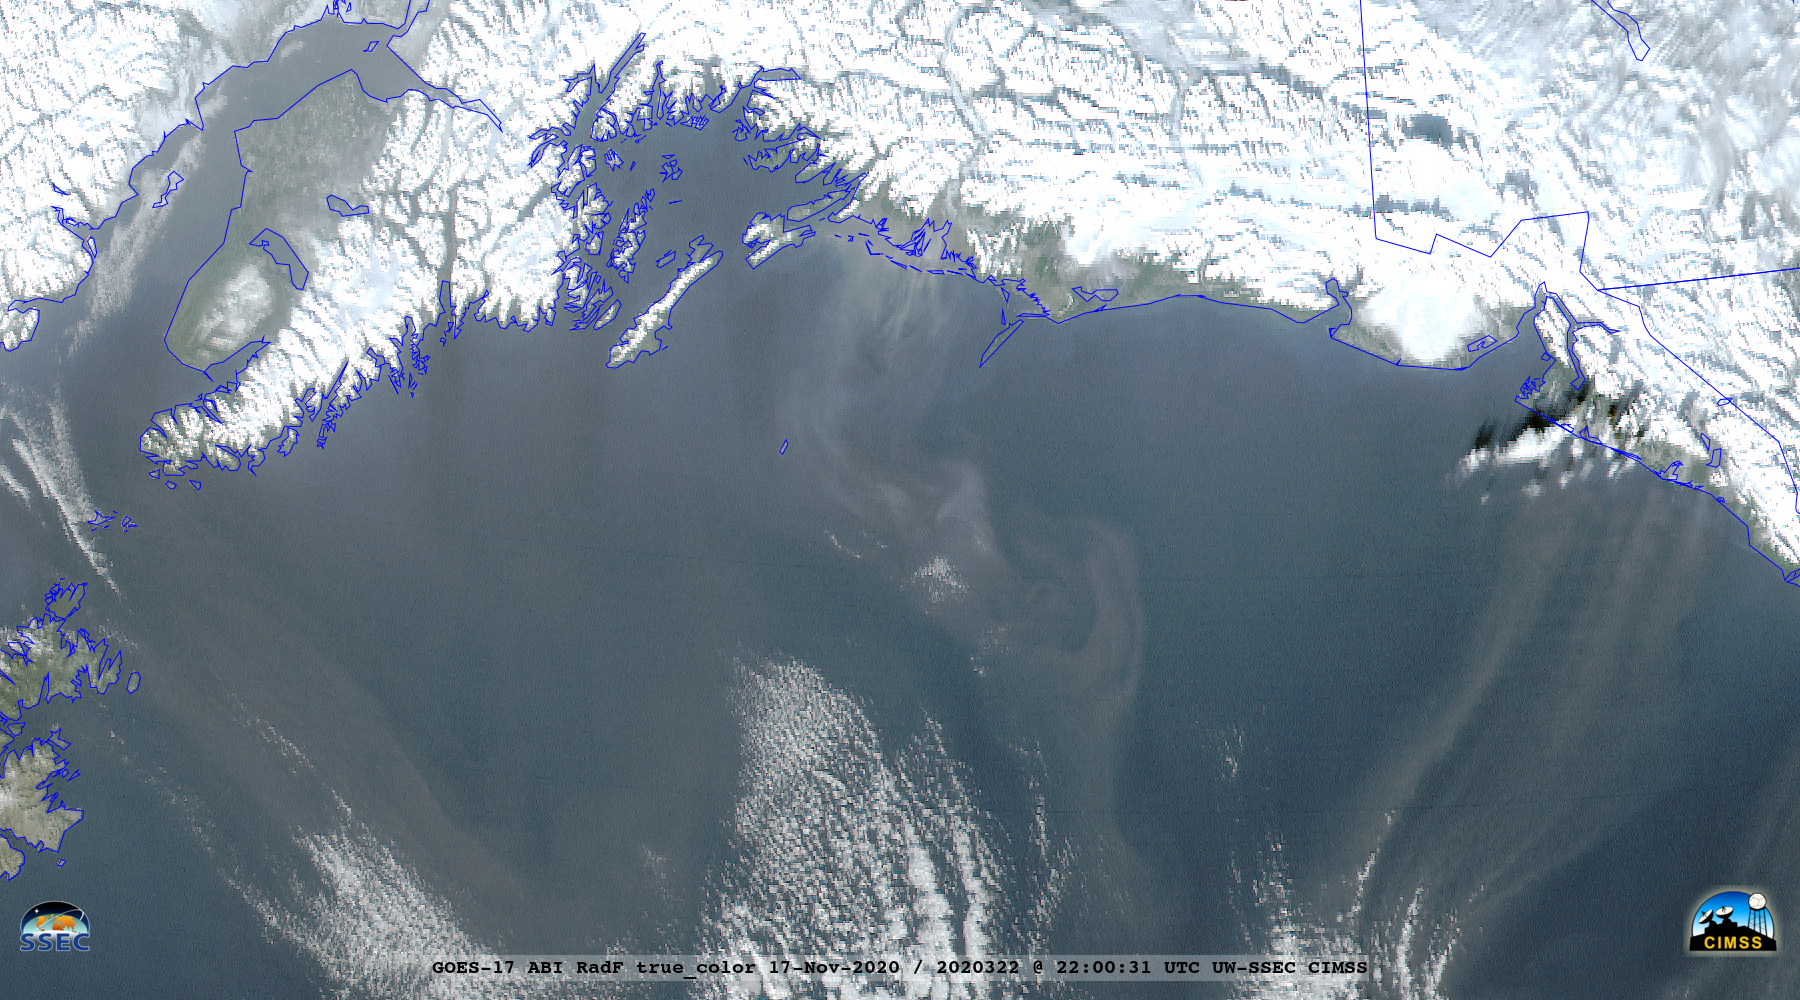
![GOES-17 True Color RGB images [click to play animation | MP4]](https://cimss.ssec.wisc.edu/satellite-blog/images/2020/11/201117_201118_goes17_trueColorRGB_AK_blowing_dust_anim.gif)
![Metop-A ASCAT surface scatterometer winds [click to enlarge]](https://cimss.ssec.wisc.edu/satellite-blog/images/2020/11/201118_0536utc_metopA_ascat.png)
