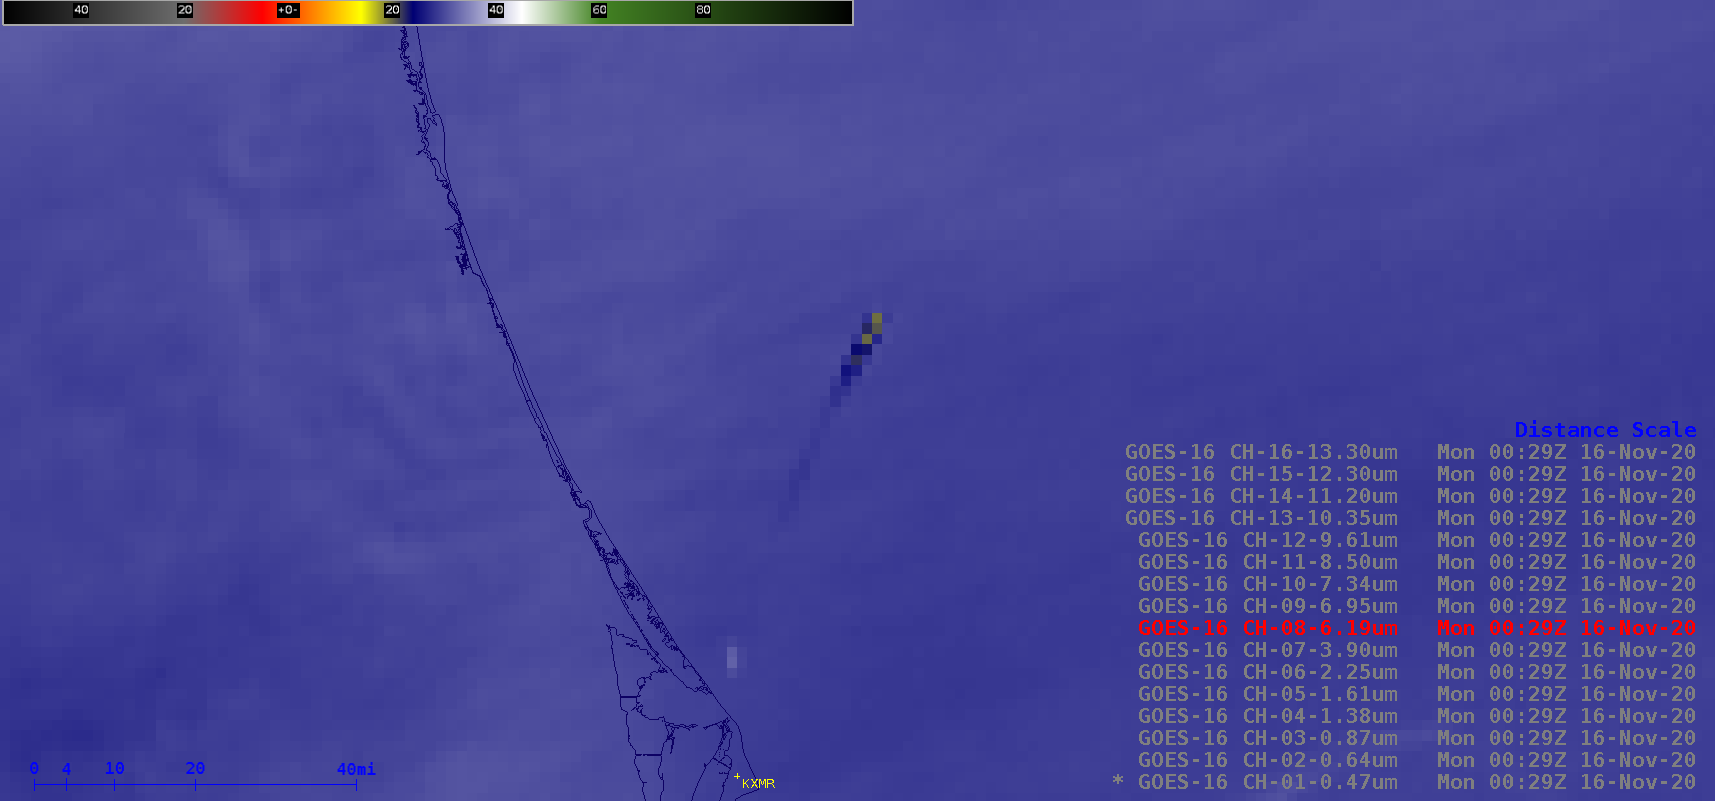
Overlapping 1-minute Mesoscale Domain Sectors provided 30-second images from all 16 ABI spectral bands of GOES-16 (GOES-East) — which showed signatures of the launch of the SpaceX Falcon 9 rocket (carrying the Crew Dragon mission) shortly after sunset on 15 November 2020 (above). Moving rapidly northeastward was the thermal signature of air that was super-heated by... Read More
![30-second images from all 16 ABI spectral bands of GOES-16 [click to play animation | MP4]](https://cimss.ssec.wisc.edu/satellite-blog/images/2020/11/sx_b08-20201116_002950.png)
30-second images from all 16 ABI spectral bands of GOES-16 [click to play animation | MP4]
Overlapping 1-minute
Mesoscale Domain Sectors provided 30-second images from all 16
ABI spectral bands of GOES-16
(GOES-East) — which showed signatures of the launch of the
SpaceX Falcon 9 rocket (carrying the Crew Dragon mission) shortly after sunset on
15 November 2020 (above). Moving rapidly northeastward was the thermal signature of air that was super-heated by the rocket exhaust, evident in all of the Near-Infrared bands (3-6) and Infrared bands (7-16) — in addition to a separate signature of the low-altitude booster rocket condensation cloud that was seen in all of the Infrared bands (drifting slowly eastward offshore, away from the launch site).
Even though a dim signature was not obvious in the Visible bands (1, 2), AWIPS cursor sampling of reflectance values from GOES-16 Bands 1, 2 and 3 at 0027 UTC (below) revealed small values (0.1%) for those two spectral bands at the location of the brightest Band 3 pixel (near the launch site).
![Cursor sampling of reflectance values from GOES-16 Bands 1, 2 and 3 at 0027 UTC [click to enlarge]](https://cimss.ssec.wisc.edu/satellite-blog/images/2020/11/201115_goes16_bands010203_SpaceX_cursor_sample.png)
Cursor sampling of reflectance values from GOES-16 Bands 1, 2 and 3 at 0027 UTC [click to enlarge]
In a zoomed-in comparison of GOES-16 Visible and Near-Infrared spectral bands
(below), a special enhancement was used to enhance reflectance — obvious rocket booster signatures were apparent in the Near-Infrared bands (3-6), and a small bright pixel was even seen in the Band 2 Visible imagery during the ~1.5 minutes following the 0027 UTC launch.
![GOES-16 Visible and Near-Infrared spectral bands [click to play animation | MP4]](https://cimss.ssec.wisc.edu/satellite-blog/images/2020/11/G16_VIS_NIR_SPACEX_LAUNCH_15NOV2020_B123456_2020321_002820_0006PANELS_FRAME00005.GIF)
GOES-16 Visible and Near-Infrared spectral bands [click to play animation | MP4]
A 16-panel display of all GOES-16 ABI spectral bands from 0026-0031 UTC is shown below.
![16-panel display of all GOES-16 ABI spectral bands, 0026-0031 UTC [click to play animation]](https://cimss.ssec.wisc.edu/satellite-blog/images/2020/11/sx_16p-20201116_002920.png)
16-panel display of all GOES-16 ABI spectral bands, 0026-0031 UTC [click to play animation]
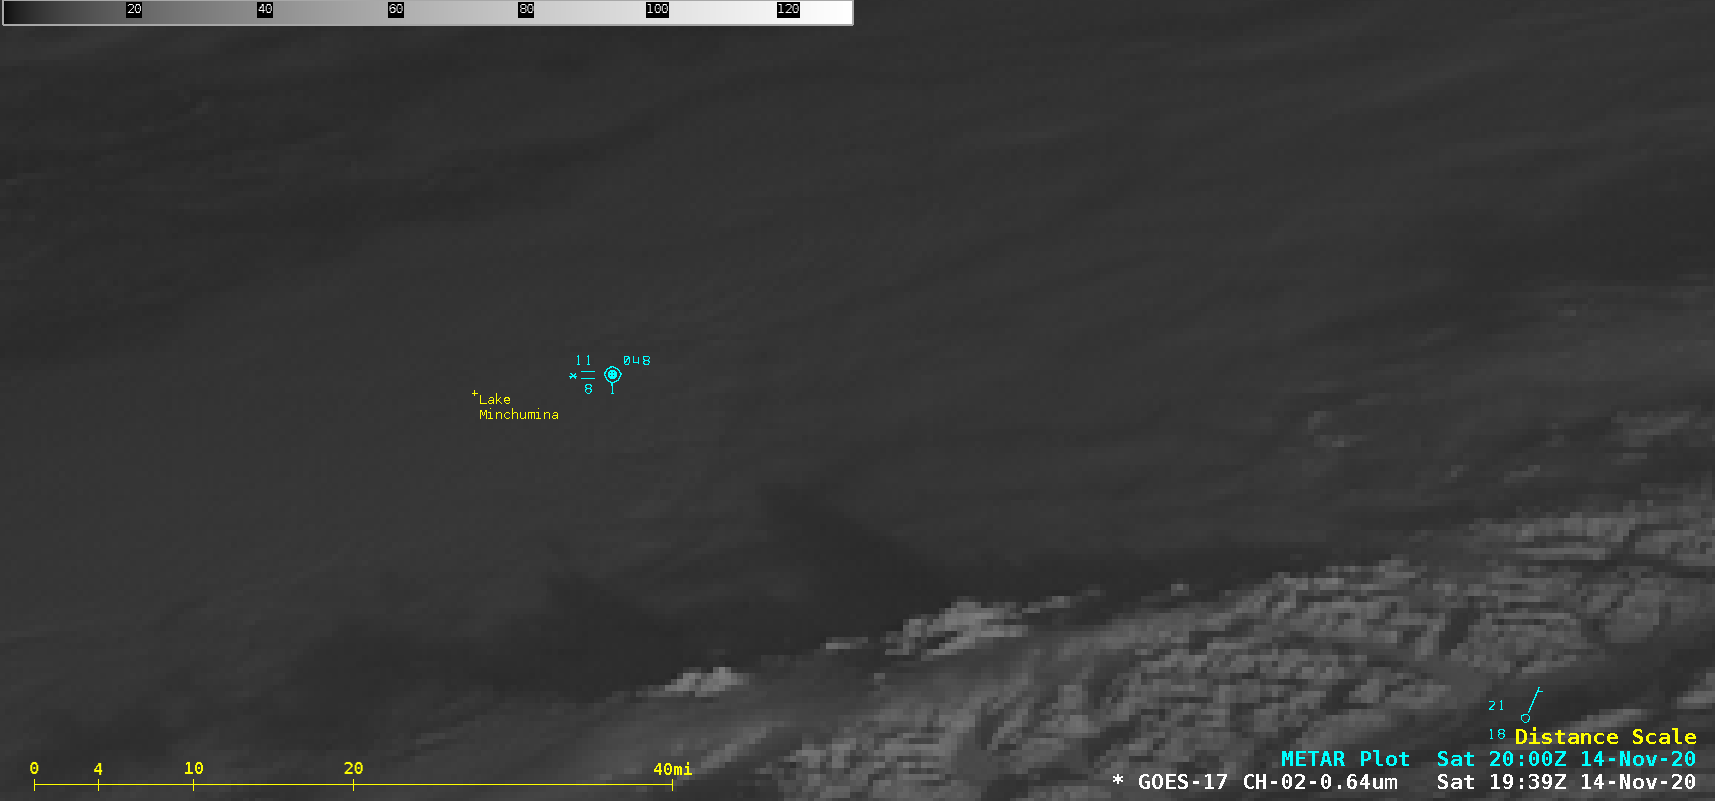
A GOES-17
(GOES-West) Mesoscale Sector was also positioned over the launch area — in a comparison of 1-minute GOES-17 and 30-second GOES-16 Upper-level Water Vapor (
6.2 µm) and Shortwave Infrared (
3.9 µm) images
(below), the rocket booster engine thermal signature was prominent during the first 2 minutes post-launch. The images are displayed in the native projection of each satellite.
![Upper-level Water Vapor images (top panels) and Shortwave Infrared images (bottom panels) from GOES-17 and GOES-16 [click to play animation | MP4]](https://cimss.ssec.wisc.edu/satellite-blog/images/2020/11/G17_G16_WV8_SWIR_SPACEX_LAUNCH_15NOV2020_B8877_2020321_002925_0004PANELS_FRAME00007.GIF)
Upper-level Water Vapor images (top panels) and Shortwave Infrared images (bottom panels) from GOES-17 (left) and GOES-16 (right) [click to play animation | MP4]
Larger-scale views of Shortwave Infrared and Water Vapor images from GOES-16 and GOES-17 are shown below (credit: Tim Schmit, NOAA/NESDIS/CIMSS
@GOESguy).
View only this post
Read Less
![30-second images from all 16 ABI spectral bands of GOES-16 [click to play animation | MP4]](https://cimss.ssec.wisc.edu/satellite-blog/images/2020/11/201115_goes16_16spectralBands_SpaceX_launch_anim.gif)
![GOES-16 Visible and Near-Infrared spectral bands [click to play animation | MP4]](https://cimss.ssec.wisc.edu/satellite-blog/images/2020/11/201115_goes16_visible_nearInfrared_SpaceX_launch_anim.gif)
![16-panel display of all GOES-16 ABI spectral bands, 0026-0031 UTC [click to play animation]](https://cimss.ssec.wisc.edu/satellite-blog/images/2020/11/201115_goes16_16panel_SpaceX_Falcon9_launch_anim.gif)
![Upper-level Water Vapor images (top panels) and Shortwave Infrared images (bottom panels) from GOES-17 and GOES-16 [click to play animation | MP4]](https://cimss.ssec.wisc.edu/satellite-blog/images/2020/11/201115_goes17_goes16_waterVapor_shortwaveInfrared_SpaceX_launch_anim.gif)
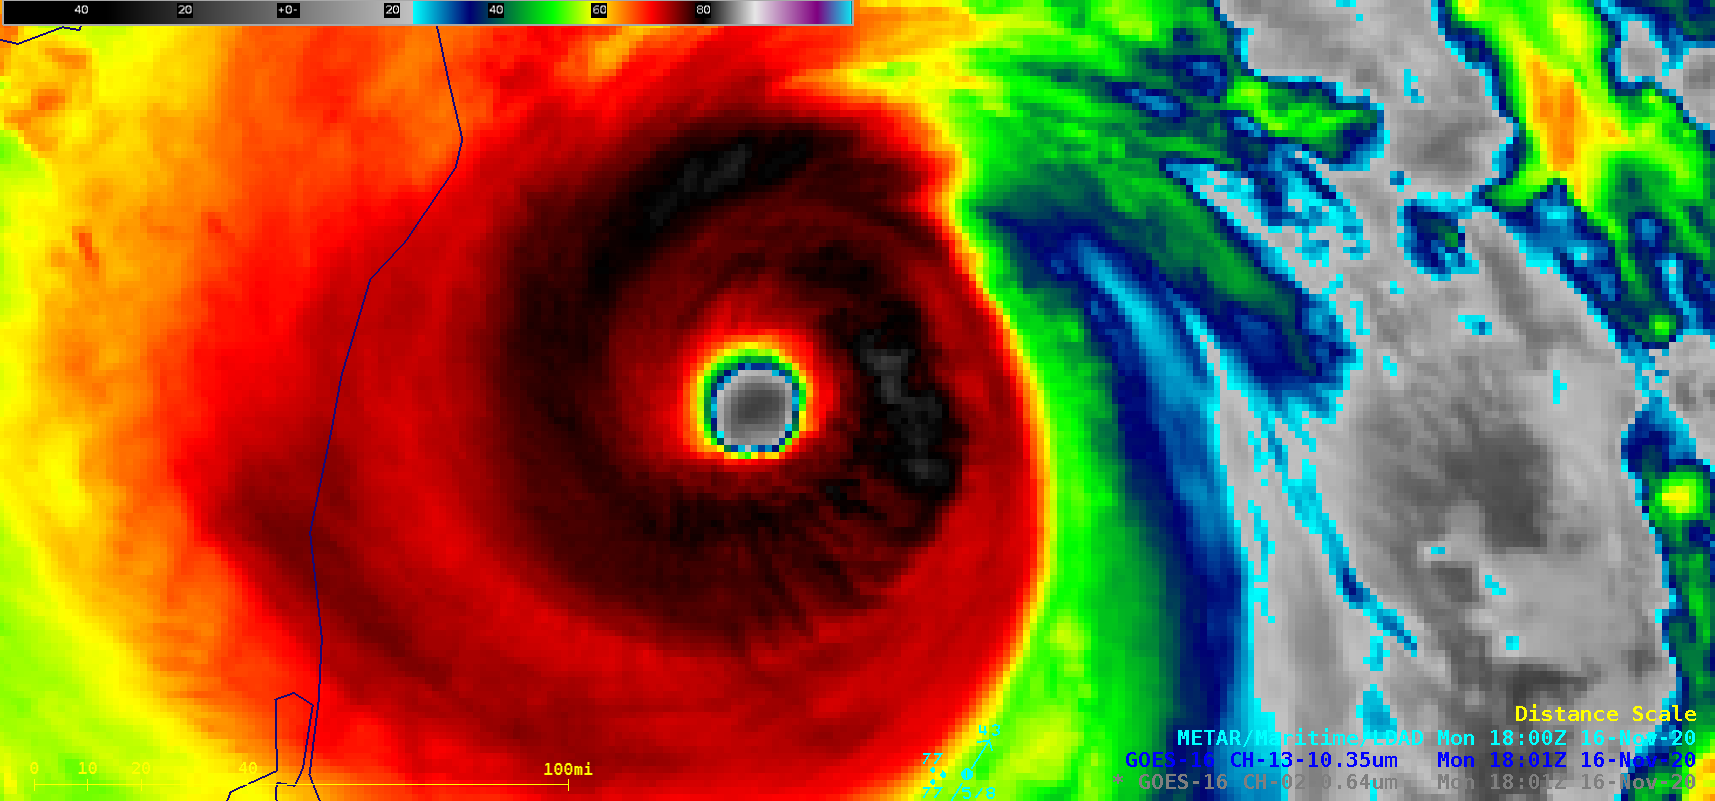
![GOES-16 “Red” Visible (0.64 µm), “Clean” Infrared Window (10.35 µm) and Mid-level Water Vapor (6.9 µm) images [click to play animation | MP4]](https://cimss.ssec.wisc.edu/satellite-blog/images/2020/11/201115_goes16_visible_infrared_waterVapor_Hurricane_Iota_anim.gif)
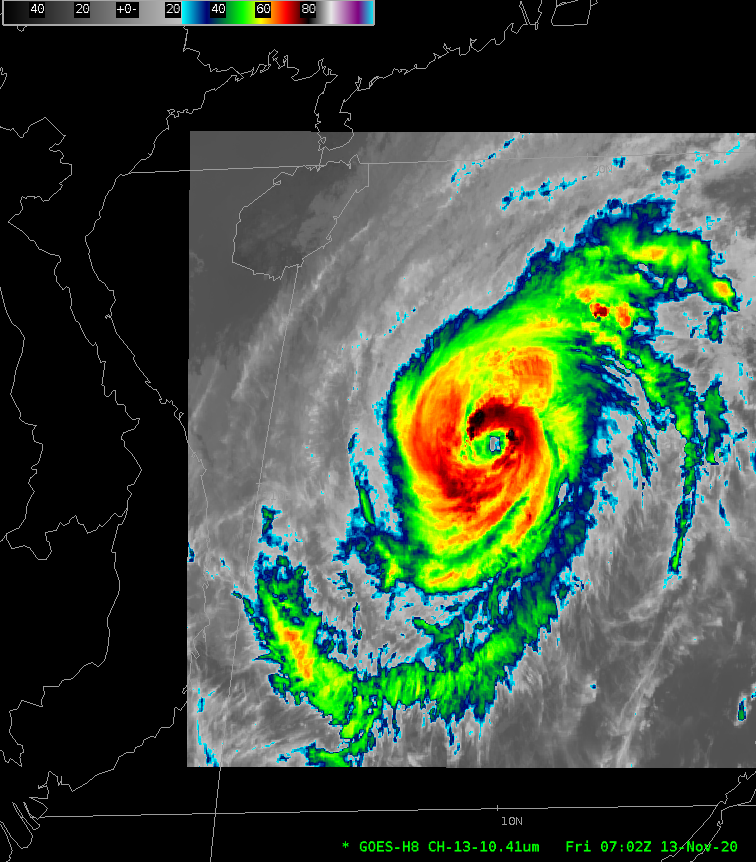
![GOES-16 Longwave Infrared (11.2 µm) images, with contours of 19 UTC deep-layer wind shear [click to enlarge]](https://cimss.ssec.wisc.edu/satellite-blog/images/2020/11/201115_goes16_ir_shear_Iota.gif)
![GOES-16 “Red” Visible (0.64 µm) and “Clean” Infrared Window (10.35 µm) images [click to play animation | MP4]](https://cimss.ssec.wisc.edu/satellite-blog/images/2020/11/201116_goes16_visible_infrared_Hurricane_Iota_anim.gif)
![GOES-16 “Clean” Infrared Window (10.35 µm) images [click to play animation | MP4]](https://cimss.ssec.wisc.edu/satellite-blog/images/2020/11/201116_goes16_infrared_Hurricane_Iota_landfall_anim.gif)


