1-minute Mesoscale Domain Sector GOES-16 (GOES-East) “Red” Visible (0.64 µm), Shortwave Infrared (3.9 µm) and “Clean” Infrared Window (10.35 µm) images (above) showed the passage of a total solar eclipse shadow across parts of Chile and Argentina, along with the land surface thermal response due to the interruption of incoming solar radiation. In areas... Read More
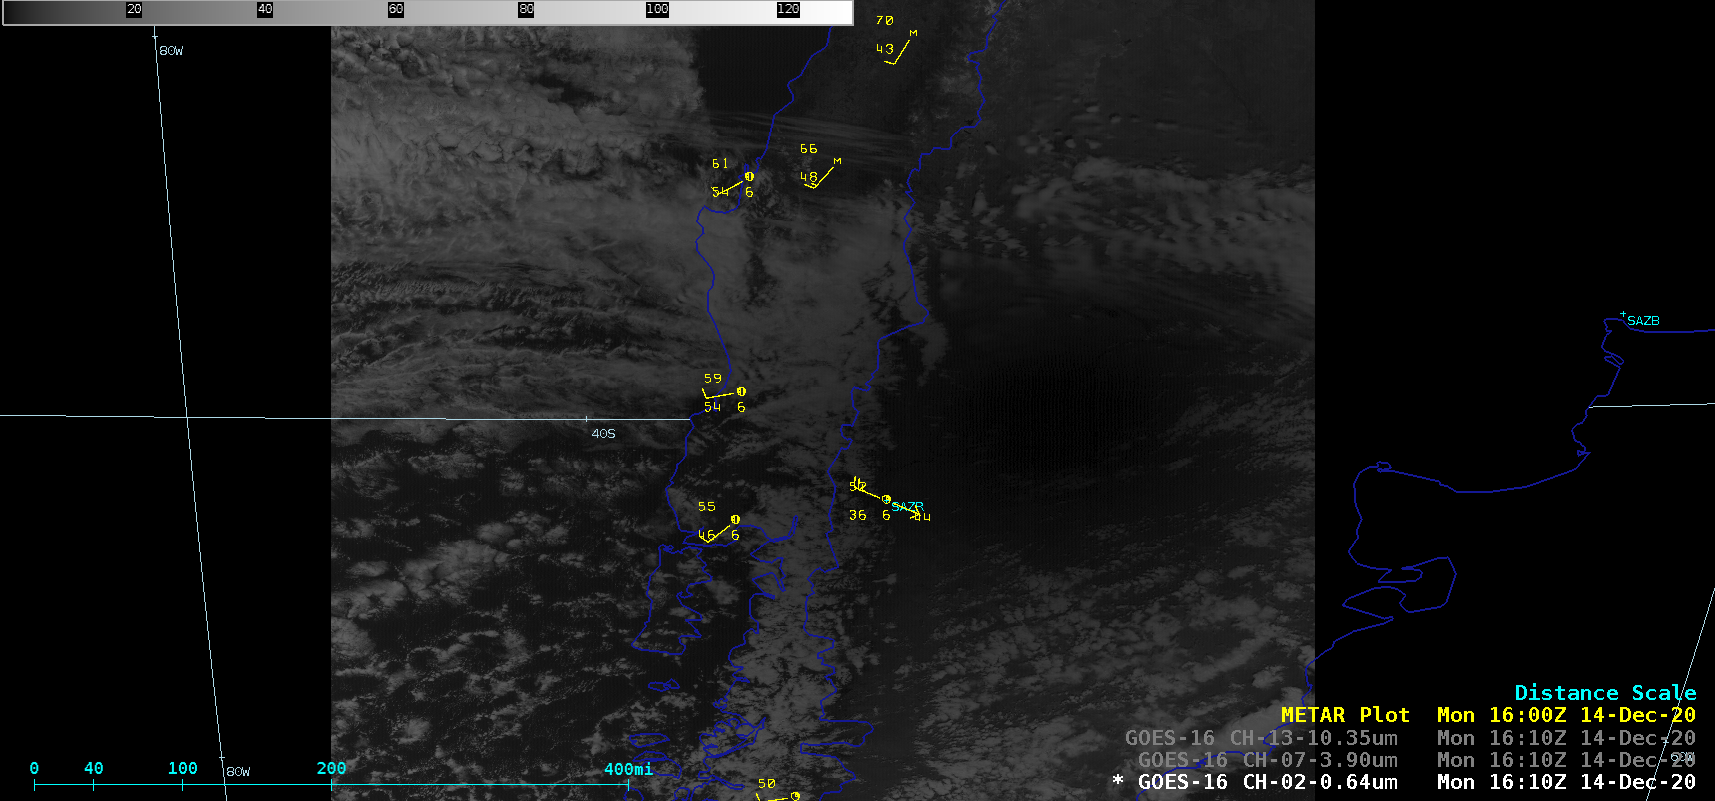
GOES-16 “Red” Visible (0.64 µm), Shortwave Infrared (3.9 µm) and “Clean” Infrared Window (10.35 µm) images [click to play animation | MP4]
1-minute
Mesoscale Domain Sector GOES-16
(GOES-East) “Red” Visible (0.64 µm), Shortwave Infrared (3.9 µm) and “Clean” Infrared Window (10.35 µm) images
(above) showed the passage of a total solar eclipse shadow across parts of Chile and Argentina, along with the land surface thermal response due to the interruption of incoming solar radiation. In areas of Argentina beneath the path of totality, the infrared brightness temperature of the land surface decreased by as much as 20-30ºC within the umbral shadow.
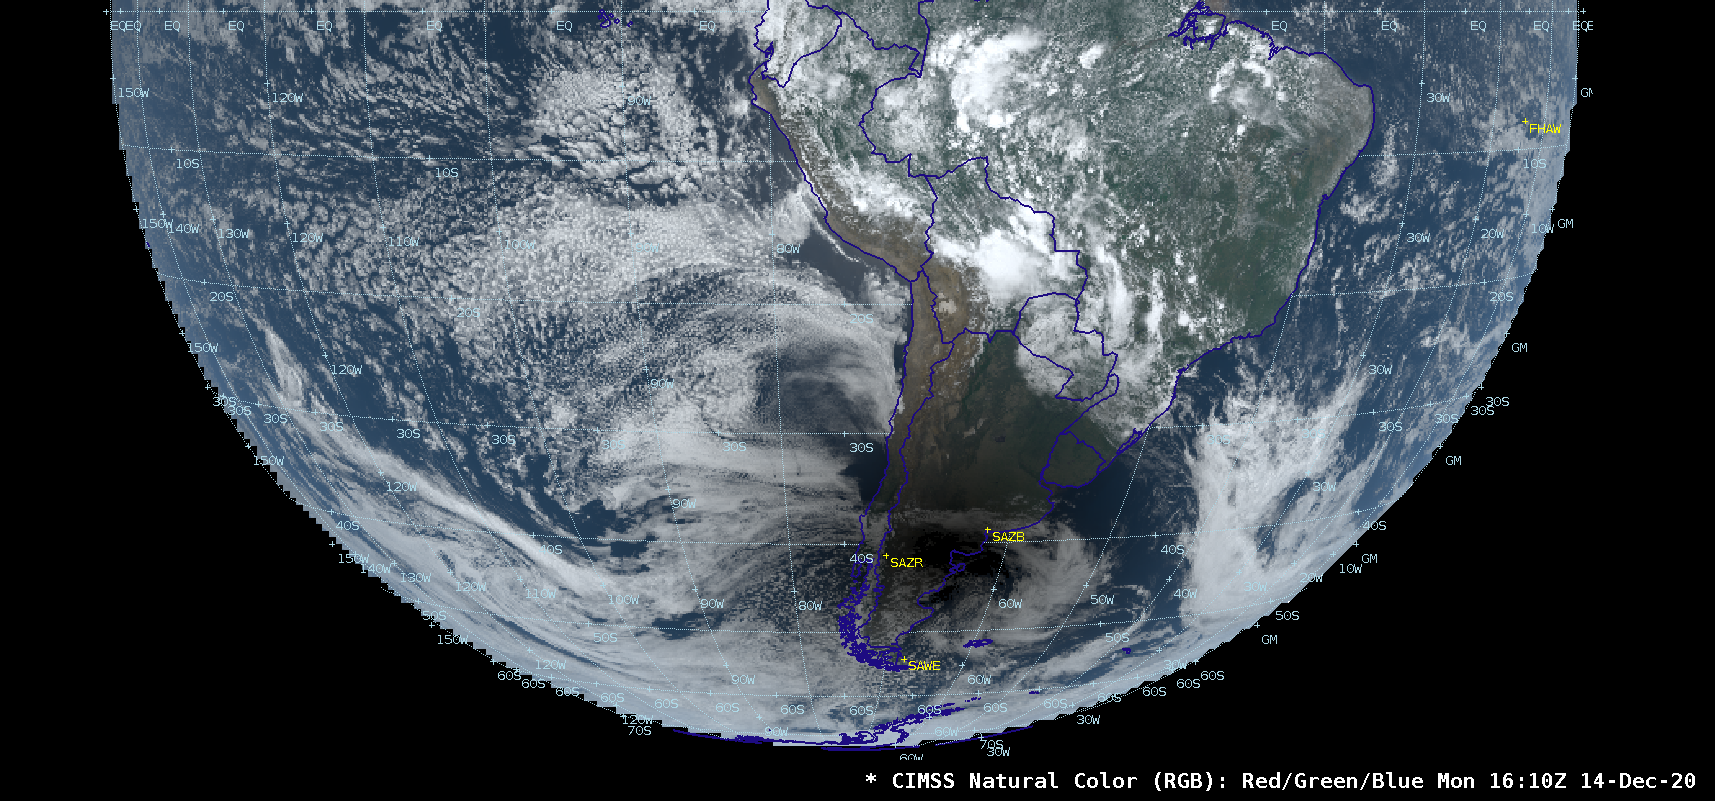
A larger-scale view of the path of the eclipse shadow was provided by GOES-16 CIMSS Natural Color RGB images (below).
![GOES-16 CIMSS Natural Color RGB images [click to play animation | MP4]](https://cimss.ssec.wisc.edu/satellite-blog/images/2020/12/sh_cnc_rgb-20201214_161011.png)
GOES-16 CIMSS Natural Color RGB images [click to play animation | MP4]
GOES-16 Near-Infrared “Vegetaton” (0.86 µm) images
(below) highlighted an advantage of that spectral band — namely, brighter surface values over land (due to the higher reflectivity of vegetation at that wavelength), providing more contrast between the land surface and the darker eclipse shadow. The 0.86 µm band is also used to simulate a “green” component for RGB images such as the
CIMSS “Natural Color” product.
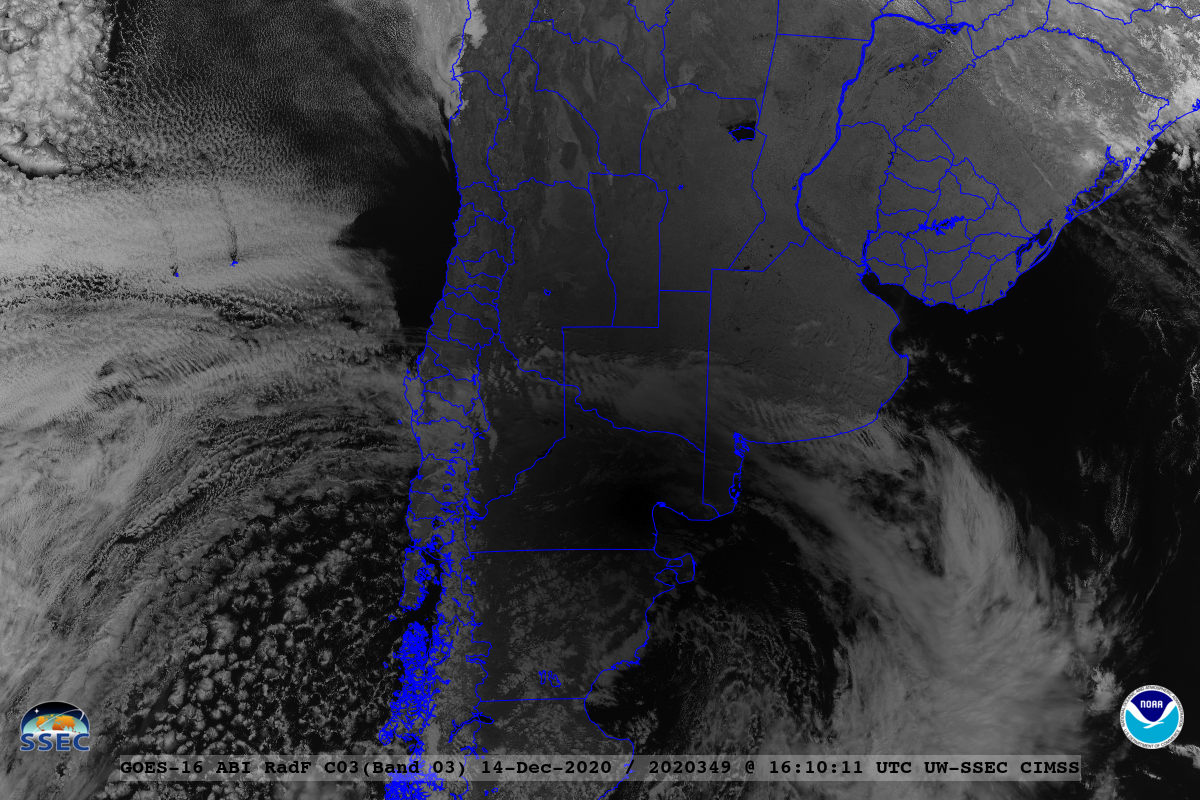
GOES-16 Near-Infrared “Vegetaton” (0.86 µm) images (credit: Tim Schmit, NOAA@CIMSS) [click to play animation | MP4]
A closer look at the eclipse shadow passage using 1-minute 0.86 µm imagery is shown below (with the corresponding CIMSS Natural Color RGB images
here).
![GOES-16 Near-Infrared "Vegetaton" (0.86 µm) images (credit: Tim Schmit, NOAA@CIMSS) [click to play animation | MP4]](https://cimss.ssec.wisc.edu/satellite-blog/images/2020/12/201214_goes16_band3_meso_eclipse.png)
GOES-16 Near-Infrared “Vegetaton” (0.86 µm) images (credit: Tim Schmit, NOAA@CIMSS) [click to play animation | MP4]
In a comparison of GOES-16 “Blue” Visible (0.47 µm), “Red” Visible (0.64 µm), Near-infrared “Vegetation” (0.86 µm), CIMSS “Natural Color” RGB and Rayleigh-corrected “True Color” RGB images
(below), it can be seen that the Rayleigh-corrected “True Color” is not optimal for displaying features such as solar eclipse shadows (due to over-saturation).
GOES-16 “Blue” Visible (0.47 µm), “Red” Visible (0.64 µm), Near-infrared “Vegetation” (0.86 µm), CIMSS “Natural Color” RGB and Rayleigh-corrected “True Color” RGB mages (credit: Tim Schmit, NOAAf@CIMSS) [click to enlarge]
Incidentally, although the path of totality passed to the north, some reduction of incoming sunlight was apparent over the A68a iceberg (located just southwest of South Georgia island) on GOES-16 Visible images created using
Geo2Grid (below).
![GOES-16 "Red" Visible (0.64 µm) images [click to play animation | MP4]](https://cimss.ssec.wisc.edu/satellite-blog/images/2020/12/GOES-16_ABI_RadF_C02_2020349_170010Z.png)
GOES-16 “Red” Visible (0.64 µm) images [click to play animation | MP4]
NOAA-20 VIIRS True Color RGB images viewed using
RealEarth (below) showed views before and during the time of closest passage of the eclipse shadow.
![NOAA-20 VIIRS True Color RGB images [click to enlarge]](https://cimss.ssec.wisc.edu/satellite-blog/images/2020/12/201214_noaa20_viirs_trueColorRGB_IcebergA68a_anim.gif)
NOAA-20 VIIRS True Color RGB images [click to enlarge]
Other blog posts that show solar eclipse shadows can be seen
here.
View only this post
Read Less
![GOES-16 Mid-level (6.9 µm) Water Vapor images, with hourly plots of precipitation type [click to play animation | MP4]](https://cimss.ssec.wisc.edu/satellite-blog/images/2020/12/201216_201217_goes16_waterVapor_Noreaster_anim.gif)
![GOES-16 "Red" Visible images [click to play animation | MP4]](https://cimss.ssec.wisc.edu/satellite-blog/images/2020/12/201217_goes16_visible_Noreaster_anim.gif)
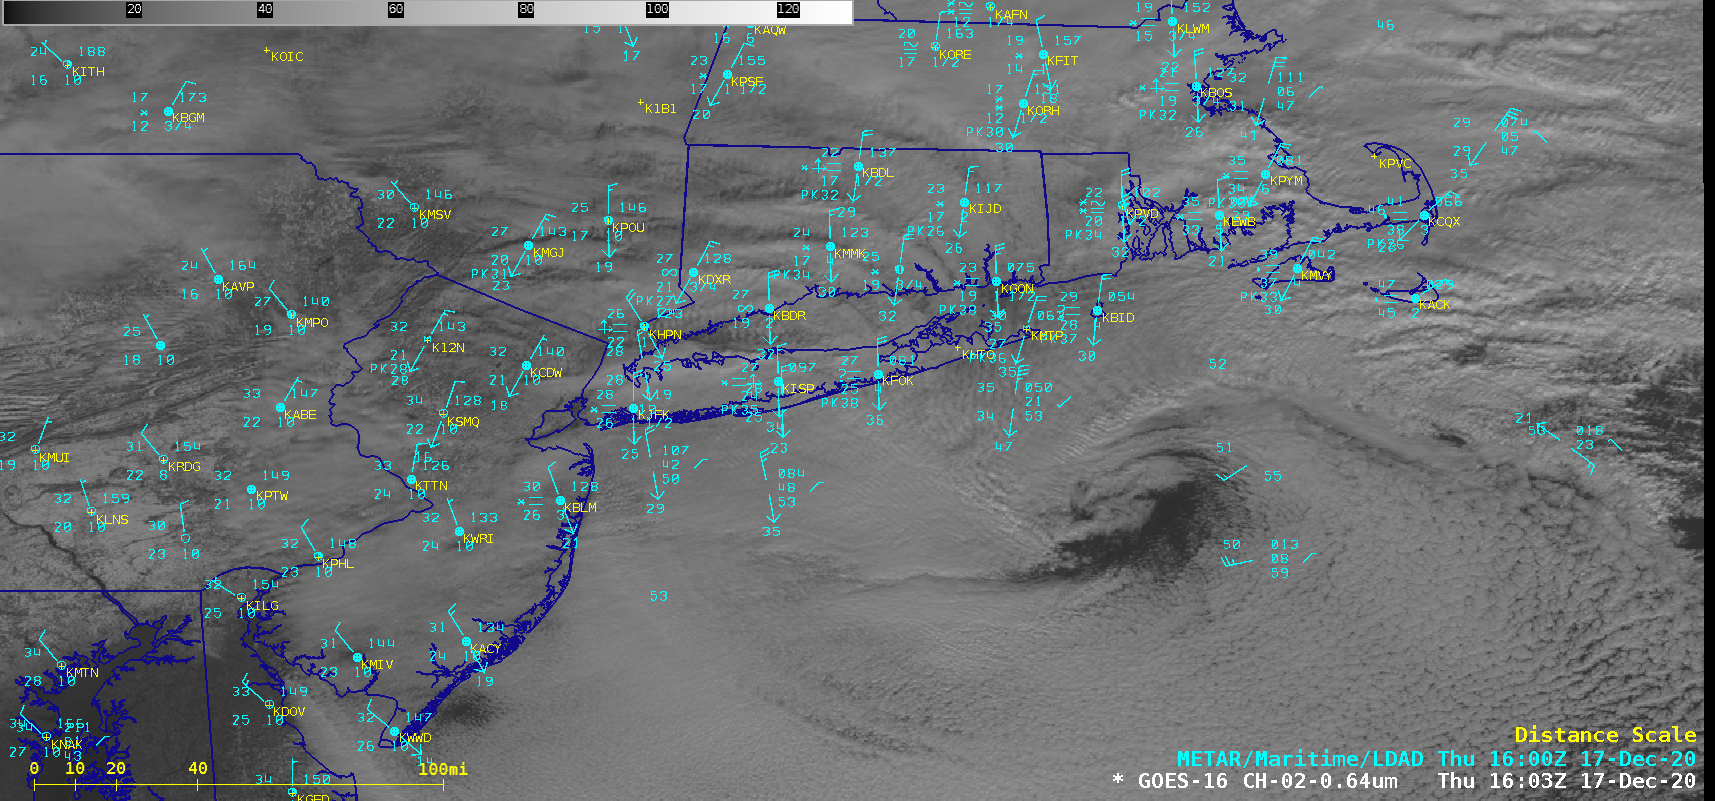
![NOAA-20 VIIRS Visible (0.64 µm), Near-Infrared (1.61 µm) and Infrared Window (11.45 µm) images [click to enlarge]](https://cimss.ssec.wisc.edu/satellite-blog/images/2020/12/201217_1639utc_noaa20_viirs_infrared_visible_nearInfrared_New_England_convective_billows_anim.gif)
![Comparison of Visible, Near-Infrared and Infrared Window images from NOAA-20 and GOES-16 [click to enlarge]](https://cimss.ssec.wisc.edu/satellite-blog/images/2020/12/201217_1639utc_noaa20_vs_goes16_infrared_visible_nearInfrared_New_England_convective_billows_anim.gif)
![GOES-16 Visible, Near-Infrared, Infrared Window and Day Cloud Phase Distinction RGB images [click to enlarge]](https://cimss.ssec.wisc.edu/satellite-blog/images/2020/12/201217_goes16_visible_nearInfrared_infrared_dayCloudPhaseDistnction_New_England_convective_billows_anim.gif)

![GOES-16 Dust RGB images [click to play animation | MP4]](https://cimss.ssec.wisc.edu/satellite-blog/images/2020/12/201215_goes16_dustRGB_TX_blowing_dust_anim.gif)
![GOES-16 True Color RGB images [click to play animation | MP4]](https://cimss.ssec.wisc.edu/satellite-blog/images/2020/12/201215_goes16_trueColorRGB_TX_blowing_dust_anim.gif)

![GOES-16 CIMSS Natural Color RGB images [click to play animation | MP4]](https://cimss.ssec.wisc.edu/satellite-blog/images/2020/12/201214_goes16_cimssNaturalColorRGB_Southern_Hemisphere_solar_eclipse_shadow_anim.gif)
![GOES-16 Near-Infrared "Vegetaton" (0.86 µm) images (credit: Tim Schmit, NOAA@CIMSS) [click to play animation | MP4]](https://cimss.ssec.wisc.edu/satellite-blog/images/2020/12/GOES-16_ABI_RadM2_C03_2020349_loop_M2.gif)
![GOES-16 "Red" Visible (0.64 µm) images [click to play animation | MP4]](https://cimss.ssec.wisc.edu/satellite-blog/images/2020/12/201214_goes16_visible_IcebergA68a_anim.gif)
