This blog has featured numerous blog posts that use visible imagery from two Geostationary Platforms (e.g., GOES-16/GOES-17 ; Himawari-8/GEOKOMPSAT-2). Different cloud heights can be perceived in that imagery (for those who have mastered the art of crossing their eyes!).GOES-R-type satellites also produce a Level 2 Product: Cloud Top Height. Can that product... Read More
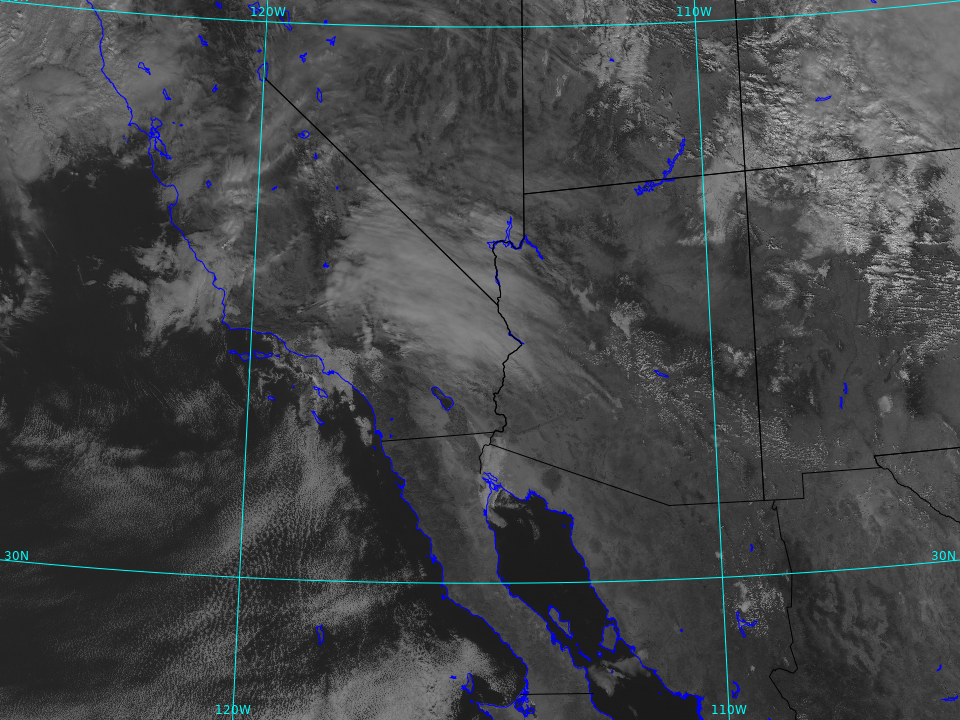
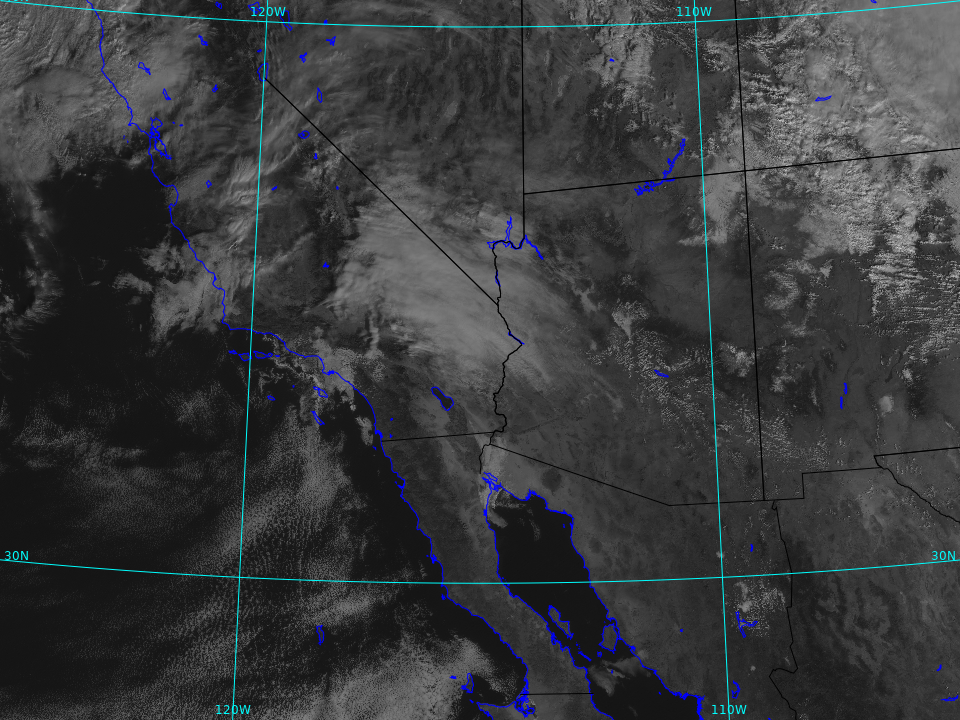
GOES-16 (left) and GOES-17 (right) visible imagery (0.64 µm) at 1800 UTC, 11 December 2020 (Click to enlarge)
This blog has featured numerous blog posts that use visible imagery from two Geostationary Platforms (e.g., GOES-16/GOES-17 ; Himawari-8/GEOKOMPSAT-2). Different cloud heights can be perceived in that imagery (for those who have mastered the art of crossing their eyes!).
GOES-R-type satellites also produce a Level 2 Product: Cloud Top Height. Can that product be used in concert with the Stereoscopic imagery to quantify the height differences seen in visible imagery? The image above was created using Geo2Grid and ImageMagick: Geo2Grid to create the GOES-16 (left) and GOES-17 (right) visible imagery, ImageMagick to paste them together. The GOES-R data (Full Disk in this case) have been remapped to a common projection. The scripts that does this sits below. (Click here to view Geo2Grid documentation).
../p2g_grid_helper.sh SWUSStereo   -115.0 34.0 2000 -2000 960 720 > $GEO2GRID_HOME/SWStereo.conf

#

#

../geo2grid.sh -r abi_l1b -w geotiff -p C02 -g SWUSStereo --grid-configs $GEO2GRID_HOME/SWStereo.conf --method nearest -f /arcdata/goes_restricted/grb/goes17/2020/2020_12_11_346/abi/L1b/RadF/OR_ABI*G17_s2020346180*.nc

../geo2grid.sh -r abi_l1b -w geotiff -p C02 -g SWUSStereo --grid-configs $GEO2GRID_HOME/SWStereo.conf --method nearest -f /arcdata/goes_restricted/grb/goes16/2020/2020_12_11_346/abi/L1b/RadF/OR_ABI*G16_s2020346180*.nc

../add_coastlines.sh --add-borders --borders-resolution=h --borders-outline='black' --add-coastlines --coastlines-outline='blue' --coastlines-resolution=h --add-grid --grid-text-size 12 --grid-d 10.0 10.0 --grid-D 10.0 10.0 GOES-17_ABI_RadF_C02_20201211_180???_SWUSStereo.tif

../add_coastlines.sh --add-borders --borders-resolution=h --borders-outline='black' --add-coastlines --coastlines-outline='blue' --coastlines-resolution=h --add-grid --grid-text-size 12 --grid-d 10.0 10.0 --grid-D 10.0 10.0 GOES-16_ABI_RadF_C02_20201211_180???_SWUSStereo.tif

convert GOES-16_ABI_RadF_C02_20201211_180???_SWUSStereo.png GOES-17_ABI_RadF_C02_20201211_180???_SWUSStereo.png +append GOES-1617Stereo_ABI_RadF_C02_20201211_1800_SWUSStereo.png
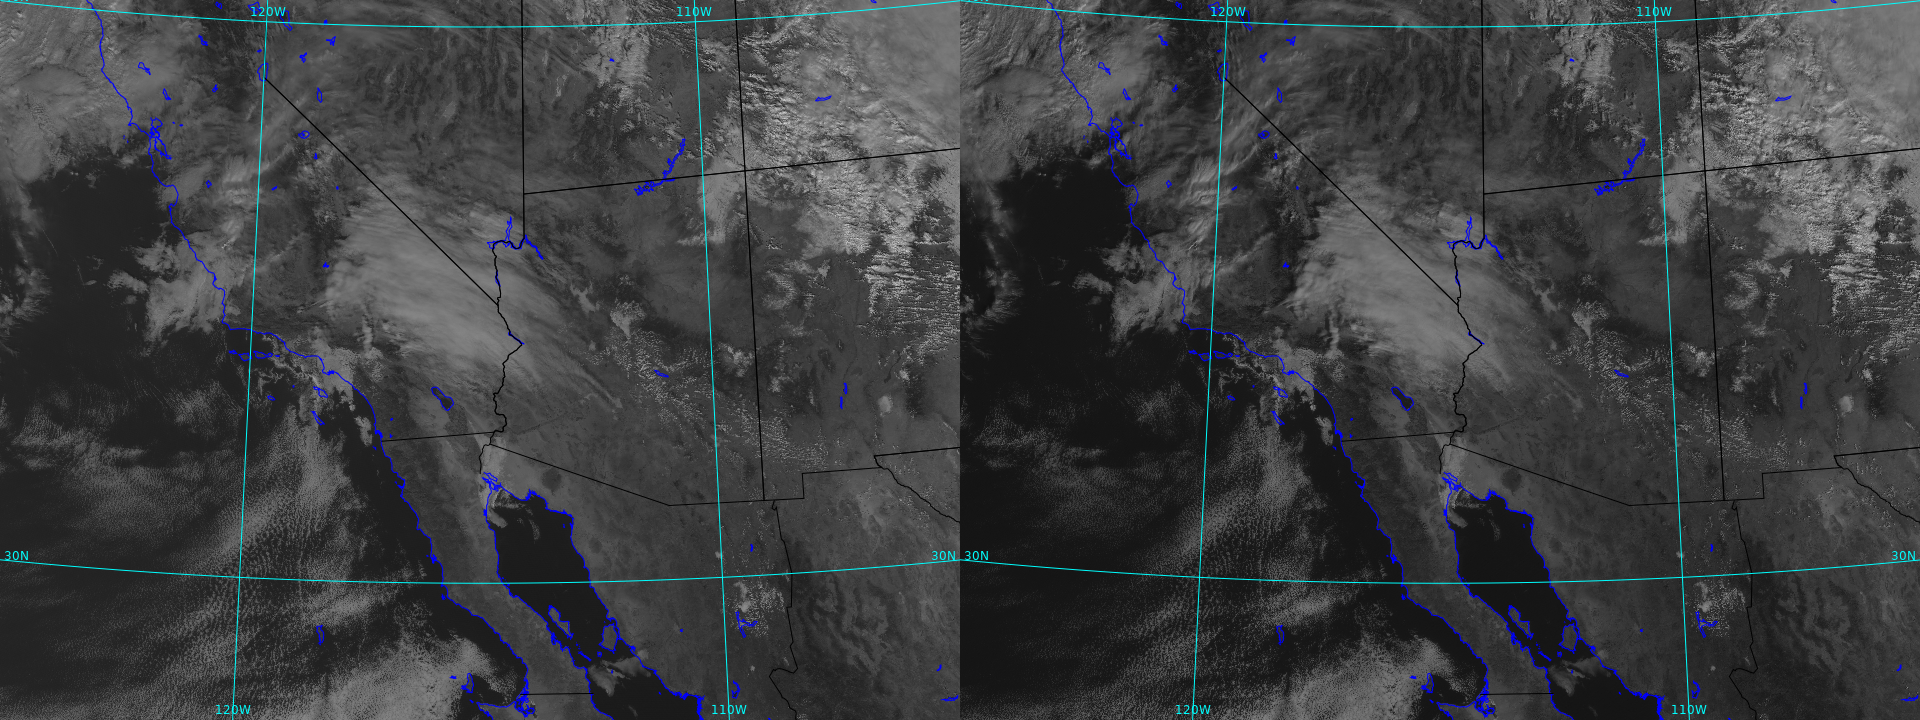
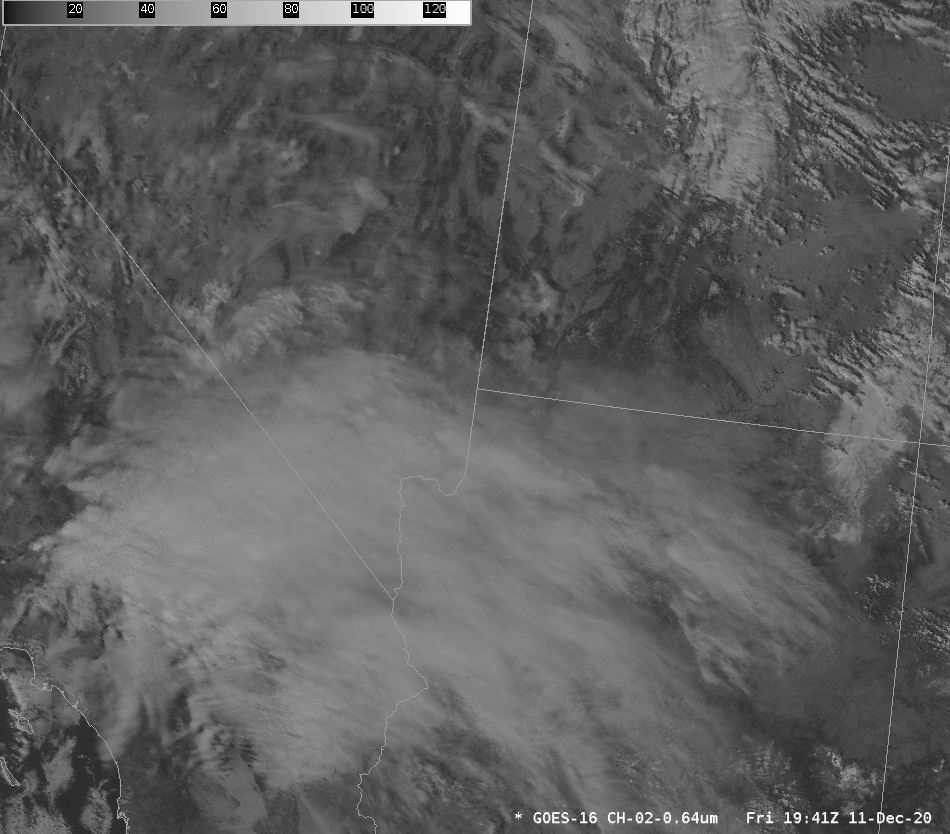
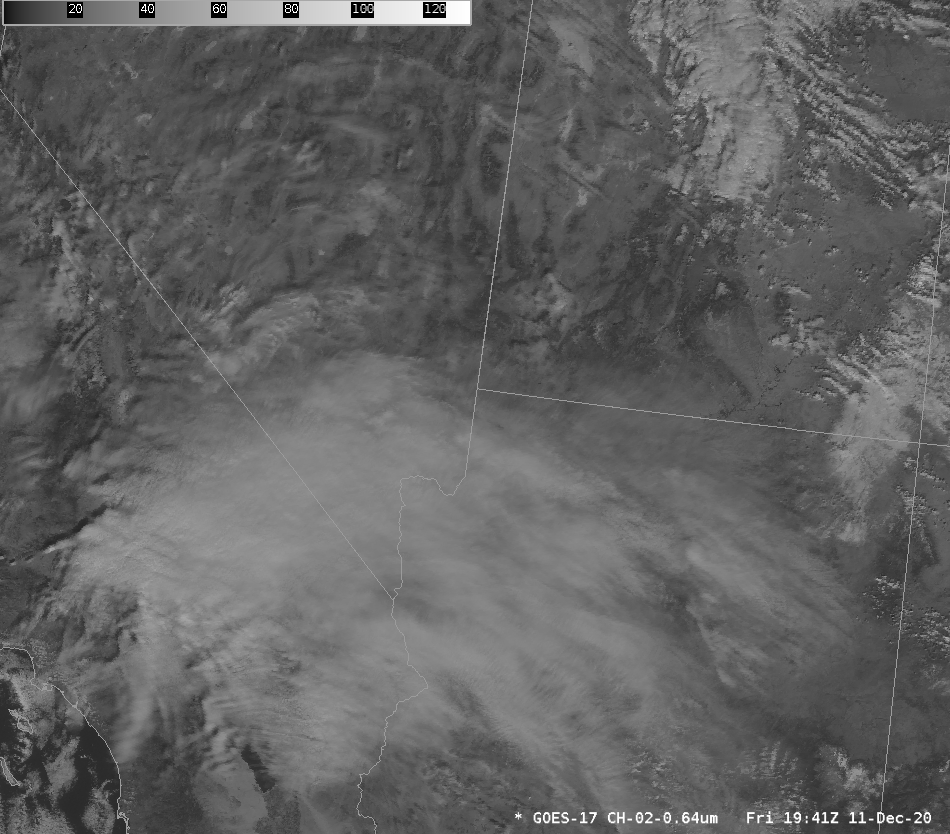
Unfortunately, Geo2Grid doesn’t (yet!) display Level 2 products. But AWIPS does. A somewhat later Stereoscopic image (1941 UTC on 11 December) is shown below. GOES-R data (CONUS and PACUS in this case) are shown in a common projection, with GOES-16 shown on the left and GOES-17 shown on the right.
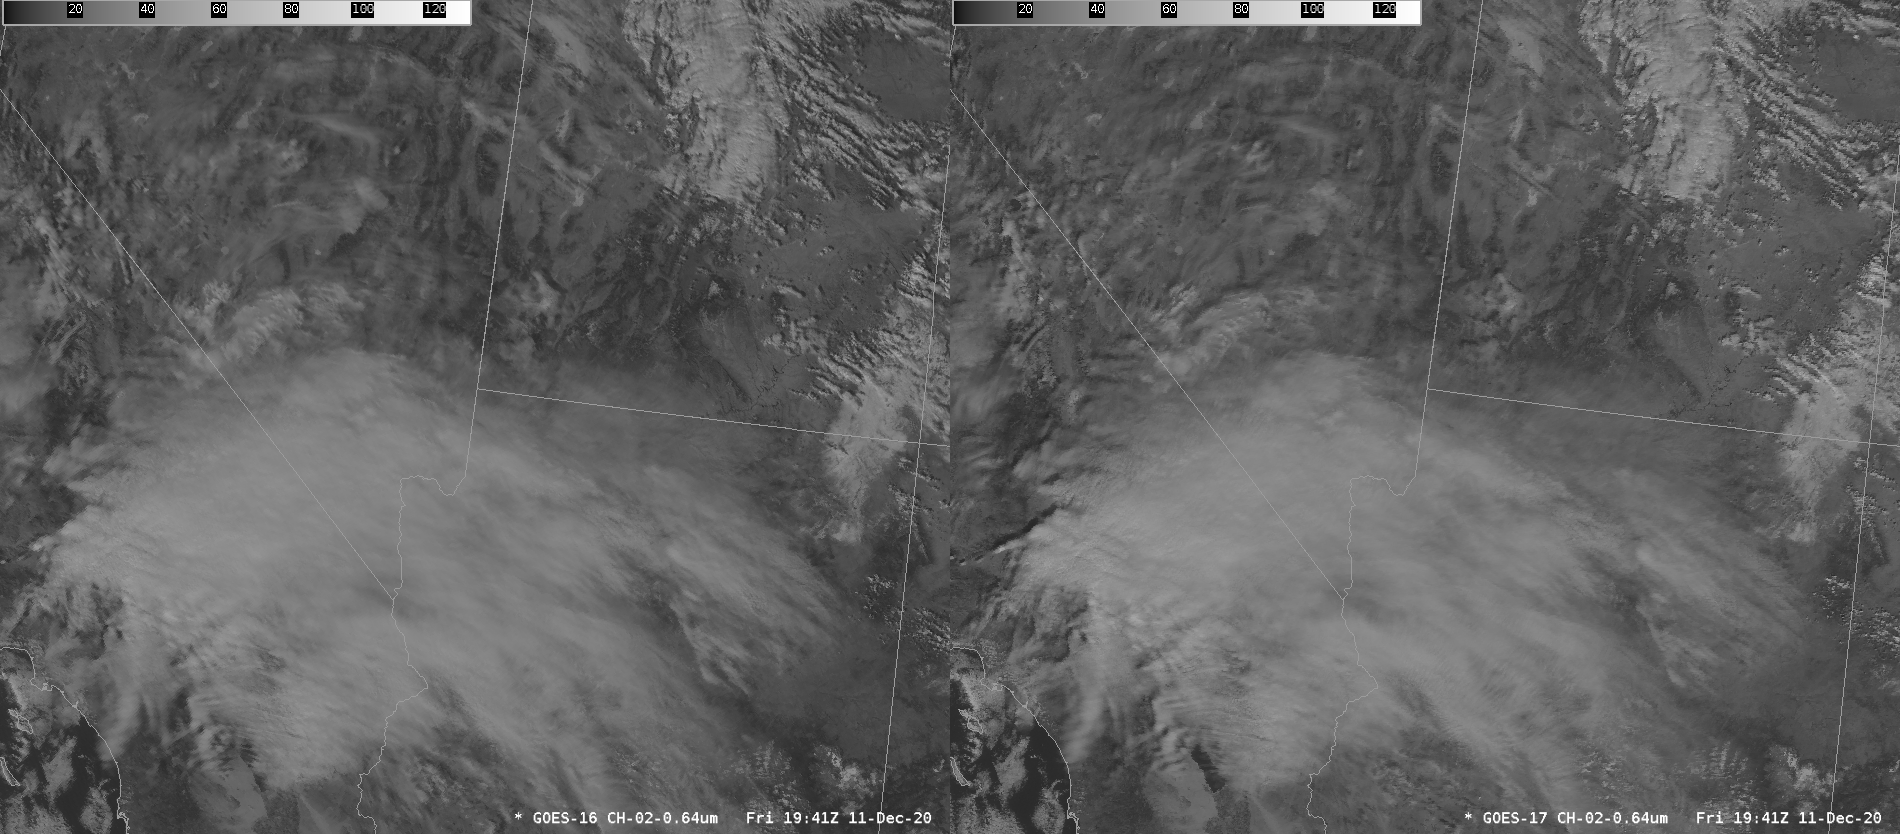
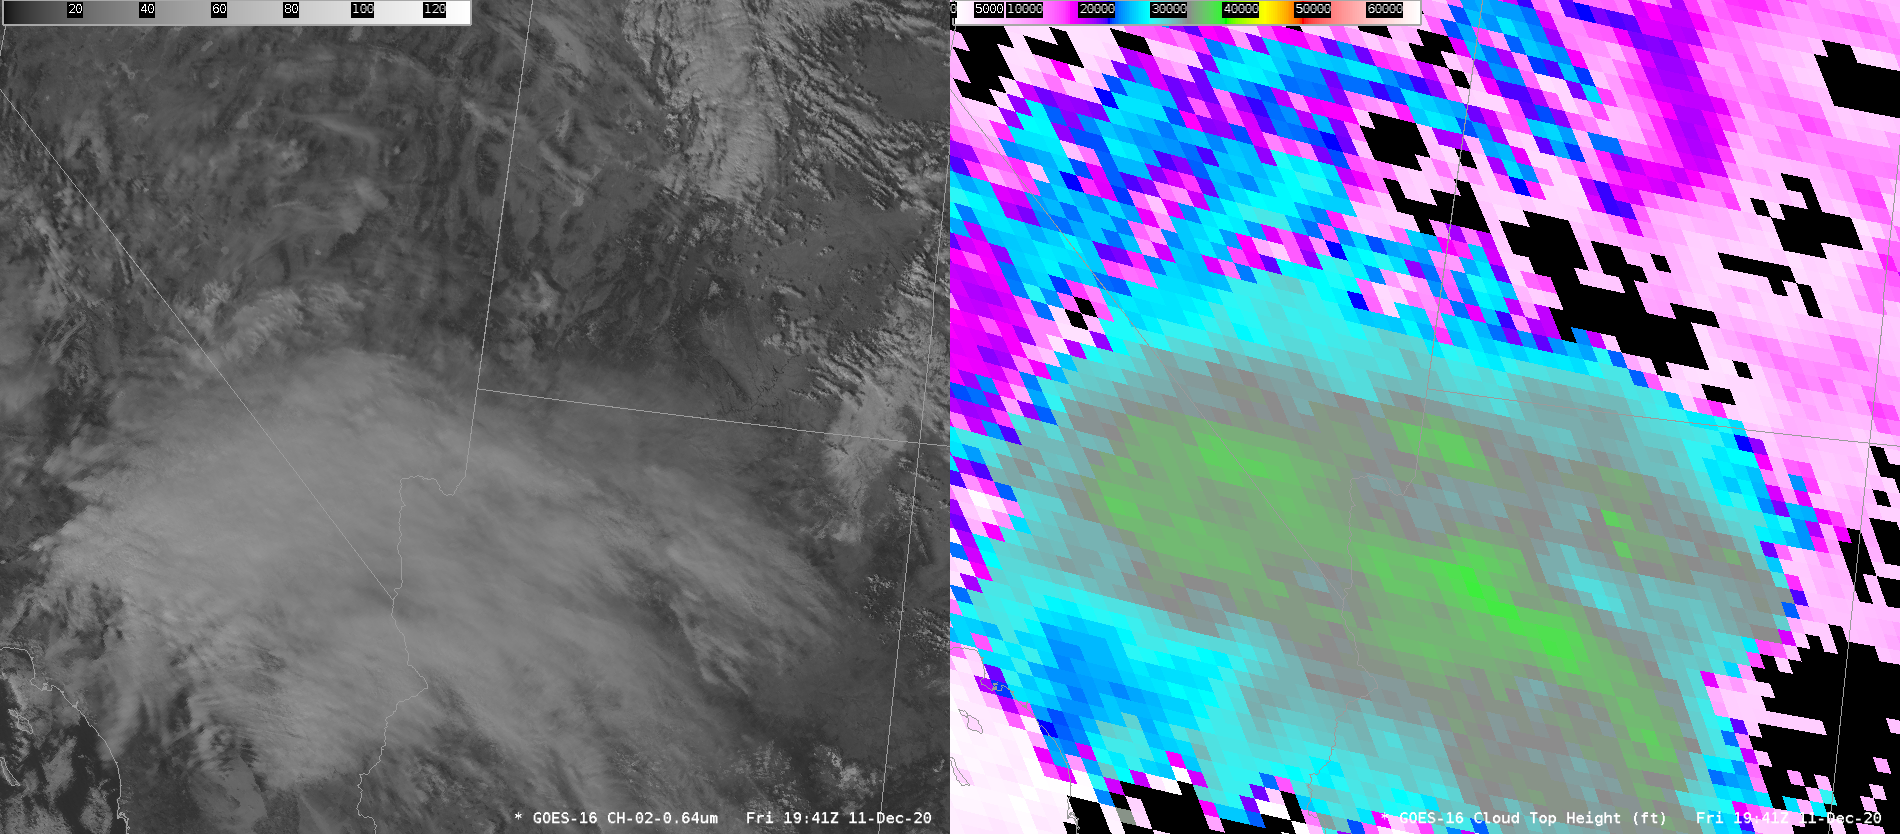
GOES-16 (left) and GOES-17 (right) visible imagery (0.64 µm) at 1941 UTC, 11 December 2020 (Click to enlarge)
Can quantitative information from the Cloud Top Height Level 2 product, shown below, be easily incorporated into stereoscopic imagery?
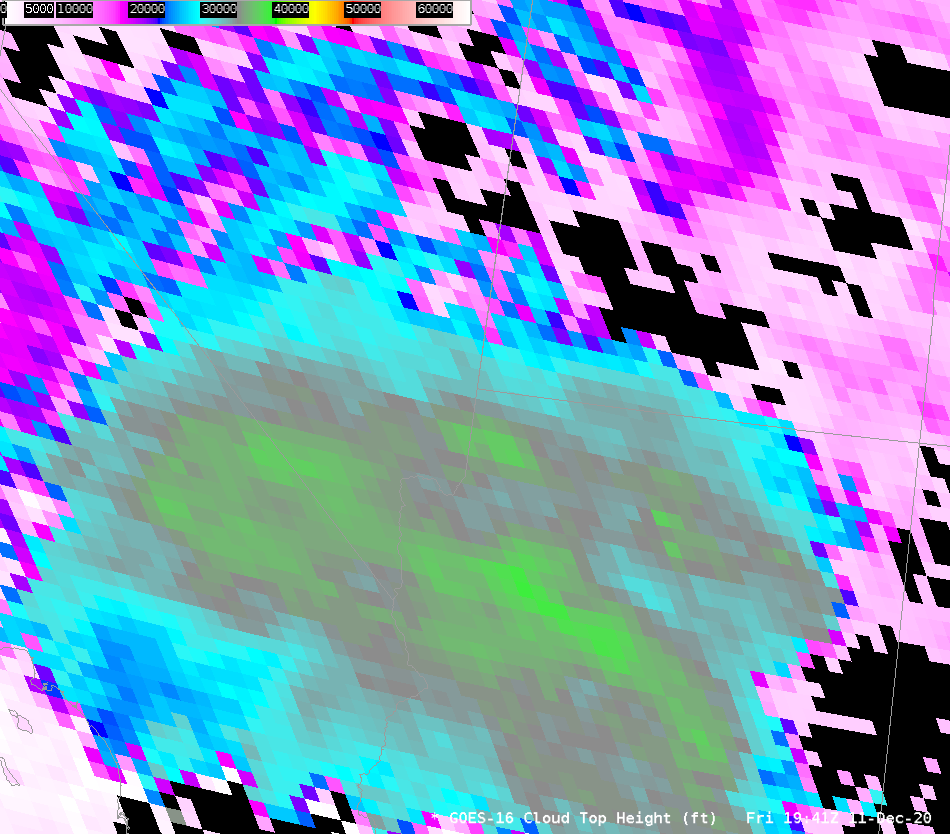
GOES-16 Cloud Top Heights, 1941 UTC on 11 December 2020 (Click to enlarge)
First, I tried making side-by-side imagery with GOES-16 Visible and GOES-16 Cloud Top Heights. That is shown below. Cross your eyes to combine the information. Although one may be able to view something here — by aligning the state boundaries, your blogger did not find this side-by-side view useful — except in the conventional sense, seeing features in the visible to the left and corresponding information in the Level 2 product on the right.
GOES-16 Visible (0.64 µm) imagery (left) and GOES-16 Cloud Top Height (Right), 1941 UTC on 11 December 2020 (Click to enlarge)
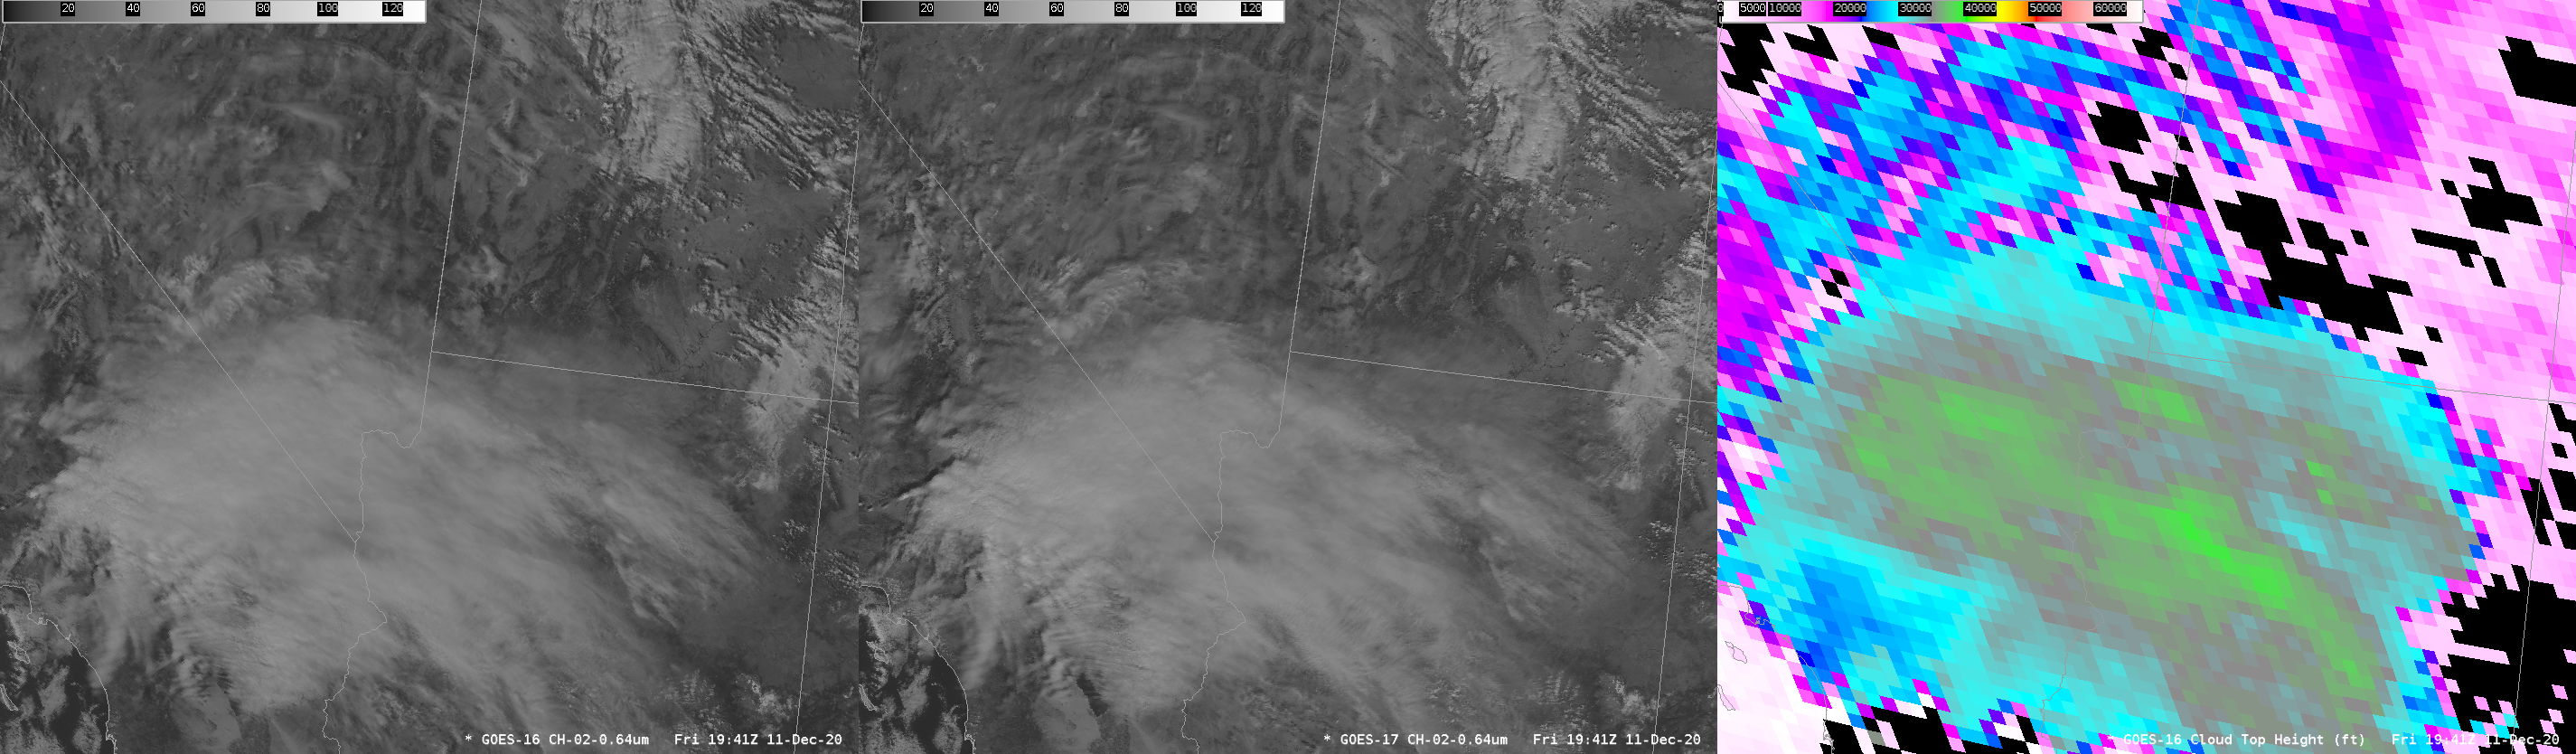
Including the Cloud Top imagery to the right of the stereoscopic pair, however, did allow for a simple (although, perhaps, headache-inducing) comparison between the perceived height differences in the visible imagery and the quantitative differences in the Level 2 product. If I had GOES-17 Cloud Heights, I would include those to the left of the visible pairs.
GOES-16 Visible (0.64 µm) imagery (left), GOES-17 VIsible (0.64 µm) imagery (center) and GOES-16 Cloud Top Height (Right), 1941 UTC on 11 December 2020 (Click to enlarge)
Perhaps the solution lies in color-enhancing the visible imagery based on the cloud top height. That is work for the future.
The Sandwich Product in AWIPS, a combination of visible imagery — proving texture — and infrared imagery providing color is one way to color the visible imagery based on cloud-top brightness temperatures (as a proxy for height). A 2.5-hour animation of the Sandwich product is shown below. It does provide an interesting way to view heights of clouds!

GOES-16 (Left) and GOES-17 (Right) Sandwich RGB Product, 1716 – 1941 UTC on 11 December 2020 (Click to animate)
View only this post
Read Less
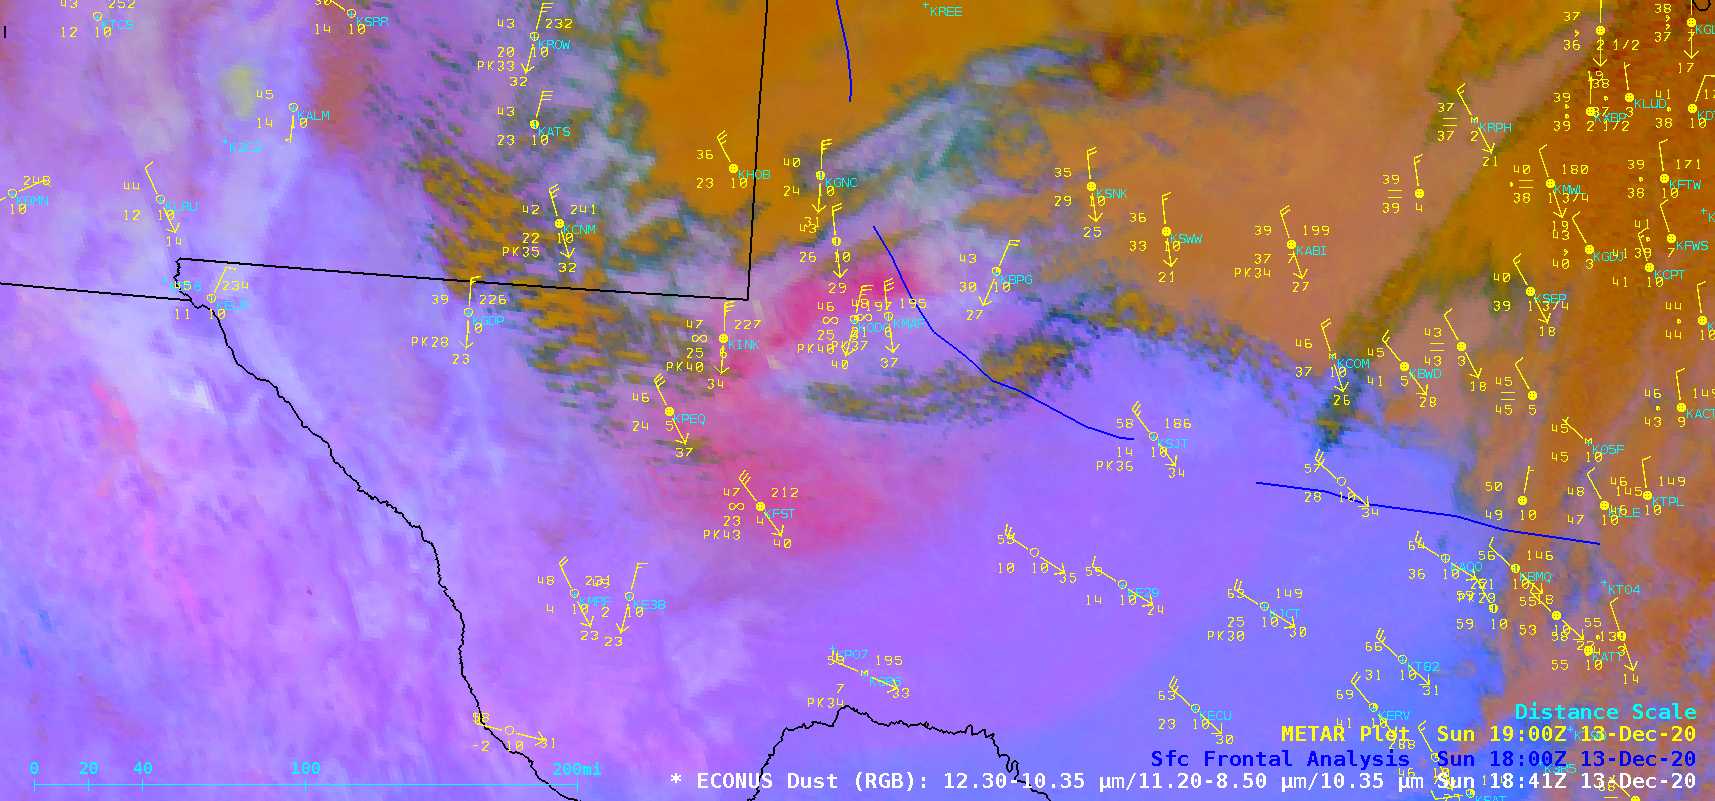
![GOES-16 Dust RGB images [click to play animation | MP4]](https://cimss.ssec.wisc.edu/satellite-blog/images/2020/12/201213_goes16_dustRGB_TX_anim.gif)
![GOES-16 True Color RGB images [click to play animation | MP4]](https://cimss.ssec.wisc.edu/satellite-blog/images/2020/12/201213_goes16_trueColorRGB_NM_TX_blowing_dust_anim.gif)

![Suomi NPP VIIRS Visible (0.64 µm), Near-Infrared (1.61 µm) and Shortwave Infrared (3.74 µm) images at 1734 UTC [click to enlarge]](https://cimss.ssec.wisc.edu/satellite-blog/images/2020/12/201211_1734utc_suomiNPP_viirs_visible_nearInfrared_shortwaveInfrared_MN_anim.gif)
![Plot of rawinsonde data from International Falls, Minnesota [click to enlarge]](https://cimss.ssec.wisc.edu/satellite-blog/images/2020/12/201211_KINL_RAOBS.GIF)
