GOES-17 (GOES-West) Shortwave Infrared (3.9 µm) and “Clean” Infrared Window (10.35 µm) images (above) displayed the thermal anomaly (cluster of hot pixels) and brief volcanic cloud resulting from an eruption of the Kilauea volcano on the Big Island of Hawai’i on 21 December 2020. The coldest cloud-top 10.35 µm infrared brightness temperature... Read More
![GOES-17 Shortwave Infrared (3.9 µm) and "Clean" Infrared Window (10.35 µm) images [click to play animation | MP4]](https://cimss.ssec.wisc.edu/satellite-blog/images/2020/12/hi_swir_zoom-20201221_083032.png)
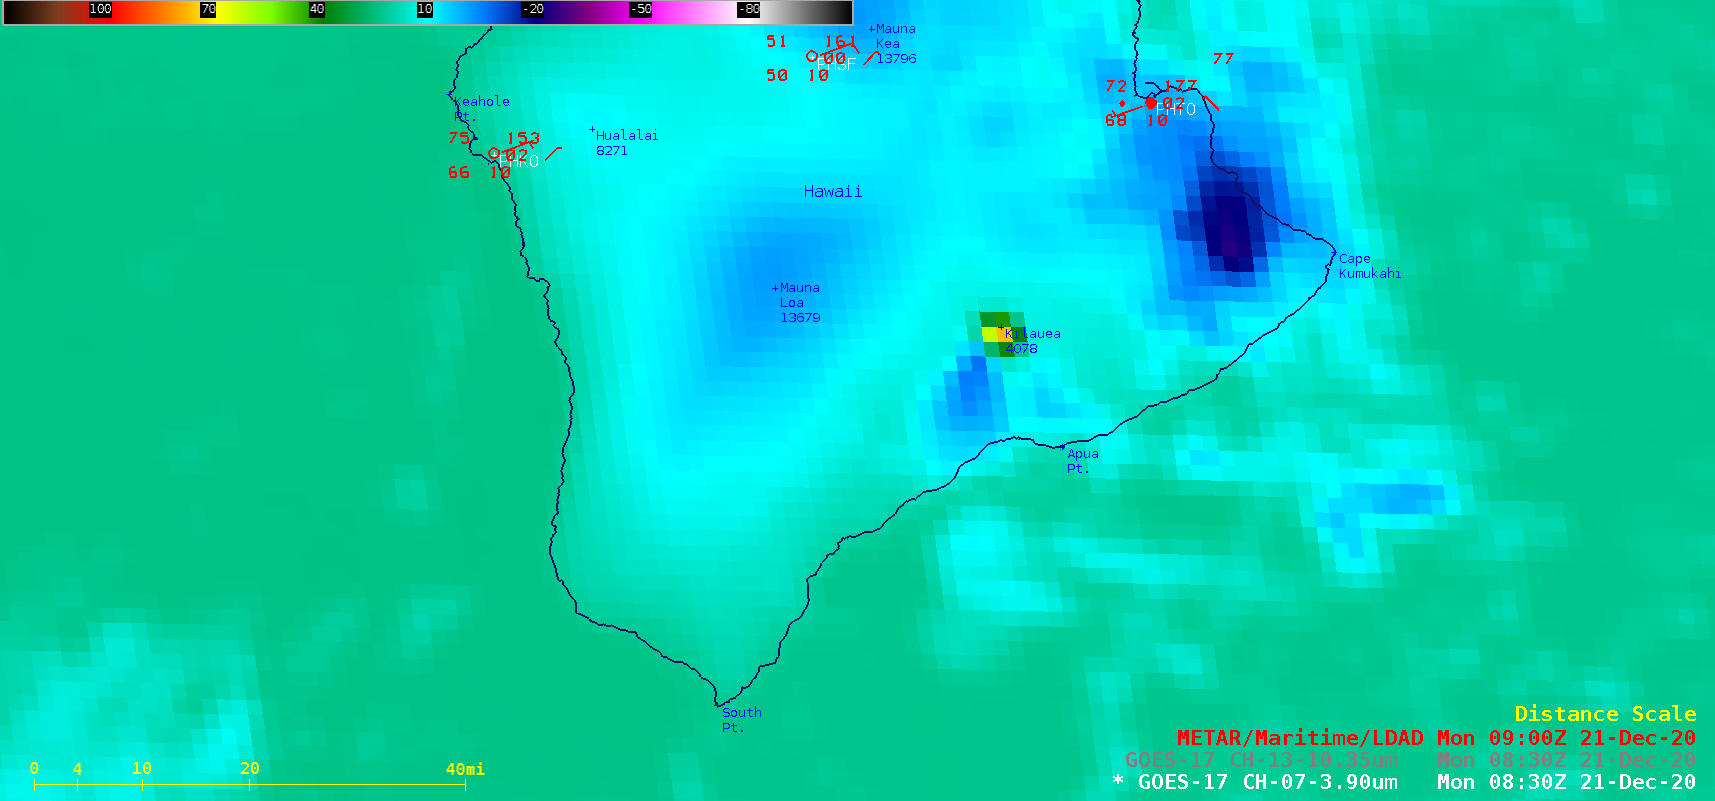
GOES-17 Shortwave Infrared (3.9 µm) and “Clean” Infrared Window (10.35 µm) images [click to play animation | MP4]
GOES-17
(GOES-West) Shortwave Infrared (
3.9 µm) and “Clean” Infrared Window (
10.35 µm) images
(above) displayed the thermal anomaly (cluster of hot pixels) and brief volcanic cloud resulting from an eruption of the Kilauea volcano on the Big Island of Hawai’i on 21 December 2020. The coldest cloud-top 10.35 µm infrared brightness temperature was -34.6ºC at 0840 UTC — which roughly corresponded to the 300 hPa or 9.6 km altitude according to 12 UTC rawinsonde data from nearby Hilo (
plot |
text). However, this volcanic cloud quickly dissipated in the very dry air aloft.
GOES-17 Near-infrared (1.61 µm and 2.24 µm) and Shortwave Infrared images (below) showed the variation in thermal signatures during the hours leading up to sunrise. The signature in Near-Infrared imagery was occasionally attenuated by the passage of trade wind cumulus clouds over the eruption site.
![GOES-17 Near-infrared (1.61 µm and 2.24 µm) and Shortwave Infrared (3.9 µm) images [click to play animation | MP4]](https://cimss.ssec.wisc.edu/satellite-blog/images/2020/12/G17_NIR_SWIR_KILAUEA_21DEC2020_B567_2020356_073117_0003PANELS_FRAME0000003.GIF)
GOES-17 Near-infrared (1.61 µm and 2.24 µm) and Shortwave Infrared (3.9 µm) images [click to play animation | MP4]
A comparison of Suomi NPP VIIRS Near-infrared (1.61 µm and 2.25 µm), Shortwave Infrared (3.75 µm) and Day/Night Band (0.7 µm) images
(below) provided a high spatial resolution view of the thermal and emitted light signatures of the ongoing eruption at 1221 UTC.
![Suomi NPP VIIRS Near-infrared (1.61 µm and 2.25 µm), Shortwave Infrared (3.75 µm) and Day/Night Band (0.7 µm) images [click to enlarge]](https://cimss.ssec.wisc.edu/satellite-blog/images/2020/12/201221_1221utc_suomiNPP_viirs_nearInfrared_shortwaveInfrared_dayNightBand_Kilauwea_HI_anim.gif)
Suomi NPP VIIRS Near-infrared (1.61 µm and 2.25 µm), Shortwave Infrared (3.75 µm) and Day/Night Band (0.7 µm) images (credit: William Straka, CIMSS) [click to enlarge]
A larger-scale view of GOES-17 Shortwave Infrared,
SO2 RGB and
Ash RGB images
(below) showed the southward transport of a mid/high-altitude plume of SO2
(lighter shades of yellow to cyan) from the initial eruption, followed by the southwestward transport of a more persistent low-altitude plume of SO2 as the eruption continued during the day. No signature of volcanic ash was indicated (either qualitatively on the Ash RGB images, or on retrieved
ash products from
this site). At times the thermal anomaly of the eruption site exhibited 3.9 µm infrared brightness temperatures as hot as 105ºC.
![GOES-17 Shortwave Infrared (3.9 µm), SO2 RGB and Ash RGB images [click to play animation | MP4]](https://cimss.ssec.wisc.edu/satellite-blog/images/2020/12/hi_so2-20201221_090032.png)
GOES-17 Shortwave Infrared (3.9 µm), SO2 RGB and Ash RGB images [click to play animation | MP4]
GOES-17 True Color RGB images created using
Geo2Grid (below) displayed the volcanic fog (or “vog”) plume that moved southwestward during the day — a portion of which became entrained into the circulation of a lee-side cyclonic gyre southwest of the Big Island.
![GOES-17 True Color RGB images [click to play animation | MP4]](https://cimss.ssec.wisc.edu/satellite-blog/images/2020/12/GOES-17_ABI_RadC_true_color_2020356_200117Z.png)
GOES-17 True Color RGB images [click to play animation | MP4]
View only this post
Read Less
![GOES-17 Shortwave Infrared (3.9 µm) and "Clean" Infrared Window (10.35 µm) images [click to play animation | MP4]](https://cimss.ssec.wisc.edu/satellite-blog/images/2020/12/201221_goes17_shortwaveInfrared_infraredWindow_Kilauea_eruption_HI_anim.gif)
![GOES-17 Near-infrared (1.61 µm and 2.24 µm) and Shortwave Infrared (3.9 µm) images [click to play animation | MP4]](https://cimss.ssec.wisc.edu/satellite-blog/images/2020/12/201221_goes17_nearInfrared_shortwavenfrared_Kilauea_eruption_anim.gif)
![GOES-17 Shortwave Infrared (3.9 µm), SO2 RGB and Ash RGB images [click to play animation | MP4]](https://cimss.ssec.wisc.edu/satellite-blog/images/2020/12/201221_goes17_shortwaveInfrared_so2RGB_ashRGB_Kilauea_eruption_HI_anim.gif)
![GOES-17 True Color RGB images [click to play animation | MP4]](https://cimss.ssec.wisc.edu/satellite-blog/images/2020/12/201221_goes17_trueColorRGB_Klauea_plume_anim.gif)
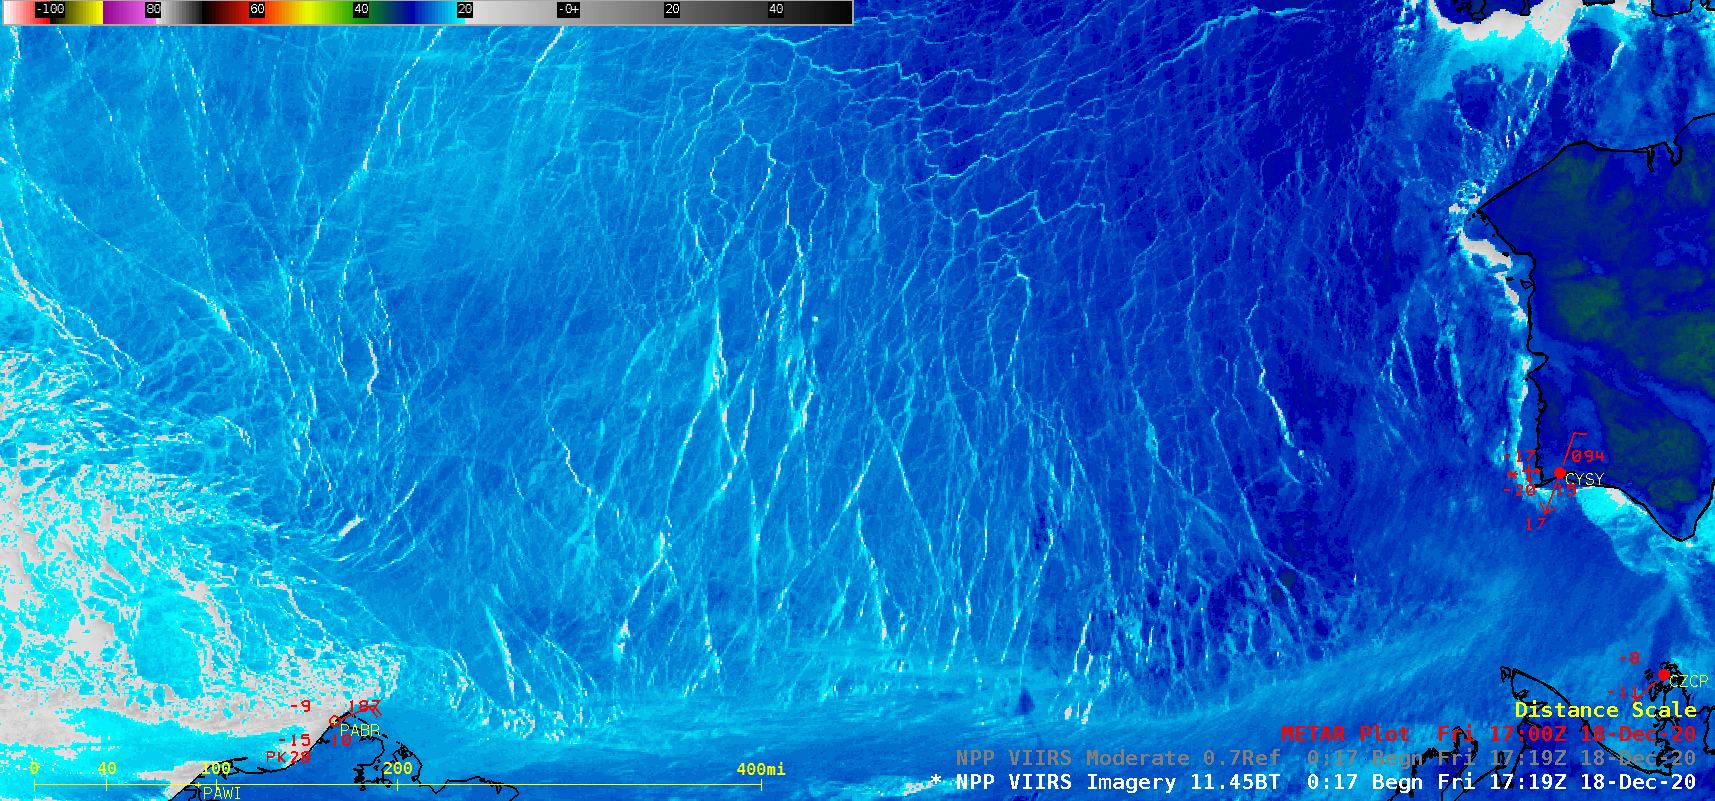
![Suomi NPP VIIRS Infrared Window (11.45 µm) images [click to play animation]](https://cimss.ssec.wisc.edu/satellite-blog/images/2020/12/201218_201220_suomiNPP_viirs_Beaufort_Sea_ice_leads_anim.gif)
![Suomi NPP VIIRS Infrared Window (11.45 µm) images, with plots of NM12 model surface winds [click to enlarge]](https://cimss.ssec.wisc.edu/satellite-blog/images/2020/12/201220_suomiNPP_viirs_infrared_nam12winds_Beaufort_Sea_ice_leads_anim.gif)

