1-minute Mesoscale Domain Sector GOES-16 (GOES-East) “Red” Visible (0.64 µm) images (above) revealed the fracturing of land-fast ice in the far southern portion of Lake Michigan on 19 February 2021. Although the westerly wind speeds were not particularly strong — generally 15-20 knots over water, including Metop ASCAT winds early in the day — these winds... Read More
![GOES-16 “Red” Visible (0.64 µm) images [click to play animation | MP4]](https://cimss.ssec.wisc.edu/satellite-blog/images/2021/02/lm_ice-20210219_180139.png)
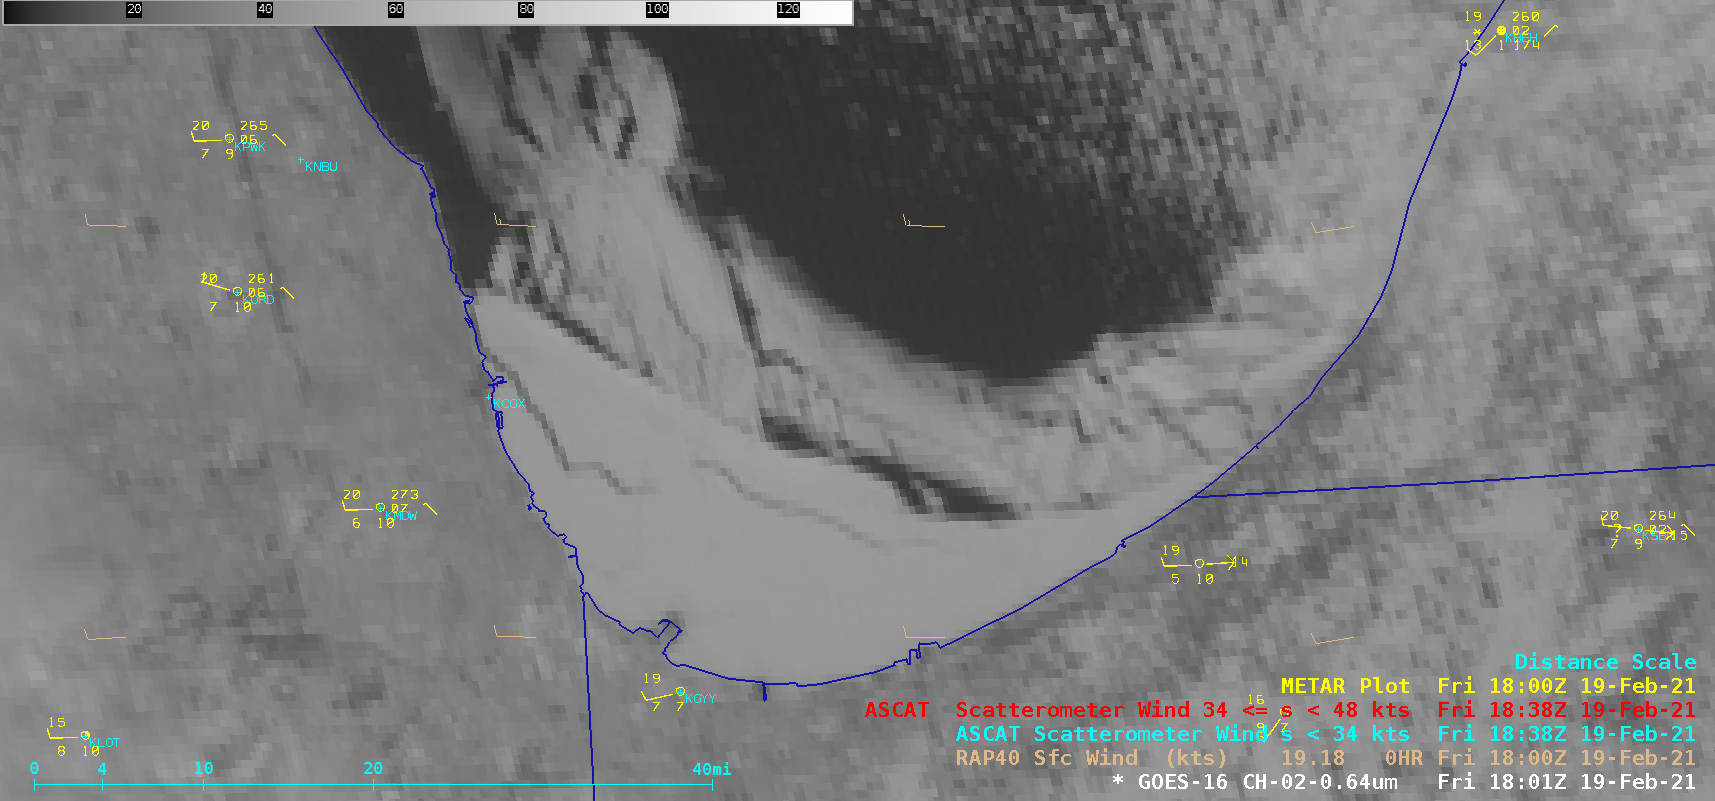
GOES-16 “Red” Visible (0.64 µm) images [click to play animation | MP4]
1-minute
Mesoscale Domain Sector GOES-16
(GOES-East) “Red” Visible (0.64 µm) images
(above) revealed the fracturing of land-fast ice in the far southern portion of Lake Michigan on
19 February 2021. Although the westerly wind speeds were not particularly strong — generally 15-20 knots over water, including Metop ASCAT winds early in the day — these winds in tandem with lake currents were enough to move some of this ice eastward.
Farther to the north over western Lake Superior, 5-minute CONUS sector GOES-16 Visible images (below) also showed a significant amount of ice motion during the day.
![GOES-16 “Red” Visible (0.64 µm) images [click to play animation | MP4]](https://cimss.ssec.wisc.edu/satellite-blog/images/2021/02/dlh_ice-20210219_191102.png)
GOES-16 “Red” Visible (0.64 µm) images [click to play animation | MP4]
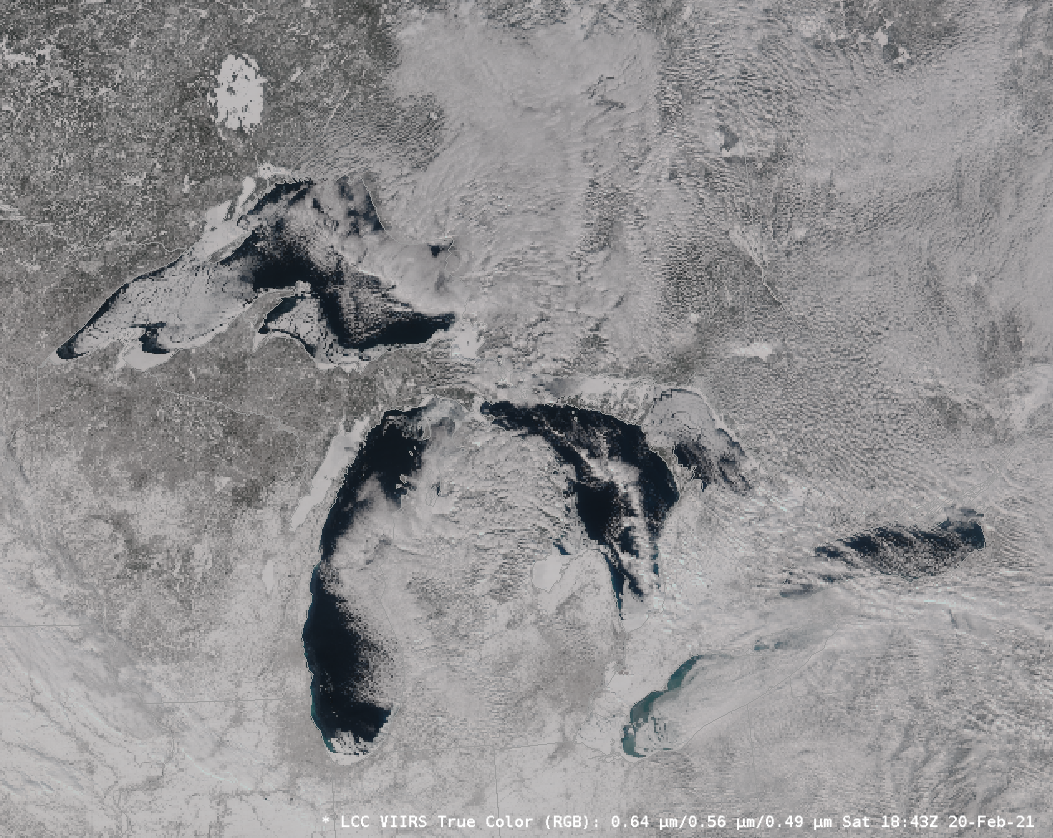
A 30-meter resolution Landsat-8 False Color RGB image viewed using
RealEarth (below) provided a more detailed look at the ice structure over western Lake Superior at 1653 UTC. Ice and areas of vegetation-sparse snow cover (rivers, lakes and wildfire burn scars) appear as shades of cyan in the RGB image.
![Landsat-8 False Color RGB image [click to enlarge]](https://cimss.ssec.wisc.edu/satellite-blog/images/2021/02/210219_1653utc_landsat8_falseColorRGB_Lake_Superior_ice.png)
Landsat-8 False Color RGB image [click to enlarge]
===== 20 February Update =====
![GOES-16 “Red” Visible (0.64 µm) images [click to play animation | MP4]](https://cimss.ssec.wisc.edu/satellite-blog/images/2021/02/chi_ice-20210220_210039.png)
GOES-16 “Red” Visible (0.64 µm) images [click to play animation | MP4]
On
20 February, another look at 1-minute GOES-16 Visible images over southern Lake Michigan
(above) indicated that new ice leads were opening up within individual ice floes that had broken free a day earlier.
===== 21 February Update =====
![GOES-16 “Red” Visible (0.64 µm) images [click to play animation | MP4]](https://cimss.ssec.wisc.edu/satellite-blog/images/2021/02/erie_ice-20210221_183101.png)
GOES-16 “Red” Visible (0.64 µm) images [click to play animation | MP4]
On
21 February, GOES-16 Visible images
(above) showed how southerly winds were shifting much the ice in Lake Erie to the north. However, the effects of lake currents on the ice motion were also evident. As mentioned in
this blog post, ice coverage on Lake Erie was around 80%.
View only this post
Read Less
![GOES-16 “Red” Visible (0.64 µm) images [click to play animation | MP4]](https://cimss.ssec.wisc.edu/satellite-blog/images/2021/02/210219_goes16_visible_Lake_Michigan_ice_anim.gif)
![GOES-16 “Red” Visible (0.64 µm) images [click to play animation | MP4]](https://cimss.ssec.wisc.edu/satellite-blog/images/2021/02/210219_goes16_visible_Lake_Superior_ice_anim.gif)
![GOES-16 “Red” Visible (0.64 µm) images [click to play animation | MP4]](https://cimss.ssec.wisc.edu/satellite-blog/images/2021/02/210220_goes16_visible_Lake_Michigan_ice_anim.gif)
![GOES-16 “Red” Visible (0.64 µm) images [click to play animation | MP4]](https://cimss.ssec.wisc.edu/satellite-blog/images/2021/02/210221_goes16_visible_Lake_Erie_ice_anim.gif)
![Meteosat-11 False Color RGB images [click to play animation | MP4]](https://cimss.ssec.wisc.edu/satellite-blog/images/2021/02/210219_Etna_rgb_anim.gif)
![Meteosat-11 Ash Loading product [click to play animation | MP4]](https://cimss.ssec.wisc.edu/satellite-blog/images/2021/02/210219_Etna_ash_loading_anim.gif)
![Meteosat-11 Ash Effective Radius product [click to play animation | MP4]](https://cimss.ssec.wisc.edu/satellite-blog/images/2021/02/210219_Etna_ash_effective_radius_anim.gif)
![Meteosat-11 Ash Height product [click to play animation | MP4]](https://cimss.ssec.wisc.edu/satellite-blog/images/2021/02/210219_Etna_ash_height_anim.gif)
![Meteosat-11 False Color RGB images [click to play animation | MP4]](https://cimss.ssec.wisc.edu/satellite-blog/images/2021/02/210219_Etna_so2rgb_anim.gif)
![Water Vapor images from GOES-17 (6.9 µm, left) and GOES-15 (6.5 µm, right) [click to play animation | MP4]](https://cimss.ssec.wisc.edu/satellite-blog/images/2021/02/210217_210218_goes17_goes15_waterVapor_EastPacifc_anim.gif)
