![Water Vapor images from GOES-17 (6.9 µm, left) and GOES-15 (6.5 µm, right) [click to play animation | MP4]](https://cimss.ssec.wisc.edu/satellite-blog/images/2021/02/210217_210218_goes17_goes15_waterVapor_EastPacifc_anim.gif)
Water Vapor images from GOES-17 (6.9 µm, left) and GOES-15 (6.5 µm, right) [click to play animation | MP4]
View only this post Read Less
The rapid intensification of a Storm Force low over the East Pacific Ocean during the 17-18 February 2021 period (surface analyses) could be seen on Water Vapor images from GOES-17 (6.9 µm) and GOES-15 (6.5 µm) (above). This was from the final full day of GOES-15 imaging operations (while the satellite... Read More
Water Vapor images from GOES-17 (6.9 µm, left) and GOES-15 (6.5 µm, right) [click to play animation | MP4]
View only this post Read Less
CIMSS produces Advanced Technology Microwave Sounder (ATMS) Lake Ice concentration images in a format that can be inserted into AWIPS. These images are created from data downloaded (available at this ftp site; imagery is also available here) at the DB antennae at CIMSS, and processed with MIRS algorithms (all MIRS products are available... Read More
ATMS Ice Concentration over the Great Lakes, from overlapping ascending Suomi-NPP passes on 30 January and 15 February 2021 (Click to enlarge)
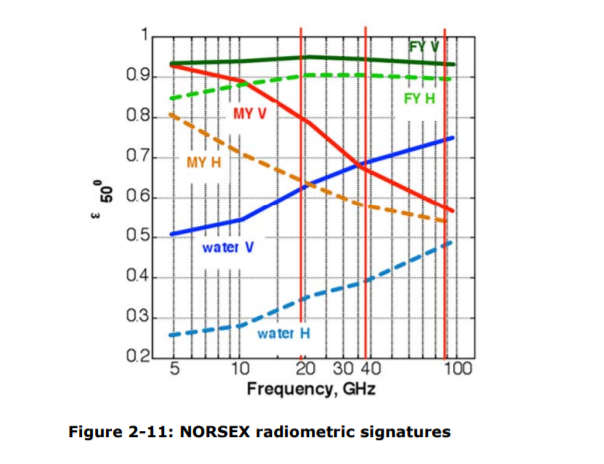
CIMSS produces Advanced Technology Microwave Sounder (ATMS) Lake Ice concentration images in a format that can be inserted into AWIPS. These images are created from data downloaded (available at this ftp site; imagery is also available here) at the DB antennae at CIMSS, and processed with MIRS algorithms (all MIRS products are available at this NOAA Website) that are incorporated into CSPP. This document (from ESA) includes a figure showing how emissivities of ice and water differ, allowing for discrimination between ice and open water. The differences are especially large at lower frequencies.
The animation below from NOAA/NESDIS of ice concentration over the USA (including the Great Lakes) (source) shows obvious increases and decreases in ice concentration; given the general very cold conditions over the Great Lakes during this time (especially over Lakes Michigan and Superior), the reduction in ice cover on 14-15 February is inconsistent with the cold weather.
Ice coverage increases from 10-13 February and then decreases. This change in ice coverage matches view angle changes from the ATMS instrument on Suomi NPP, and those view angle changes affect the spatial resolution of the measurements. There was a near-nadir afternoon pass on 10 February, and diagnosed ice in Lake Michigan was at a minimum; ascending pass views of Lake Michigan on 12 and 13 February are near the limb and diagnosed ice over Lake Michigan reached a maximum; the view was near nadir again on 15 February when, again, diagnosed lake ice was at a minimum. (Suomi NPP Orbit paths are available here). It is important when using Ice Coverage data to know the view angle from the satellite!
NPP MIRS Ice Coverage, 4 – 15 February 2021, from Ascending (afternoon) Passes (Click to enlarge)
MIRS algorithms to compute Ice Concentration use information from ATMS channels 1, 2, 3, 16 and 17. These 5 channels have footprints ranging from 15 to 75 km (at satellite nadir), as shown in the image below, from this paper. Note especially how the footprints increase in size at the limb: channel 17’s footprint ranges from 15×15 km at nadir to 68×30 km at the limb! A challenge in using ATMS is that the microwave footprint can easily observe both land and water, in which case the microwave data will not give values representative of the lake coverage.

Scanning geometry for 22 ATMS channels. The figure includes footprint sizes at nadir and at the limb (Click to enlarge)
The figure below shows circles with diameters of 15, 50 and 75 km; the smaller circle is the approximate nadir footprint of channel 16 and 17 at ATMS; the larger circle is the approximate nadir footprint of channels 1 and 2. Lake Ice resolution from MIRS might be considered to be of the order of 50 km.
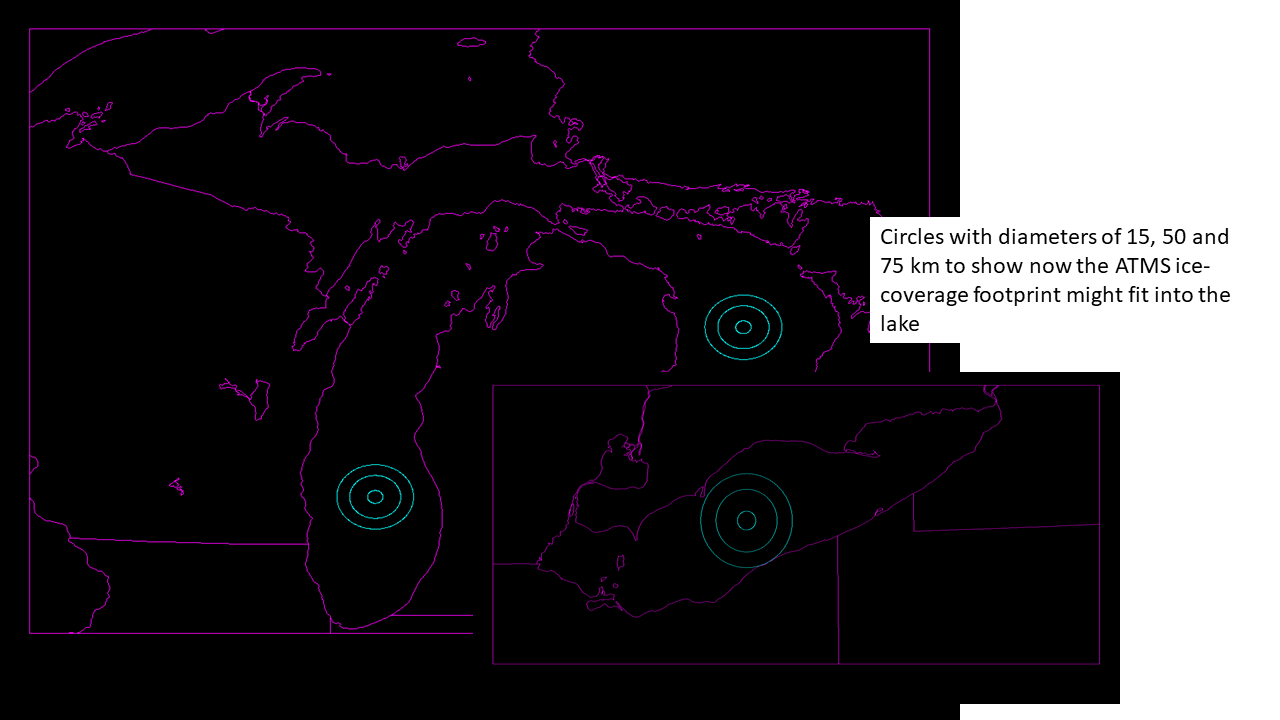
Circles with diameters of 15, 50 and 75 km in Lakes Michigan, Huron and (inset) Erie (click to enlarge)
NOAA-20 and Suomi-NPP, the two satellites that carry ATMS as part of their payloads, both have 16-day repeats. That is: the satellite traces out the same path every 16 days; in addition, paths are very similar every 5 or 6 days. See, for example, this toggle of (Suomi NPP) NUCAPS soundings points over the South Pacific ocean, on 25 July and 10 August 2019, 16 days apart. The same orbit is traced out on these two days. That is why the ATMS ice concentration plots at the top of this post are from 30 January and 15 February: 16 days apart. The two orbit mappings at the links are identical. The 15 February image of orbits is shown below.
Interpretation of the Ice Concentration imagery at the top of this blog post requires knowledge about the path of Suomi-NPP shown below. Lake Michigan and western Lake Superior are close to nadir, and there should be some ATMS footprints entirely within those lakes. Lakes Huron, Erie and Ontario are far enough away that a user might not trust 100% the data being presented. The ice coverage change between the two days might be useful: there is a general increase in concentration over coastal Lakes Michigan and Superior.

Predicted Suomi-NPP Orbits for 15 February 2021 (Click to enlarge)
A morning descending pass of Suomi-NPP moved over eastern Lake Ontario, giving the best resolution over that small Great Lake. The 0659 UTC image from 16 February is shown below. Notice the difference in Lakes Superior and Michigan between this image (for which Lakes Superior and Michigan are near the limb) and the image at top (for which Lakes Superior and Michigan are near nadir).
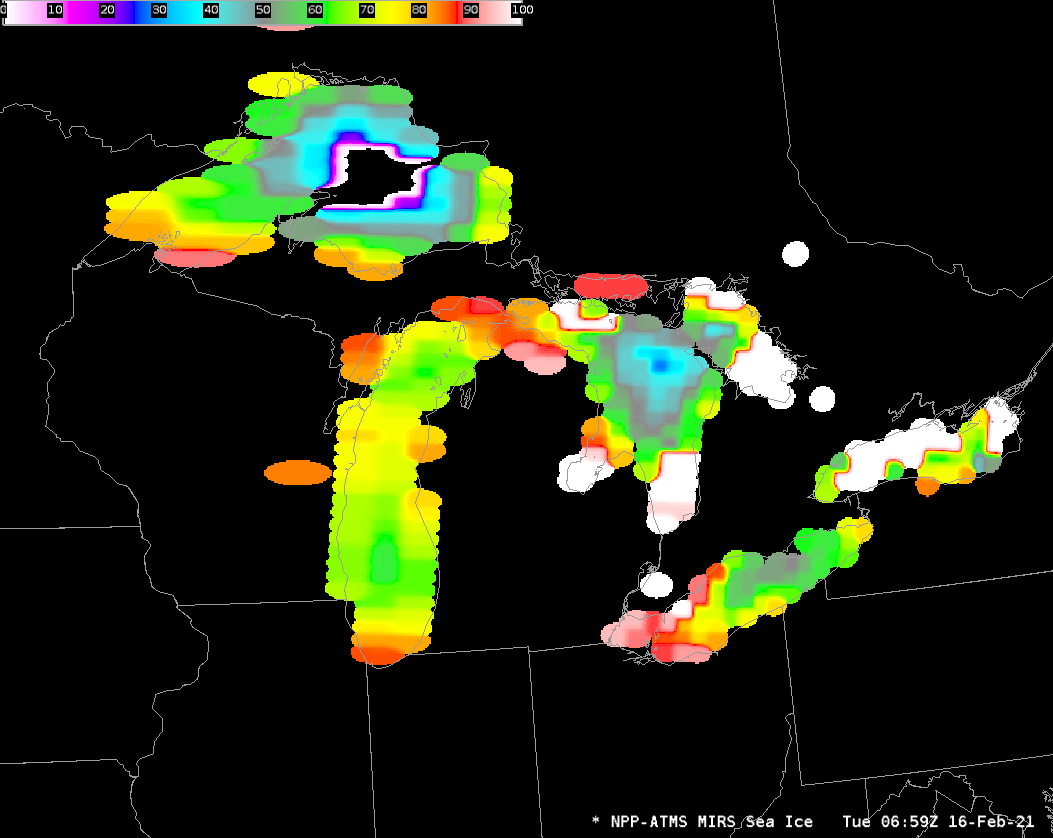
Suomi NPP ATMS Estimates of Lake Ice, 0659 UTC on 16 February 2021 (Click to enlarge)
The 15 February 2021 analysis (from this page) from NOAA’s Great Lakes Environmental Research Lab (GLERL) is shown below. Consider the ATMS imagery as an approximation to the observed field. Care in interpretation of ATMS data is a necessity because of errors that occur when pixels are not entirely over water. That is a frequent occurrence when the satellite is scanning along the limb.

Ice concentration over the Great Lakes, from GLERL, 15 February 2021 (Click to enlarge)
The toggle below (from this site) highlights resolution differences between ATMS Channel 1 (23.8 GHz), with 75-km resolution at nadir, and ATMS Channel 17 ( 165.5 GHz), with 15-km resolution at nadir. Note also the differences in the signals between western Lake Erie (ice covered) and eastern Lake Erie (more open water).
ATMS imagery (Channels 1 and 17) derived from Suomi NPP at ~1800 UTC on 17 February 2021 (NPP overflew Buffalo NY on this day) (Click to enlarge)
View only this post Read Less
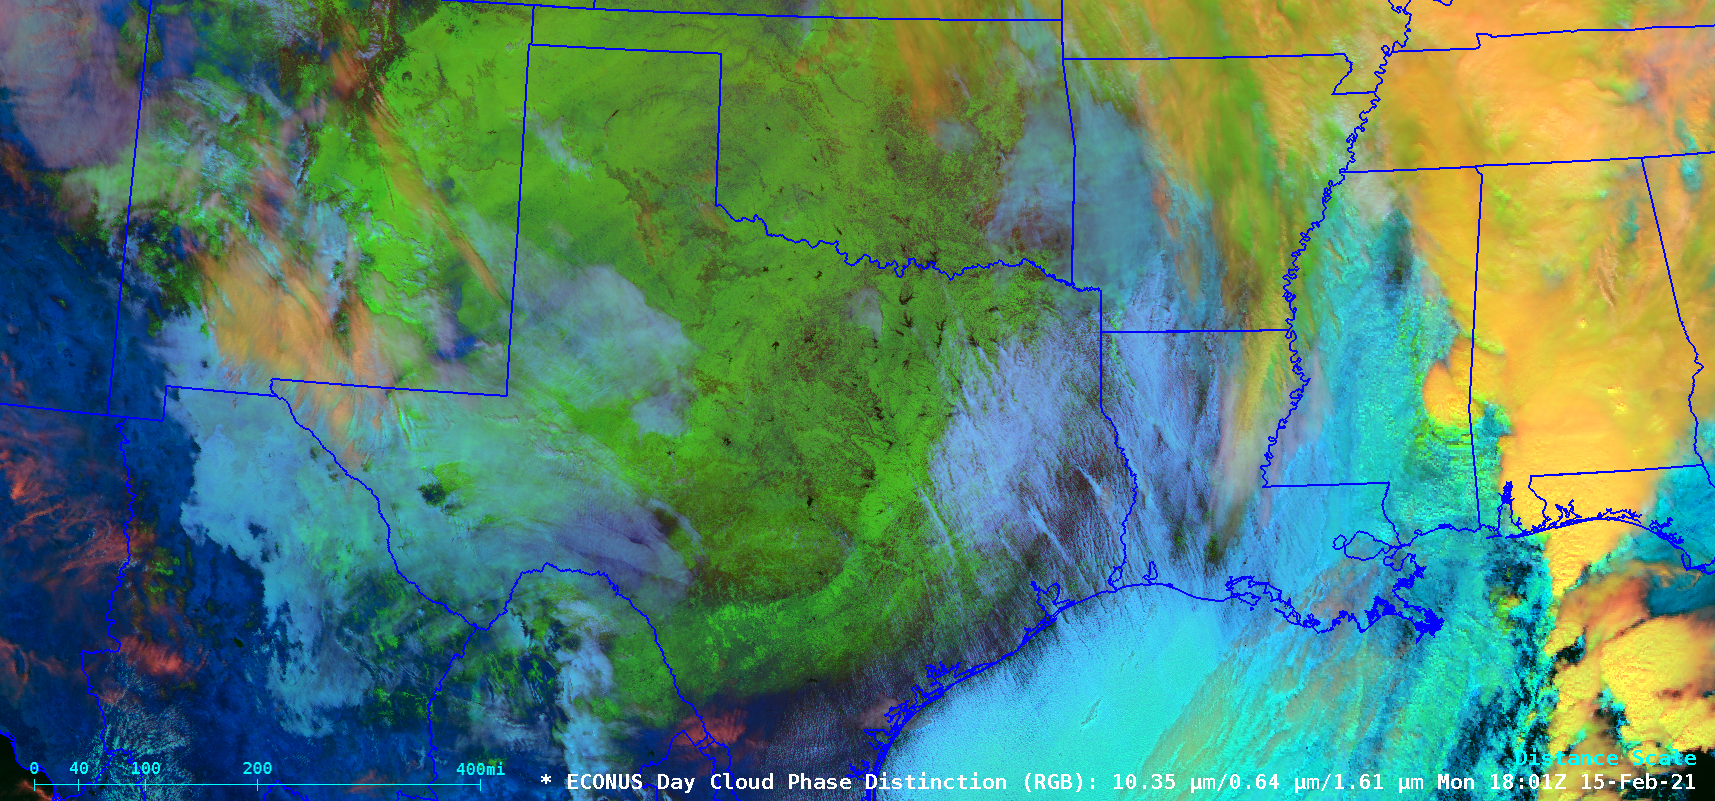
In the wake of a southward surge of arctic air across the central US — which produced surface temperatures as cold as -50ºF in Minnesota on 13 February — GOES-16 (GOES-East) Day Cloud Phase Distinction RGB images (above) showed the large areal extent of snow cover (brighter shades of green) across Oklahoma, New Mexico and Texas on 15 February 2021. In... Read More
![GOES-16 Day Cloud Phase Distinction RGB images [click to play animation | MP4]](https://cimss.ssec.wisc.edu/satellite-blog/images/2021/02/210215_goes16_dayCloudPhaseDistinctionRGB_OK_TX_snow_cover_anim.gif)
GOES-16 Day Cloud Phase Distinction RGB images [click to play animation | MP4]
As the Arctic chill continues to grapple the Plains, numerous new record lows were established this morning. Many of these locations will experience even lower temperatures by Tuesday morning, with additional record lows expected. pic.twitter.com/w3QifTxQkU
— NWS Weather Prediction Center (@NWSWPC) February 15, 2021
![GOES-16 Day Cloud Phase Distinction RGB images [click to play animation | MP4]](https://cimss.ssec.wisc.edu/satellite-blog/images/2021/02/210215_goes16_dayCloudPhaseDistinctionRGB_TX_snow_cover_anim.gif)
GOES-16 Day Cloud Phase Distinction RGB images [click to play animation | MP4]
![GOES-16 Near-Infrared “Snow/Ice” (1.61 µm) images, with and without plots of surface reports [click to play animation | MP4]](https://cimss.ssec.wisc.edu/satellite-blog/images/2021/02/210215_goes16_nearInfraredSnowIce_TX_anim.gif)
GOES-16 Near-Infrared “Snow/Ice” (1.61 µm) images, with and without plots of surface reports [click to play animation | MP4]
![GOES-16 Near-Infrared “Snow/Ice” (1.61 µm) images [click to play animation | MP4]](https://cimss.ssec.wisc.edu/satellite-blog/images/2021/02/210215_goes16_nearInfraredSnowIce_KAMA_plume_anim.gif)
GOES-16 Near-Infrared “Snow/Ice” (1.61 µm) images [click to play animation | MP4]
![Landsat-8 False Color RGB image [click to enlarge]](https://cimss.ssec.wisc.edu/satellite-blog/images/2021/02/210215_1721utc_landsat8_falseColorRGB_KAMA_plume_anim.gif)
Landsat-8 False Color RGB image [click to enlarge]
===== 16 February Update =====
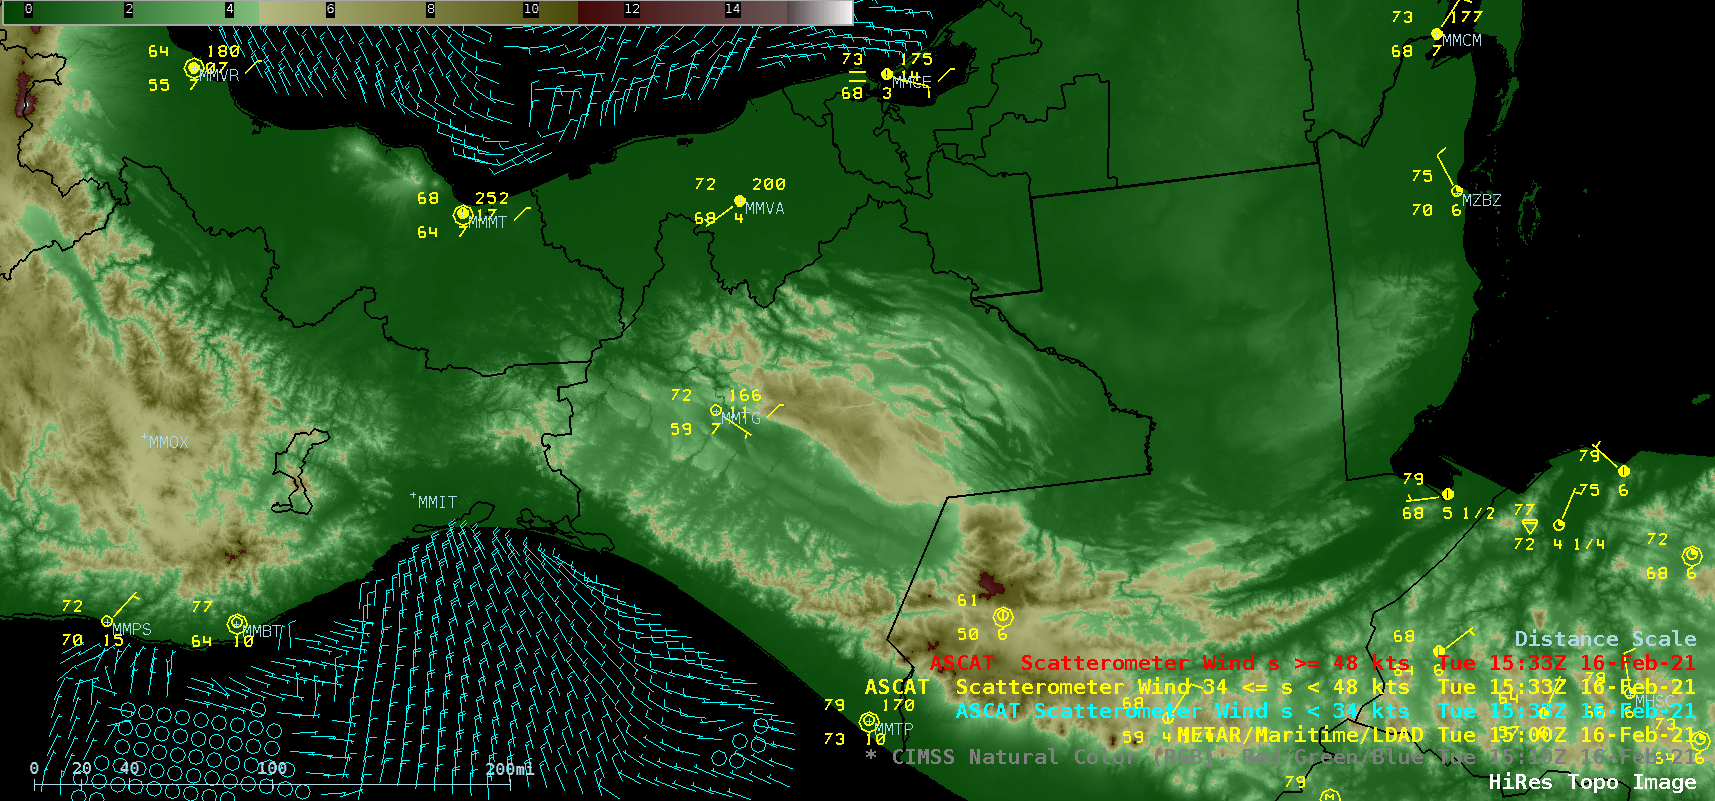
![GOES-16 CIMSS Natural Color RGB images, with plots of Metop-A ASCAT winds and surface/ship reports [click to play animation | MP4]](https://cimss.ssec.wisc.edu/satellite-blog/images/2021/02/210216_goes16_cimssNaturalColorRGB_ascat_Tehuano_anim.gif)
GOES-16 CIMSS Natural Color RGB images, with plots of Metop-A ASCAT winds and surface/ship reports [click to play animation | MP4]
With a low sun angle maximizing forward scattering, a plume of blowing dust could be seen right after sunrise in GOES-17 (GOES-West) True Color RGB images created using Geo2Grid (below), moving southward across the Gulf of Tehuantepec.
![GOES-17 True Color RGB images [click to play animation | MP4]](https://cimss.ssec.wisc.edu/satellite-blog/images/2021/02/210216_goes17_trueColorRGB_Tehuano_anim.gif)
GOES-17 True Color RGB images [click to play animation | MP4]
? Starting a thread with records, stats, and other superlatives from the mid-February winter weather blitz. This may not be everything — there’s too much going on! — but these are the things that I’ve noticed. ?????
— Alex Lamers (@AlexJLamers) February 17, 2021
View only this post Read Less

Synthetic Aperture Radar (SAR) imagery can be used to produce very high resolution mapping of winds. Imagery is available in selected domains at this NOAA/OSPO website; OSPO is the Office of Satellite Product Observations. Data are available from three different satellites: Sentinel-1/Sentinel-2 (managed by the European Space Agency) and RADARSAT (managed by the Canadian Space Agency). These space-borne radars can... Read More
Sentinel-1A wind information over northern Lake Michigan, 2342 UTC on 14 February 2021 (Click to enlarge)
Synthetic Aperture Radar (SAR) imagery can be used to produce very high resolution mapping of winds. Imagery is available in selected domains at this NOAA/OSPO website; OSPO is the Office of Satellite Product Observations. Data are available from three different satellites: Sentinel-1/Sentinel-2 (managed by the European Space Agency) and RADARSAT (managed by the Canadian Space Agency). These space-borne radars can operate in a mode that provides very small-scale wind information, as shown above. Note the fine detail in the winds — elongated regions of winds in excess of 20 knots from north of Green Bay southeastward across Lake Michigan to North and South Manitou islands. What does the ABI Imagery look like at the same time?
GOES-16 Band 7 (3.9 µm) imagery, below, similarly shows three parallel lines of colder cloud tops (the greyscale enhancement used is such that colder values are whiter). SAR data shows that convective bands over the lake have stronger surface winds than regions in between the convective bands.
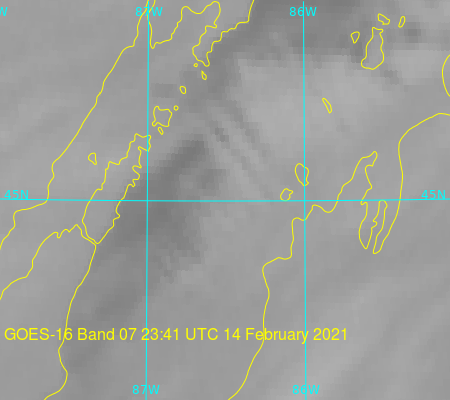
GOES-16 Band 7 Shortwave Infrared (3.9 µm) imagery, 2341 UTC on 14 February 2021
View only this post Read Less
