
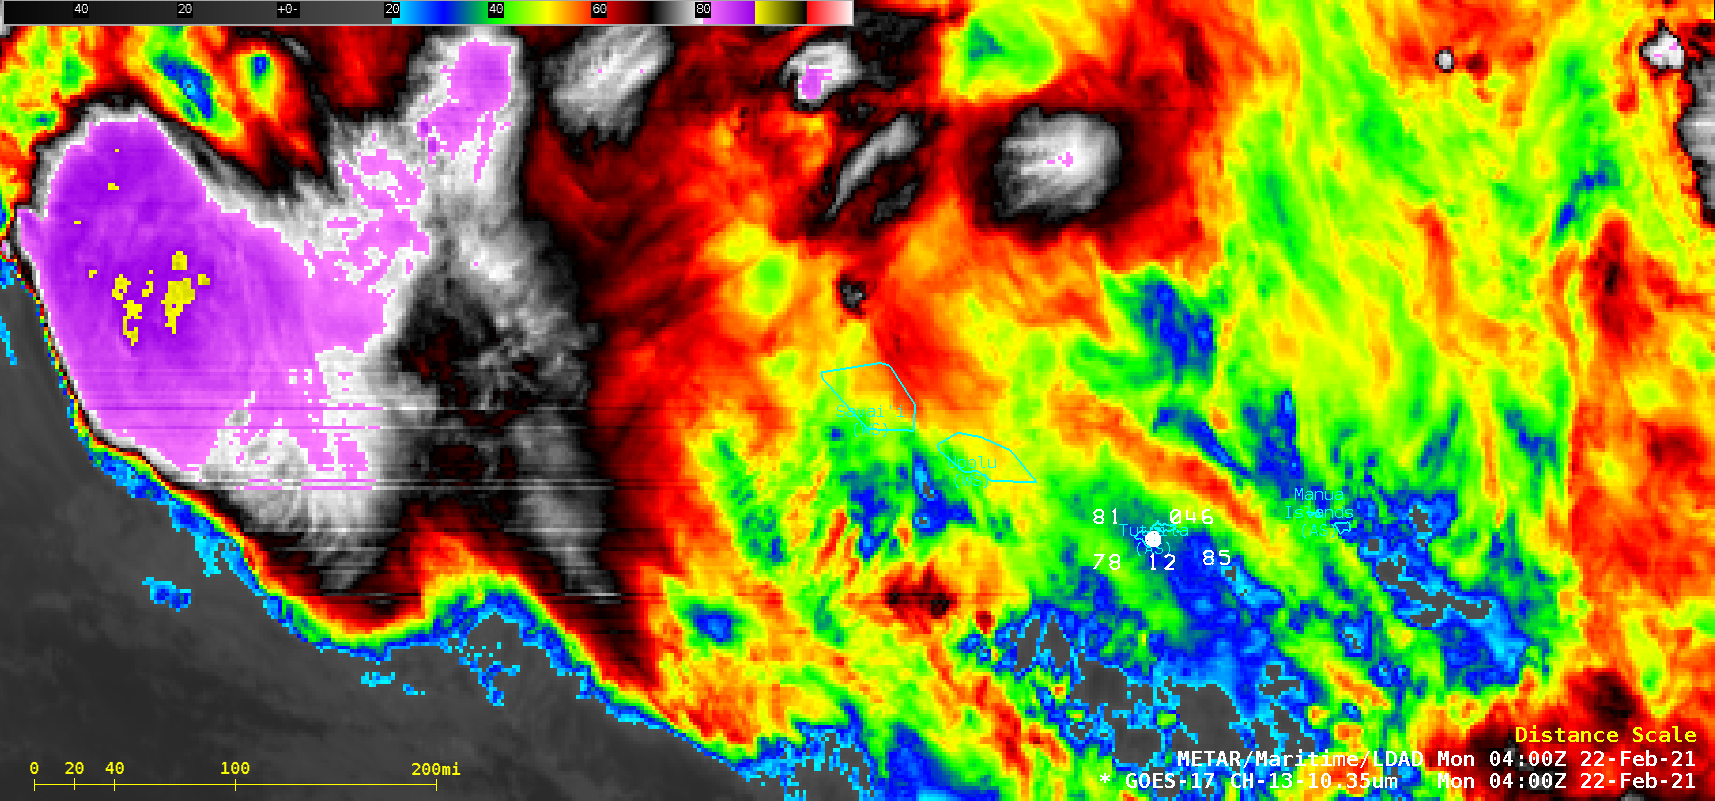
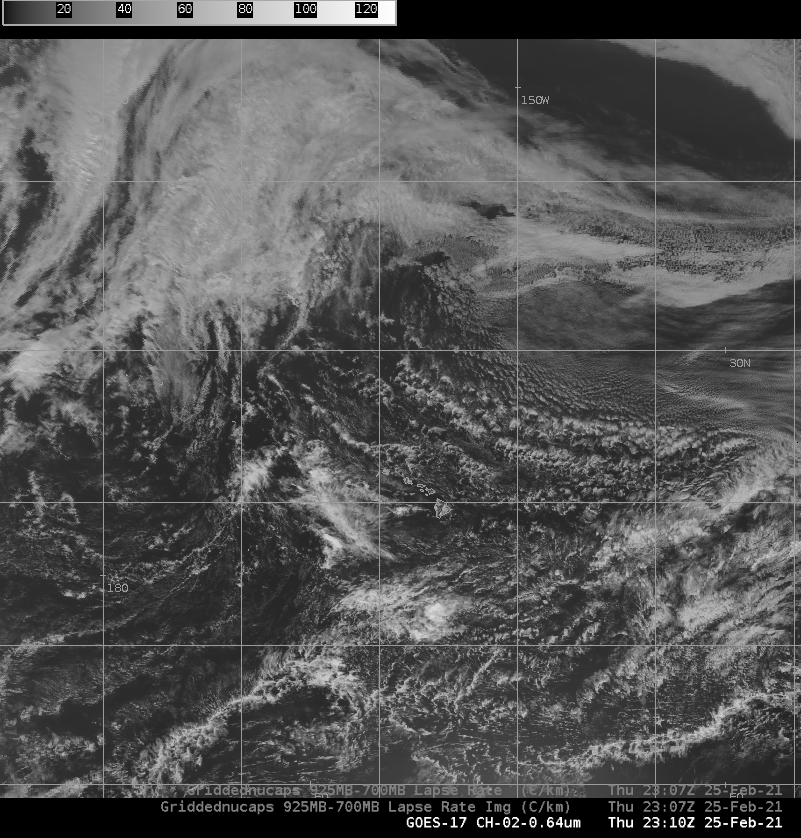
1-minute Mesoscale Domain Sector GOES-17 (GOES-West) “Clean” Infrared Window (10.35 µm) images (above) showed thunderstorms associated with the South Pacific Convergence Zone (SPCZ) on 21 February 2021. The 3 METAR stations plotted on the imagery are, from left to right, Hihifo Airport, Wallis and Fotuna (NLWW), Apia, Samoa (NSFA) and Pago Pago, American Samoa (NSTU).In spite... Read More
![GOES-17 Infrared images [click to play animation | MP4]](https://cimss.ssec.wisc.edu/satellite-blog/images/2021/02/as_ir-20210221_190025.png)
GOES-17 “Clean” Infrared Window (10.35 µm) images [click to play animation | MP4]
1-minute
Mesoscale Domain Sector GOES-17
(GOES-West) “Clean” Infrared Window (
10.35 µm) images
(above) showed thunderstorms associated with the
South Pacific Convergence Zone (SPCZ) on 21 February 2021. The 3 METAR stations plotted on the imagery are, from left to right, Hihifo Airport, Wallis and Fotuna (NLWW), Apia, Samoa (NSFA) and Pago Pago, American Samoa (NSTU).
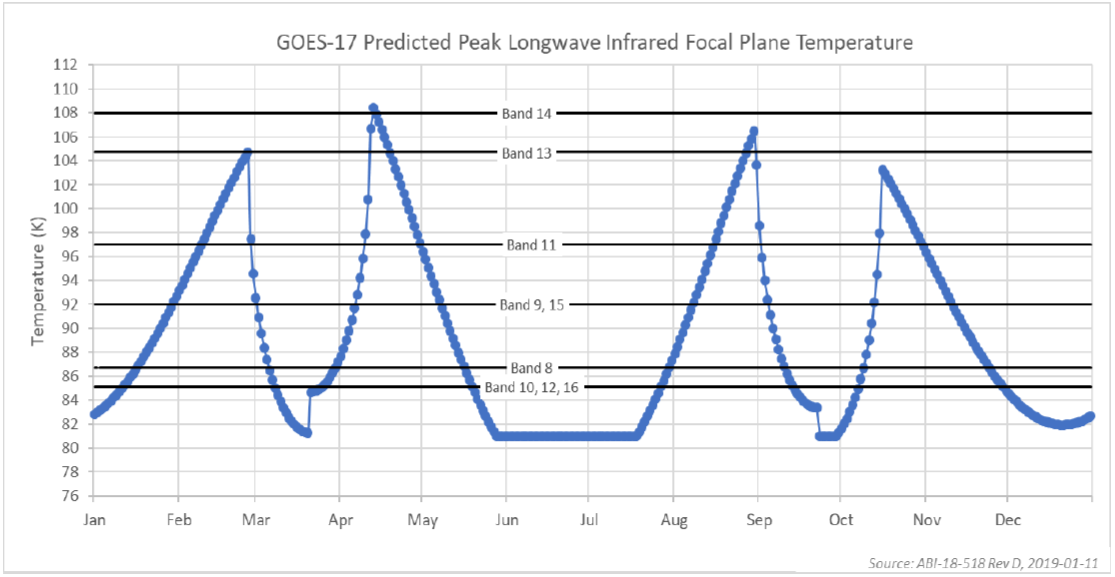
In spite of their degraded quality due to GOES-17 ABI Loop Heat Pipe thermal issues (which reaches one of its peaks at the end February), the Infrared images were still helpful in confirming that the primary SPCZ axis was remaining just north of the Samoan islands — and since the NWS Pago Pago office lacks radar coverage, they highlighted the importance of satellite imagery in one of their forecast discussions:
The active South Pacific Convergence zone (SPCZ) is lingering over the Samoan
island chain, as seen on latest GOES-17 mesoscale this afternoon.
We have a very difficult time with confirming the wind forecast by model data,
as there are no observations available of the persistent convection brewing
just off-shore the islands. However, the models coupled with satellite are
our only tools.
===== 22 February Update =====
GOES-17 “Clean” Infrared Window (10.35 µm) images [click to play animation | MP4]
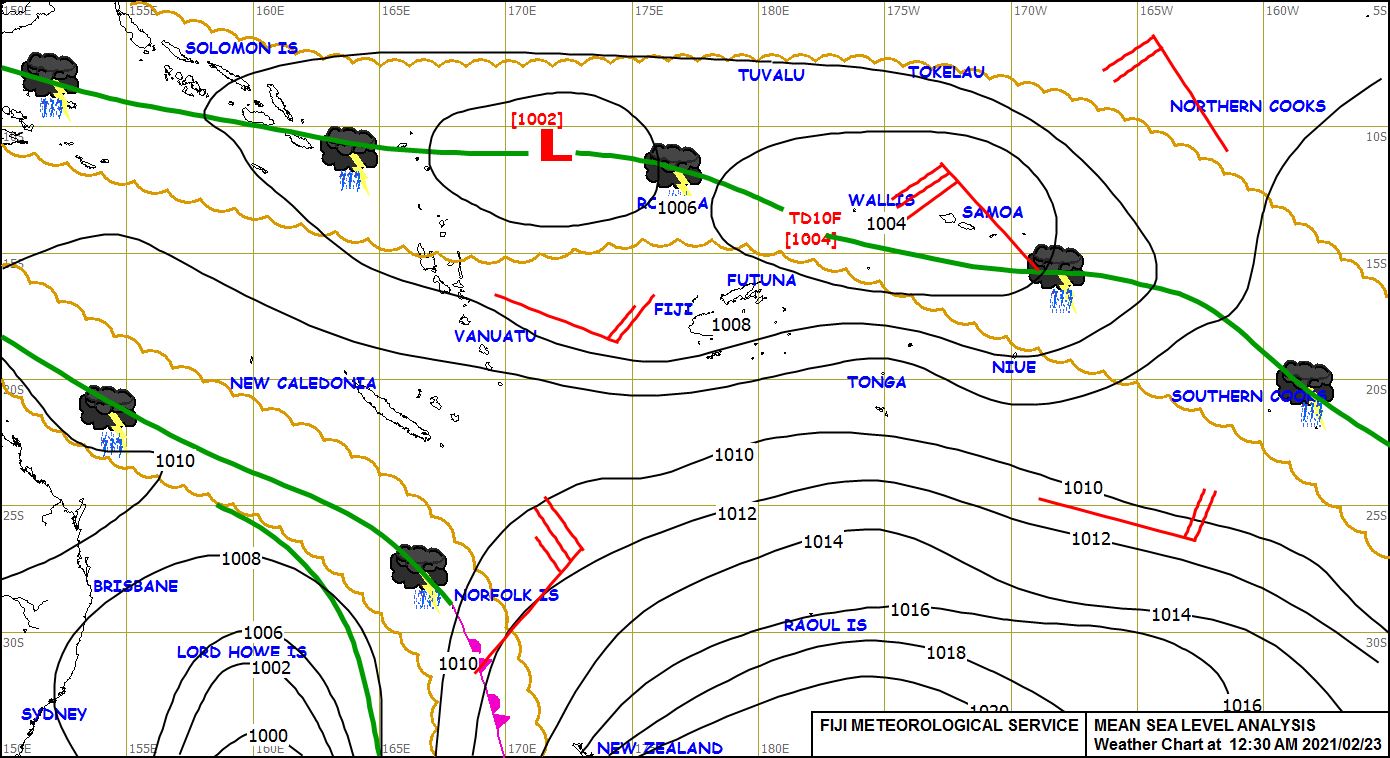
The
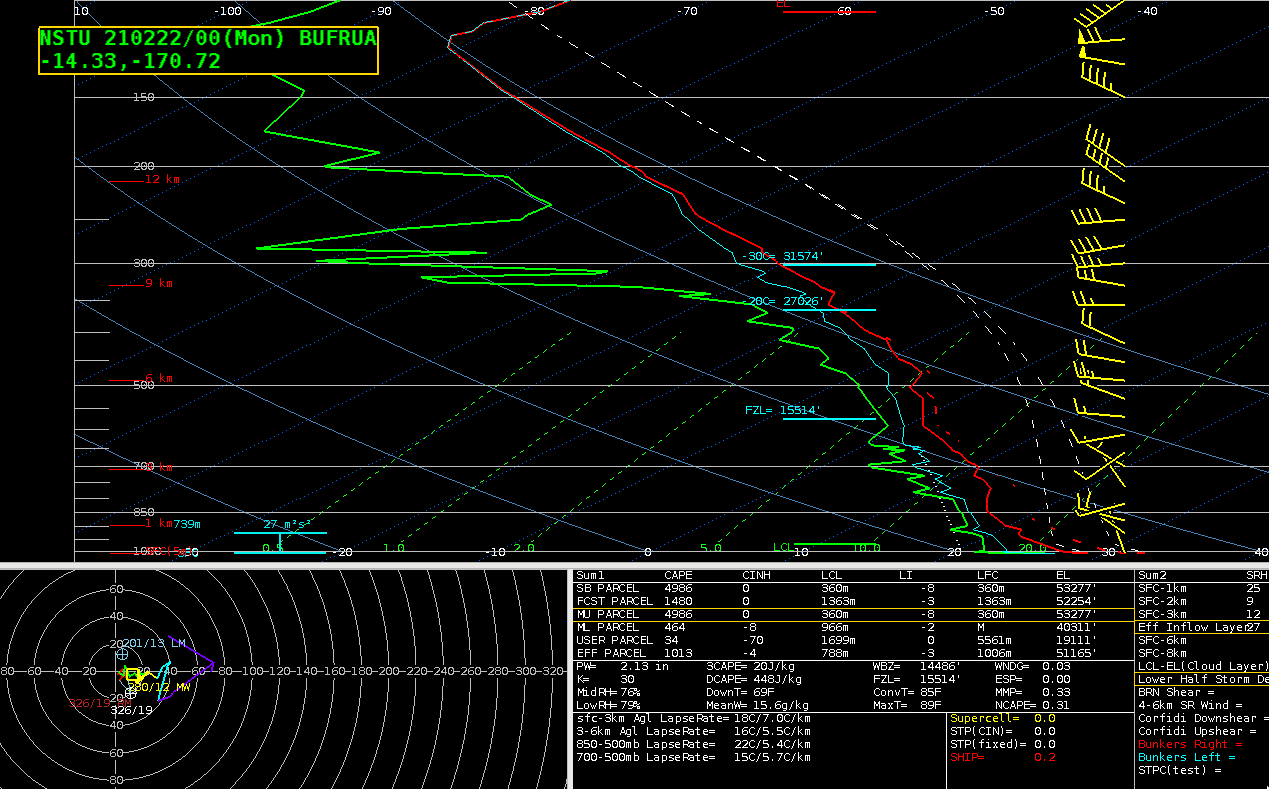
Fiji Meteorological Service determined that Tropical Depression 10F formed along the SPCZ around 00 UTC on 22 February (
surface analysis). Shortly after that time, a convective burst developed just east of the disturbance center, which exhibited cloud-top infrared brightness temperatures as cold as -94.3ºC — which indicated a significant overshoot of the Equilibrium Level as analyzed on
00 UTC rawinsonde data from Pago Pago, American Samoa.
![GOES-17 Infrared images, with plots of upper-level satellite winds and contours of upper-level convergence [click to enlarge]](https://cimss.ssec.wisc.edu/satellite-blog/images/2021/02/210222_1530utc_infrared_winds_divergence_Invest94P_anim.gif)
GOES-17 Infrared images, with plots of upper-level satellite winds and contours of upper-level convergence [click to enlarge]
GOES-17 Infrared images with plots of upper-level satellite winds and contours of upper-level convergence
(above) and plots of low-level satellite winds and contours of low-level convergence
(below) from the
CIMSS Tropical Cyclones site showed that the deep convection developing within the SPCZ was sustained by an environment of favorable kinematic fields. Tropical Depression 10F was also located within a narrow ribbon of relatively low
deep-layer wind shear.
![GOES-17 Infrared images, with plots of low-level satellite winds and contours of low-level convergence [click to enlarge]](https://cimss.ssec.wisc.edu/satellite-blog/images/2021/02/210222_1530utc_infrared_winds_convergence_Invest94P_anim.gif)
GOES-17 Infrared images, with plots of low-level satellite winds and contours of low-level convergence [click to enlarge]
The
MIMIC TPW product
(below) highlighted the rich tropical moisture within the NW-SE oriented SPCZ.
![MIMIC TPW product [click to enlarge]](https://cimss.ssec.wisc.edu/satellite-blog/images/2021/02/210222_mimicTPW_Invest94P_anim.gif)
MIMIC TPW product [click to enlarge]
A closer look at the MIMC TPW product over the Samoan islands at 16 UTC on 22 February is shown below. With such high tropical moisture in place across the region, thunderstorms were producing heavy rainfall and/or wind damage in some of the islands (
local storm reports).
MIMC TPW product over the Samoan islands at 16 UTC [click to enlarge]
===== 23 February Update =====
![GOES-17 "Red" Visible (0.64 µm) images [click to play animation | MP4]](https://cimss.ssec.wisc.edu/satellite-blog/images/2021/02/as3_vis-20210223_235949.png)
GOES-17 “Red” Visible (0.64 µm) images [click to play animation | MP4]
GOES-17 “Red” Visible (
0.64 µm) images
(above) showed that as deep convection began to diminish, the low-level circulation center of TD 10F slowly became more exposed as the tropical disturbance weakened — prompting the Fiji Meteorological Service to discontinue classifying feature as a tropical depression as of 2100 UTC on 23 February
(below).
![Surface analyses at 18 UTC and 21 UTC on 23 February (map time stamps are Fiji local time) [click to enlarge]](https://cimss.ssec.wisc.edu/satellite-blog/images/2021/02/210223_18utc_21utc_TD10F_surface_analysis_anim.gif)
Surface analyses at 1800 UTC and 2100 UTC on 23 February (map time stamps are Fiji local time) [click to enlarge]
View only this post
Read Less
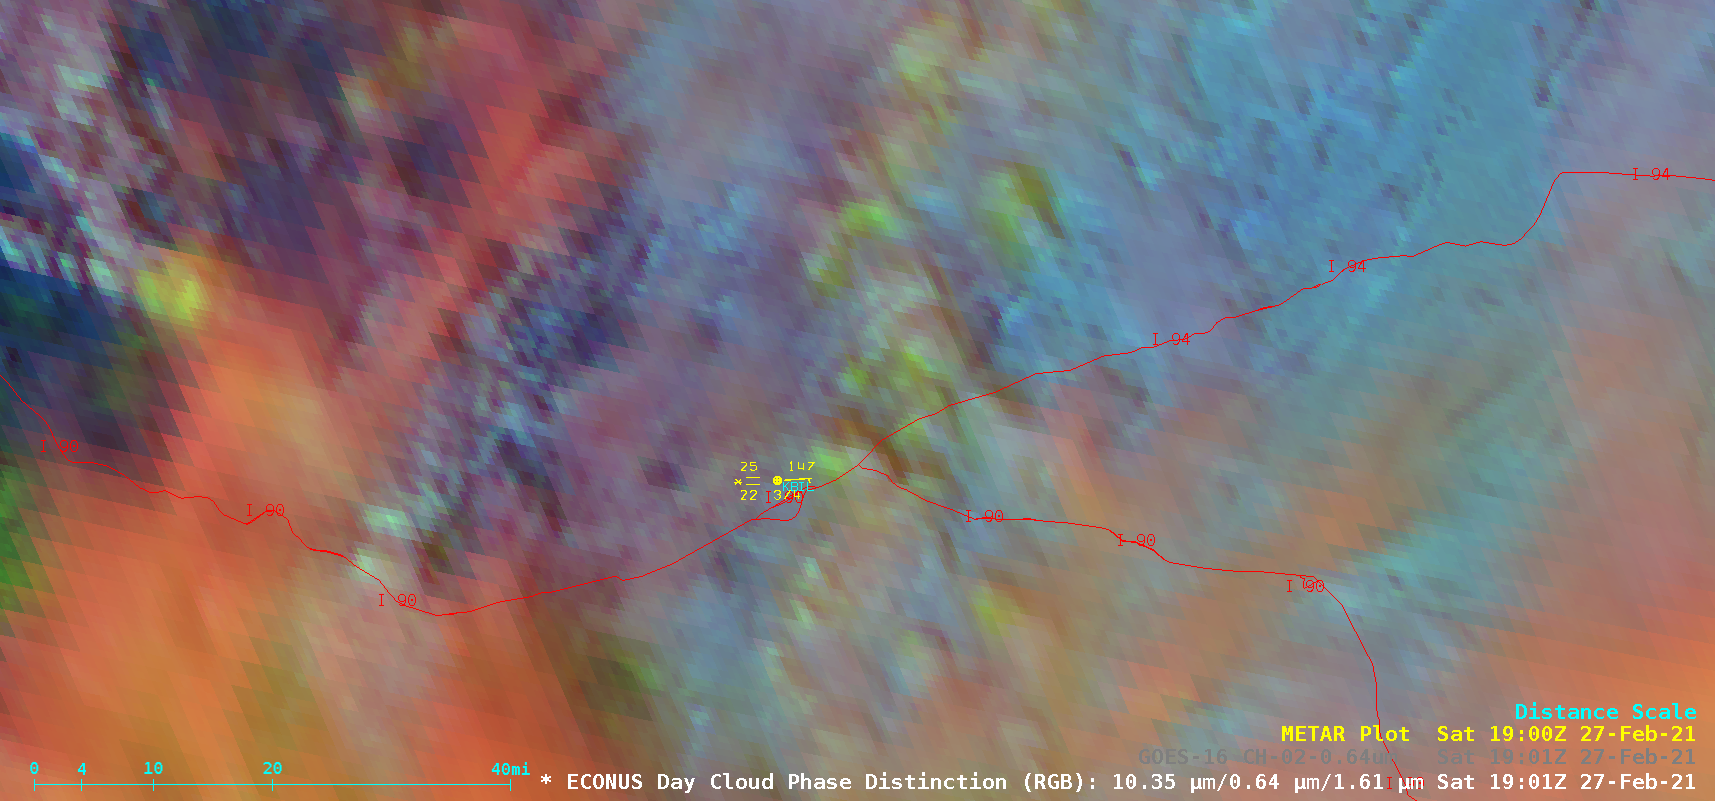
![GOES-16 “Red” Visible (0.64 µm) and Day Cloud Phase Distinction RGB images [click to play animation | MP4]](https://cimss.ssec.wisc.edu/satellite-blog/images/2021/02/210227_goes16_visible_dayCloudPhaseDistinctionRGB_MT_anim.gif)
![1901 UTC Day Cloud Phase Distinction RGB images from GOES-16 and GOES-17 [click to enlarge]](https://cimss.ssec.wisc.edu/satellite-blog/images/2021/02/210227_goes16_goes17_cloudPhaseDistinctionRGB_MT_anim.gif)


![GOES-17 Infrared images [click to play animation | MP4]](https://cimss.ssec.wisc.edu/satellite-blog/images/2021/02/210221_goes17_infrared_Invest94P_American_Samoa_anim.gif)

![GOES-17 "Red" Visible (0.64 µm) images [click to play animation | MP4]](https://cimss.ssec.wisc.edu/satellite-blog/images/2021/02/210223_goes17_visible_Invest94P_American_Samoa_anim.gif)
