As an anomalously-deep middle-tropospheric low migrated eastward over the Southwest US, severe thunderstorms developed ahead of a surface low and its associated cold front (surface analyses) as they moved from New Mexico into Texas on 13 March 2021 — as shown in 1-minute Mesoscale Domain Sector GOES-16 (GOES-East) “Red” Visible (0.64 µm) (above) and “Clean” Infrared Window (10.35 um) images (below). According... Read More
![GOES-16 “Red” Visible (0.64 µm) images, with time-matched SPC Storm Reports plotted in red [click to play animation | MP4]](https://cimss.ssec.wisc.edu/satellite-blog/images/2021/03/G16_VIS_TX_SVR_13MAR2021_B2_2021072_205521_GOES-16_0001PANEL_FRAME0000176.GIF)
GOES-16 “Red” Visible (0.64 µm) images, with time-matched SPC Storm Reports plotted in red [click to play animation | MP4]
As an
anomalously-deep middle-tropospheric low migrated eastward over the Southwest US, severe thunderstorms developed ahead of a surface low and its associated cold front (
surface analyses) as they moved from New Mexico into Texas on
13 March 2021 — as shown in 1-minute
Mesoscale Domain Sector GOES-16
(GOES-East) “Red” Visible (
0.64 µm)
(above) and “Clean” Infrared Window (
10.35 um) images
(below). According to
SPC Storm Reports, over a dozen tornadoes occurred (maximum intensity EF2), with hail as large as 2.5 inches in diameter and wind gusts as high as 87 mph.
![GOES-16 “Clean” Infrared Window (10.35 µm) images, with time-matched SPC Storm Reports plotted in cyan [click to play animation | MP4]](https://cimss.ssec.wisc.edu/satellite-blog/images/2021/03/G16_IR_TX_SVR_13MAR2021_B13_2021072_205521_GOES-16_0001PANEL_FRAME0000176.GIF)
GOES-16 “Clean” Infrared Window (10.35 µm) images, with time-matched SPC Storm Reports plotted in cyan [click to play animation | MP4]
![GOES-16 True Color RGB images [click to pay animation | MP4]](https://cimss.ssec.wisc.edu/satellite-blog/images/2021/03/GOES-16_ABI_RadC_true_color_2021072_230113Z.png)
GOES-16 True Color RGB images [click to pay animation | MP4]
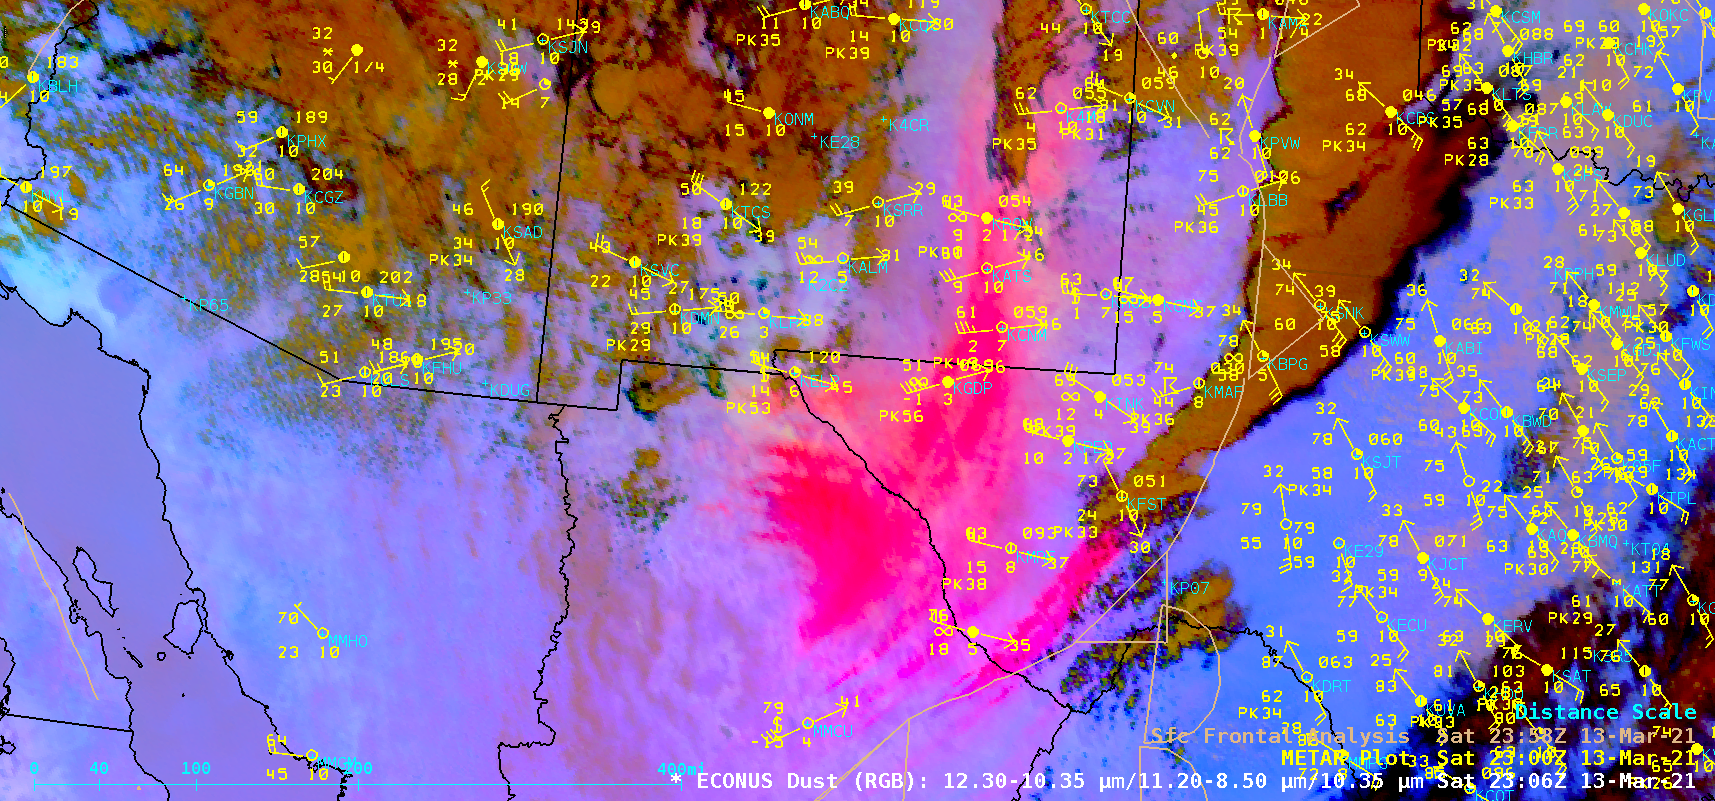
South of the surface low, strong winds over the mountains of northern Mexico generated a significant amount of blowing dust (from deserts and dry lake beds), as seen in GOES-16 True Color RGB images created using
Geo2Grid (above). This dust was then transported northeastward and eastward over parts of New Mexico and Texas, reducing the surface visibility at several sites. A pronounced dust signature
(brighter shades of magenta) was also evident on GOES-16
Dust RGB images
(below).
![GOES-16 Dust RGB images [click to play animation | MP4]](https://cimss.ssec.wisc.edu/satellite-blog/images/2021/03/mex_bldn-20210313_230613.png)
GOES-16 Dust RGB images [click to play animation | MP4]
===== 14 March Update =====
![GOES-16 True Color RGB images [click to play animation | MP4]](https://cimss.ssec.wisc.edu/satellite-blog/images/2021/03/GOES-16_ABI_RadC_true_color_2021073_234116Z.png)
GOES-16 True Color RGB images [click to play animation | MP4]
Strong winds along the southern periphery of an intensifying winter storm over the central Rocky Mountains continued on
14 March — and GOES-16 True Color RGB images
(above) showed another broad plume of blowing dust (along with a few narrow, brighter white smoke plumes from wildfires) that developed across northern Mexico, far southern New Mexico and western/southwestern Texas, which then moved northeastward during the day.
===== 15 March Update =====
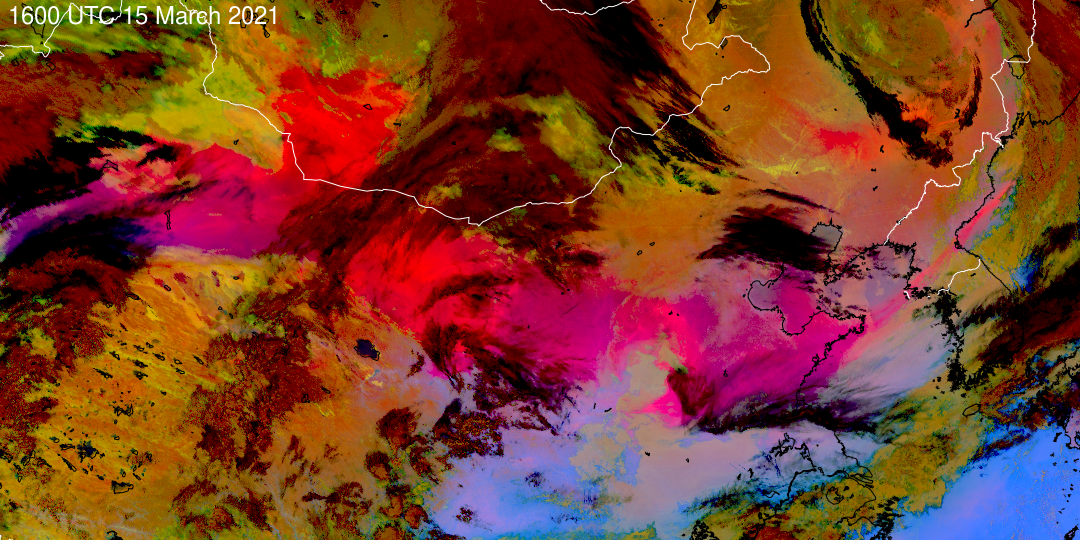
![GOES-16 Dust RGB images [click to play animation | MP4]](https://cimss.ssec.wisc.edu/satellite-blog/images/2021/03/GOES-16_ABI_RadC_dust_2021073_210116Z.png)
GOES-16 Dust RGB images [click to play animation | MP4]
GOES-16
Dust RGB images
(above) indicated that a plume of dense airborne dust
(brighter shades of magenta) which was initially transported northeastward across Texas on 14 March continued to move across Oklahoma during the subsequent overnight hours — where it appears to have merged with a patch of thickening clouds. These clouds continued to proceed northward across eastern Kansas and eventually passed over southeastern Nebraska and far northwestern Missouri, where there were reports of muddy residue from precipitation that had fallen upon vehicles:
This dust transport path was supported by
HYSPLIT forward trajectories, initialized from a point centered on the dust plume in Texas
(below).

HYSPLIT forward trajectories [click to enlarge]
In addition to the severe thunderstorms and strong winds / blowing dust discussed above, this complex and slow-moving system produced heavy snow in several states (
WPC Storm Summary) — and a 2-day animation of GOES-16 Mid-level Water Vapor (
6.9 µm) images covering the 13-15 March period
(below) showed its large circulation.
![GOES-16 Mid-level Water Vapor (6.9 µm) images, with plots of surface weather type [click to play animation | MP4]](https://cimss.ssec.wisc.edu/satellite-blog/images/2021/03/G16_WV_WXS_CENTRAL_US_13_15MAR2021_B9_2021073_104113_GOES-16_0001PANEL_FRAME0000309.GIF)
GOES-16 Mid-level Water Vapor (6.9 µm) images, with plots of surface weather type [click to play animation | MP4]
View only this post
Read Less

![GOES-16 “Red” Visible (0.64 µm) images, with time-matched SPC Storm Reports plotted in red [click to play animation | MP4]](https://cimss.ssec.wisc.edu/satellite-blog/images/2021/03/210313_goes16_visible_spcStormReports_NM_TX_OK_anim.gif)
![GOES-16 “Clean” Infrared Window (10.35 µm) images, with time-matched SPC Storm Reports plotted in cyan [click to play animation | MP4]](https://cimss.ssec.wisc.edu/satellite-blog/images/2021/03/210313_goes16_infrared_spcStormReports_NM_TX_OK_anim.gif)
![GOES-16 True Color RGB images [click to pay animation | MP4]](https://cimss.ssec.wisc.edu/satellite-blog/images/2021/03/210313_goes16_trueColorRGB_Mexico_blowing_dust_anim.gif)
![GOES-16 Dust RGB images [click to play animation | MP4]](https://cimss.ssec.wisc.edu/satellite-blog/images/2021/03/210313_goes16_dustRGB_Mexico_blowing_dust_anim.gif)
![GOES-16 True Color RGB images [click to play animation | MP4]](https://cimss.ssec.wisc.edu/satellite-blog/images/2021/03/210314_goes16_trueColorRGB_TX_blowing_dust_anim.gif)
![GOES-16 Dust RGB images [click to play animation | MP4]](https://cimss.ssec.wisc.edu/satellite-blog/images/2021/03/210314_210315_goes16_dustRGB_anim.gif)
![GOES-16 Mid-level Water Vapor (6.9 µm) images, with plots of surface weather type [click to play animation | MP4]](https://cimss.ssec.wisc.edu/satellite-blog/images/2021/03/210313_210315_goes16_waterVapor_surfaceWeatherType_anim.gif)

