GOES-16 (GOES-East) Air Mass RGB images (above) showed the darker shades of red associated with dry and ozone-rich air within a lowered tropopause near the core of an upper-level low moving eastward across Oklahoma on 17 March 2021. One sequence of the Air Mass RGB images includes RAP40 model pressure contours of the PV1.5... Read More
![GOES-16 Air Mass RGB images, with and without contours of PV1.5 pressure [click to play animation | MP4]](https://cimss.ssec.wisc.edu/satellite-blog/images/2021/03/svr_rgb_pv-20210317_210117.png)
GOES-16 Air Mass RGB images, with and without contours of RAP40 model PV1.5 pressure [click to play animation | MP4]
GOES-16
(GOES-East) Air Mass RGB images
(above) showed the darker shades of red associated with dry and ozone-rich air within a lowered tropopause near the core of an upper-level low moving eastward across Oklahoma on
17 March 2021. One sequence of the Air Mass RGB images includes RAP40 model pressure contours of the PV1.5 surface (a representation of the “dynamic tropopause”), which descended to the 700 hPa pressure level — and as this Potential Vorticity (PV) anomaly propagated east toward the Lower Mississippi Valley, it helped to enhance large-scale forcing for ascent and upper-level diffluence across that region. As noted in
this blog post, that morning the
SPC had issued a High Risk for severe thunderstorms across parts of the Deep South.
![GOES-16 “Red” Visible (0.64 µm) images, with time-matched SPC Storm Reports plotted in red [click to play animation | MP4]](https://cimss.ssec.wisc.edu/satellite-blog/images/2021/03/G16_VIS_1MIN_MS_AL_SVR_17MAR2021_B2_2021076_190055_GOES-16_0001PANEL_FRAME0000151.GIF)
GOES-16 “Red” Visible (0.64 µm) images, with time-matched SPC Storm Reports plotted in red [click to play animation | MP4]
1-minute
Mesoscale Domain Sector GOES-16 “Red” Visible (
0.64 µm) images
(above) and “Clean” Infrared Window (
10.35 µm) images
(below) include time-matched plots of
SPC Storm Reports that were produced by a number of supercell thunderstorms that developed and moved across across Mississippi and Alabama (where the concentration of tornadoes was highest).
![GOES-16 “Clean” Infrared Window (10.35 µm) images, with time-matched SPC Storm Reports plotted in cyan [click to play animation | MP4]](https://cimss.ssec.wisc.edu/satellite-blog/images/2021/03/G16_IR_1MIN_MS_AL_SVR_17MAR2021_B13_2021076_190055_GOES-16_0001PANEL_FRAME0000151.GIF)
GOES-16 “Clean” Infrared Window (10.35 µm) images, with time-matched SPC Storm Reports plotted in cyan [click to play animation | MP4]
In a t
ime-matched comparison of Infrared images from Suomi NPP (overpass times) and GOES-16
(below), the coldest overshooting top infrared brightness temperatures sensed by the VIIRS instrument on Suomi NPP were about 5-7ºC colder than those from GOES. Note the small northwestward parallax displacement that is inherent with GOES-16 imagery over that region. The same color enhancement is applied to both images.
![GOES-16 “Clean” Infrared Window (10.35 µm) and Suomi NPP VIIRS Infrared Window (11.45 µm) images at 1921 UTC [click to enlarge]](https://cimss.ssec.wisc.edu/satellite-blog/images/2021/03/210317_1921utc_suomiNPP_goes16_infrared_MS_AL_anim.gif)
GOES-16 “Clean” Infrared Window (10.35 µm) and Suomi NPP VIIRS Infrared Window (11.45 µm) images at 1921 UTC [click to enlarge]
With a partial overlap of the 2 GOES-16 Mesoscale Domain Sectors, imagery was available at 30-second intervals in the vicinity of the Mississippi/Alabama border; Visible images with time-matched plots of SPC Storm Reports are shown below.
![GOES-16 “Red” Visible (0.64 µm) images, with time-matched SPC Storm Reports plotted in red [click to play animation | MP4]](https://cimss.ssec.wisc.edu/satellite-blog/images/2021/03/G16_VIS_MS_AL_SVR_17MAR2021_B2_2021076_190028_GOES-16_0001PANEL_FRAME0000203.GIF)
GOES-16 “Red” Visible (0.64 µm) images, with time-matched SPC Storm Reports plotted in red [click to play animation | MP4]
On a side note, strong winds along the rear flank of the surface low in Oklahoma lofted plumes of blowing dust across western Texas — a time-matched comparison of GOES-16
Dust RGB and Suomi NPP VIIRS True Color RGB images at 1921 UTC
(below) highlighted the blowing dust features. Animations of GOES-16 Dust RGB images can be seen here:
GIF |
MP4.
![GOES-16 Dust RGB and Suomi NPP VIIRS True Color RGB images at 1921 UTC [click to enlarge]](https://cimss.ssec.wisc.edu/satellite-blog/images/2021/03/210317_1921utc_goes16_dustRGB_suomiNPP_viirs_trueColorRGB_TX_anim.gif)
GOES-16 Dust RGB and Suomi NPP VIIRS True Color RGB images at 1921 UTC [click to enlarge]
View only this post
Read Less
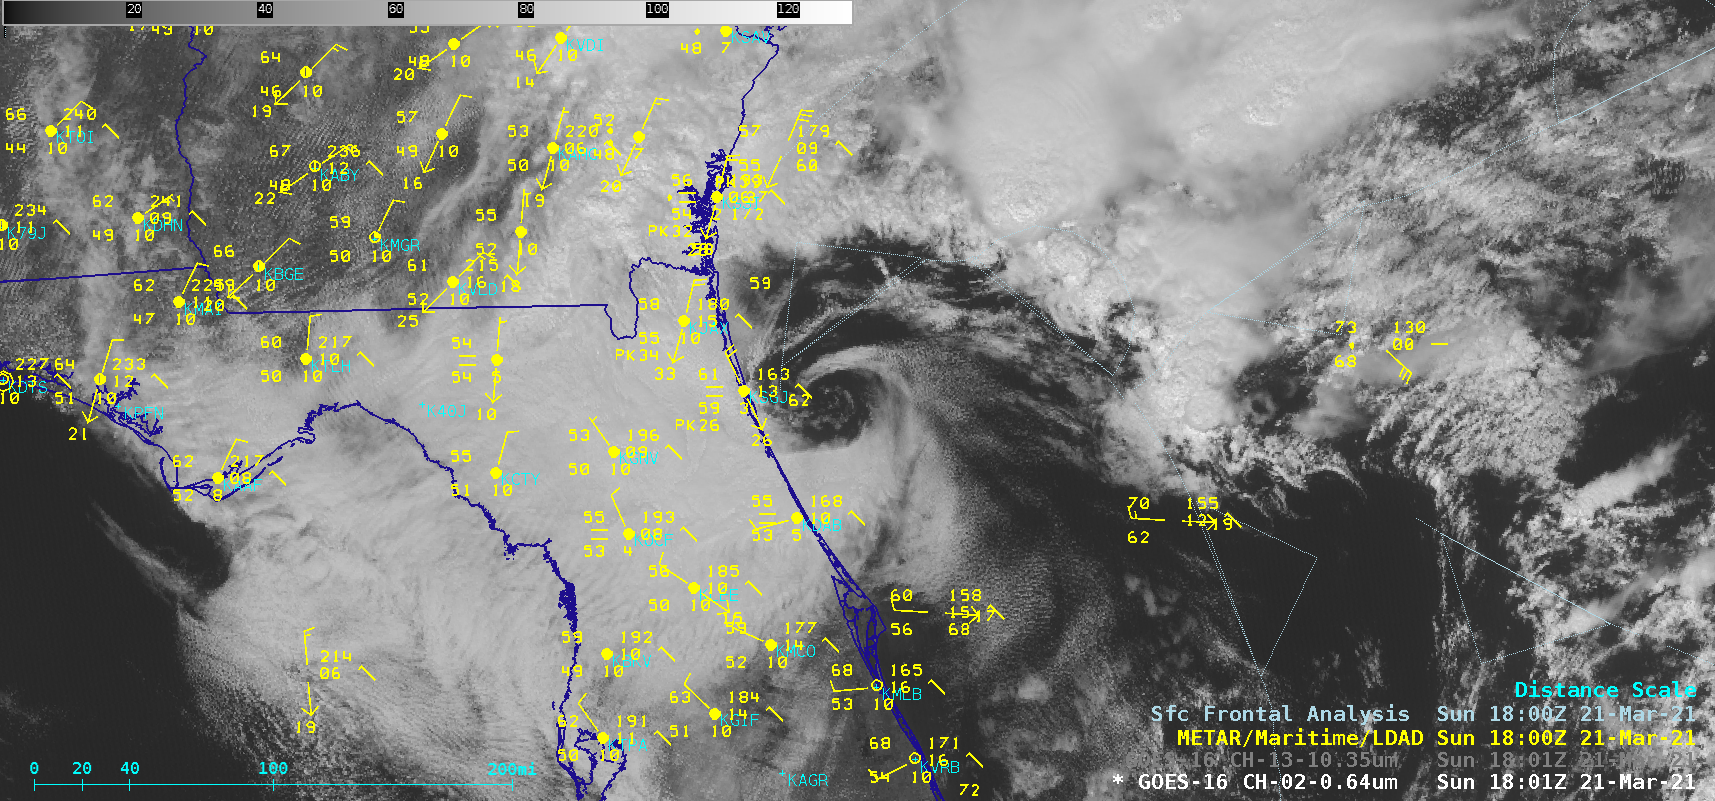

![GOES-16 “Red” Visible (0.64 µm) and "Clean" Infrared Window (10.35 µm) images [click to play animation | MP4]](https://cimss.ssec.wisc.edu/satellite-blog/images/2021/03/210321_goes16_visible_infrared_FL_anim.gif)
![GOES-16 Visible, Near-Infrared and Shortwave Infrared images [click to play animation | MP4]](https://cimss.ssec.wisc.edu/satellite-blog/images/2021/03/210318_goes16_visible_nearInfrared_shortwaveInfrared_SLS_test_MS_anim.gif)
![GOES-17 Visible, Near-Infrared and Shortwave Infrared images [click to play animation | MP4]](https://cimss.ssec.wisc.edu/satellite-blog/images/2021/03/210318_goes17_visible_nearInfrared_shortwaveInfrared_SLS_test_MS_anim.gif)
![GOES-16 Air Mass RGB images, with and without contours of PV1.5 pressure [click to play animation | MP4]](https://cimss.ssec.wisc.edu/satellite-blog/images/2021/03/210317_goes16_airMassRGB_pv1.5pressure_southern_US_anim.gif)
![GOES-16 “Red” Visible (0.64 µm) images, with time-matched SPC Storm Reports plotted in red [click to play animation | MP4]](https://cimss.ssec.wisc.edu/satellite-blog/images/2021/03/210317_goes16_1minute_visible_spcStormReports_MS_AL_anim.gif)
![GOES-16 “Clean” Infrared Window (10.35 µm) images, with time-matched SPC Storm Reports plotted in cyan [click to play animation | MP4]](https://cimss.ssec.wisc.edu/satellite-blog/images/2021/03/210317_goes16_1minute_infrared_spcStormReports_MS_AL_anim.gif)
![GOES-16 “Red” Visible (0.64 µm) images, with time-matched SPC Storm Reports plotted in red [click to play animation | MP4]](https://cimss.ssec.wisc.edu/satellite-blog/images/2021/03/210317_goes16_30second_visible_spcStormReports_MS_AL_anim.gif)
