
Himawari-8 Band 13 Clean Window infrared imagery (10.41 µm) from 2300 UTC on 1 April through 1100 UTC 2 April (Click to enlarge)
The animation above shows Himawari full-disk imagery from 2300 UTC on 1 April through 1140 UTC on 2 April and depicts a cluster of thunderstorms over the Pacific Ocean far to the northeast of Guam. A particular challenge in diagnosing atmospheric events over the open Pacific is the lack of data. In this case, a timely NOAA-20 overpass (around 0300 UTC), below, allowed for the use of NOAA-Unique Combined Atmospheric Processing System (NUCAPS) profiles to describe the atmosphere in and around this ongoing convection.

NOAA-20 NUCAPS Sounding Availability points, 0300 UTC on 2 April 2020 (click to enlarge)
The toggles below shows Total totals index and Tropopause heights over the Pacific Ocean around Guam and northeastward over the developing convection. Modest instability surrounds the convective cluster (TT values from 40-44); somewhat more unstable air (TT > 46) is diagnosed to the northwest of the convection. Tropopause heights surrounding the convection are high, around 200 mb. Much lower tropopause heights are diagnosed over the northern part of the domain, and the more unstable TT values are in a region where the tropopause height is sloping.

HImawari-8 Clean Window infrared imagery (10.41 µm) overlain with NUCAPS-derived Total Totals indices (with and without labels) at 0312 UTC on 2 April 2021 (click to enlarge)
Himawari-8 Clean Window infrared imagery (10.41 µm) overlain with NUCAPS-derived estimates of tropopause heights, 0312 UTC on 2 April 2021 (Click to enlarge)
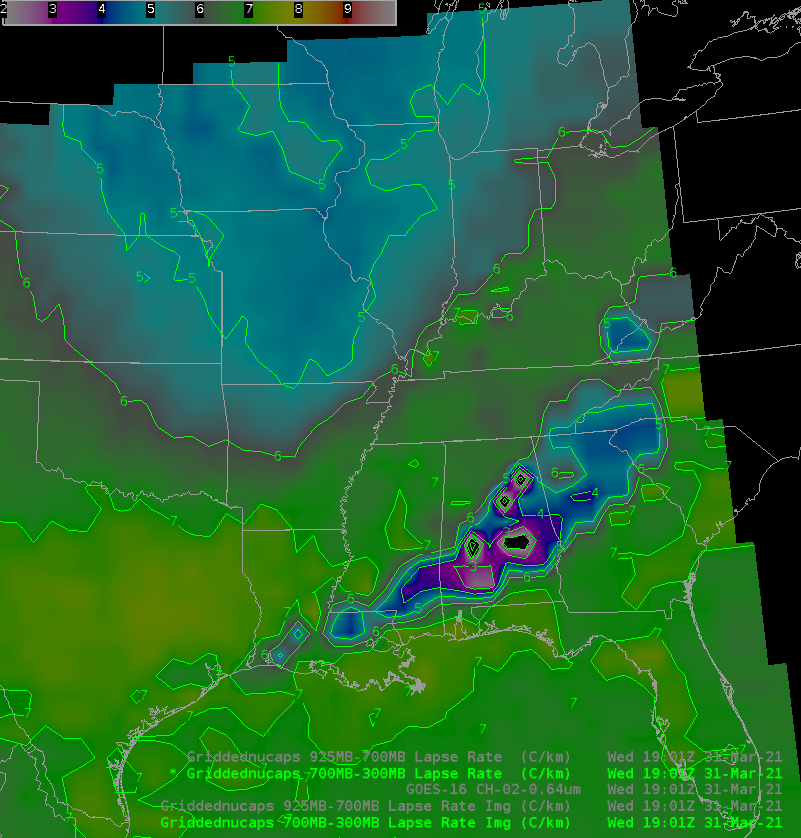
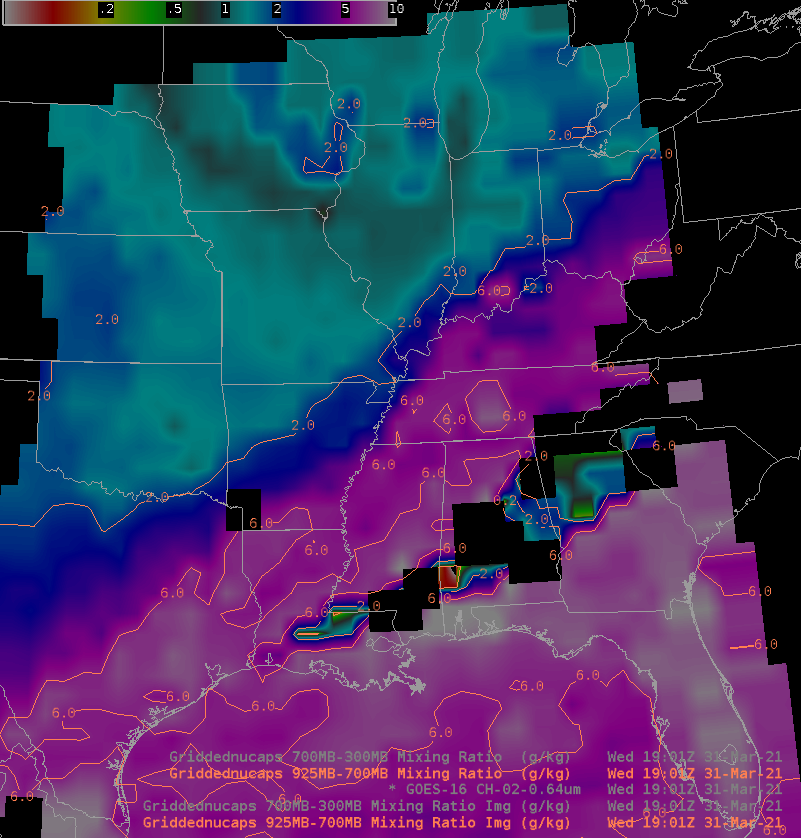
Himawari-8 infrared (Clean Window, 10.41 µm) imagery and NUCAPS-derived lapse rates, 925-700 mb, 0312 UTC on 2 April 2021
NUCAPS can also show you lapse rates within the atmosphere. It is important when viewing lapse rates to consider that the vertical resolution of NUCAPS profiles is typically not greater than 10 layers within the tropopause. The toggle above shows lapse rates from 925-700 mb; lapse rates from 850-500 mb are shown below. These domains are is a bit larger than the domain used in showing the tropopause height and Total Totals index above. The 925-700 mb lapse rates show two regions: relatively weak stability, with lapse rates around 5 or 6 C/km south of 30 N Latitude, and much stronger stability (Lapse rates closer to 3 C / km ) north of that latitude, to the east of Japan.
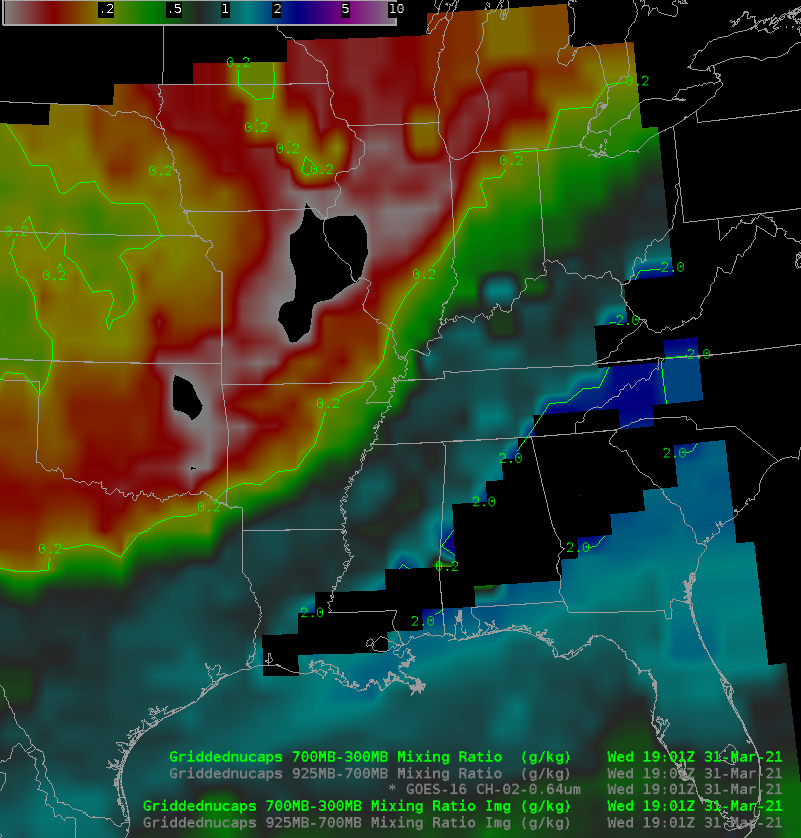
The 850-500 mb lapse rates similarly show two general regions: not as stable south of 30 N, much more stable east of Japan. There is a more concentrated region of lower stability, however, along the leading edge of the sloped tropopause, at 850-500 mb compared to 925-700 mb, and the 850-500 mb values show larger lapse rates in the air to the east of Japan. This toggle shows the 925-700 and 850-500 mb lapse rates directly.

Himawari-8 infrared (Clean Window, 10.41 µm) imagery and NUCAPS-derived lapse rates, 850-500 mb, 0312 UTC on 2 April 2021
This region of the Pacific Ocean is scanned by both the Advanced Himawari Imager (AHI) on JMA’s Himawari-8 satellite and the similar Advanced Meteorological Imager (AMI) on KMA’s GK2A satellite. The animation below combines visible imagery from the two satellites at 0100, 0110, 0230 and 0400 UTC to create a pseudostereocopic image of the convection.
Himawari-8 (left) and GK2A (right) visible imagery (0.64 µm) at 0100, 0110, 0230 and 0400 UTC 2 April (Click to enlarge)
Developing (and ongoing) thunderstorms are usually locations of turbulence. The CIMSS Turbulence product, shown below for the region from 0000 UTC to 0350 UTC, and available online here, does show elevated turbulence probabilities over the convection (located over the western part of the domain shown below).
Turbulence probability plotted on top of Himawari-8 grey-scale water vapor imagery, 0000 – 0350 UTC on 2 April 2021 (Click to enlarge)
Himawari-8 imagery in this blog post courtesy of JMA; GK2A imagery in the blog post courtesy of KMA. Thanks to Brandon Aydlett, WFO Guam, for alerting us to this interesting case.
View only this post Read Less
![GOES-16 Shortwave Infrared images, with hourly surface wind barbs (cyan) and gusts (in knots, red); Interstate 90 is plotted in red [click to play animation | MP4]](https://cimss.ssec.wisc.edu/satellite-blog/images/2021/03/210329_goes16_shortwaveInfrared_winds_SD_fires_anim.gif)
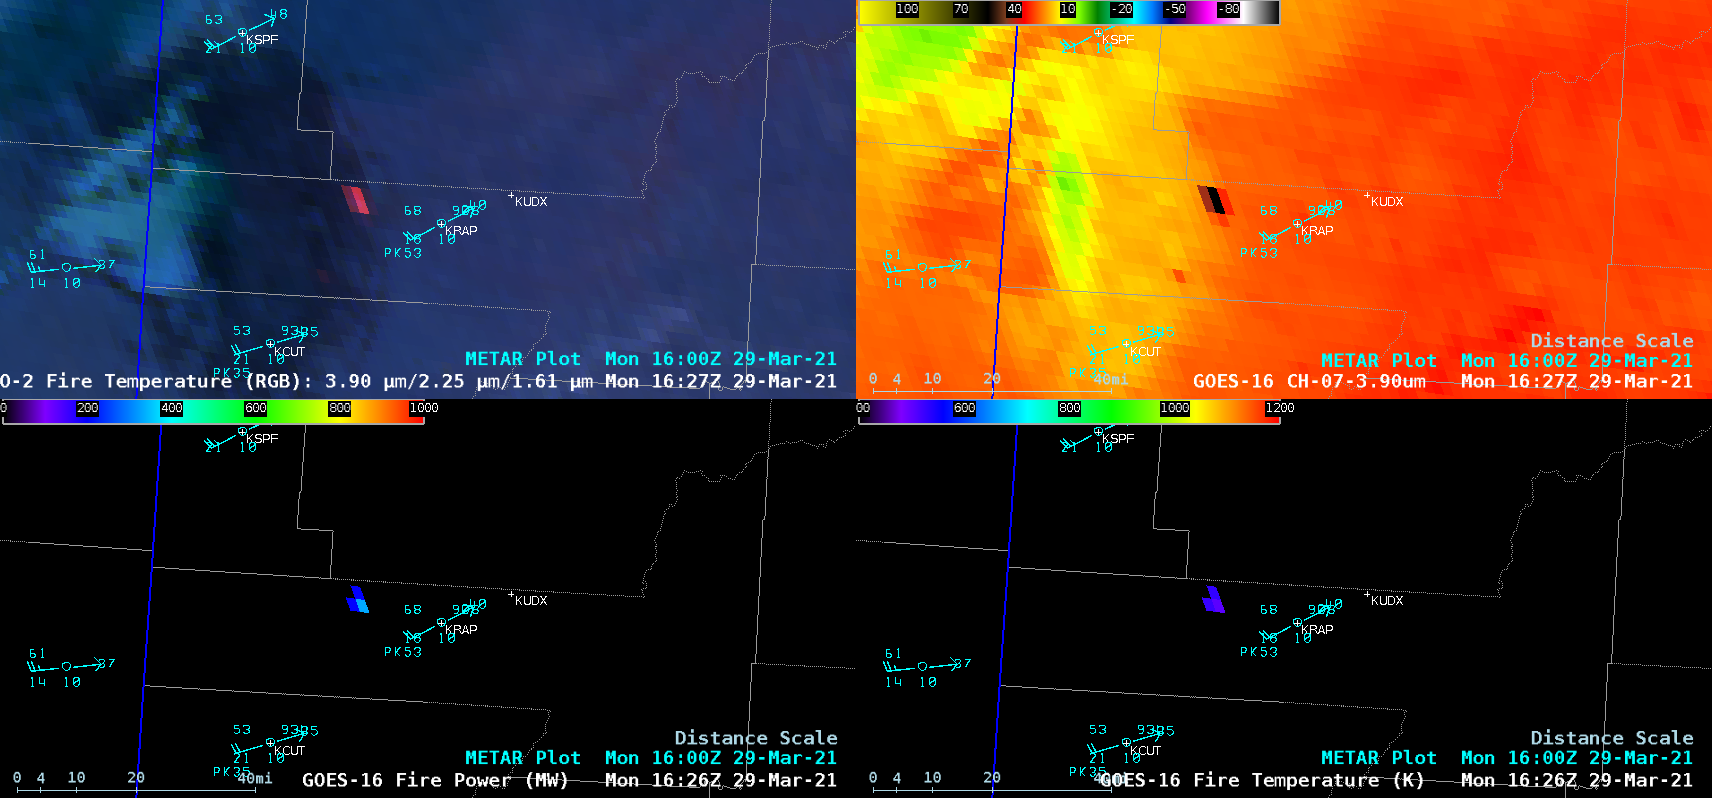
![GOES-16 Fire Temperature RGB (top left), Shortwave Infrared (top right), Fire Power (bottom left) and Fire Temperature (bottom right) [click to play animation | MP4]](https://cimss.ssec.wisc.edu/satellite-blog/images/2021/03/210329_goes16_4panel_Rapid_City_SD_fire_anim.gif)
