![GOES-16 Ash RGB images [click to play animation | MP4]](https://cimss.ssec.wisc.edu/satellite-blog/images/2021/04/wi_so2-20210409_141017.png)
GOES-16 Ash RGB and SO2 RGB images [click to play animation | MP4]
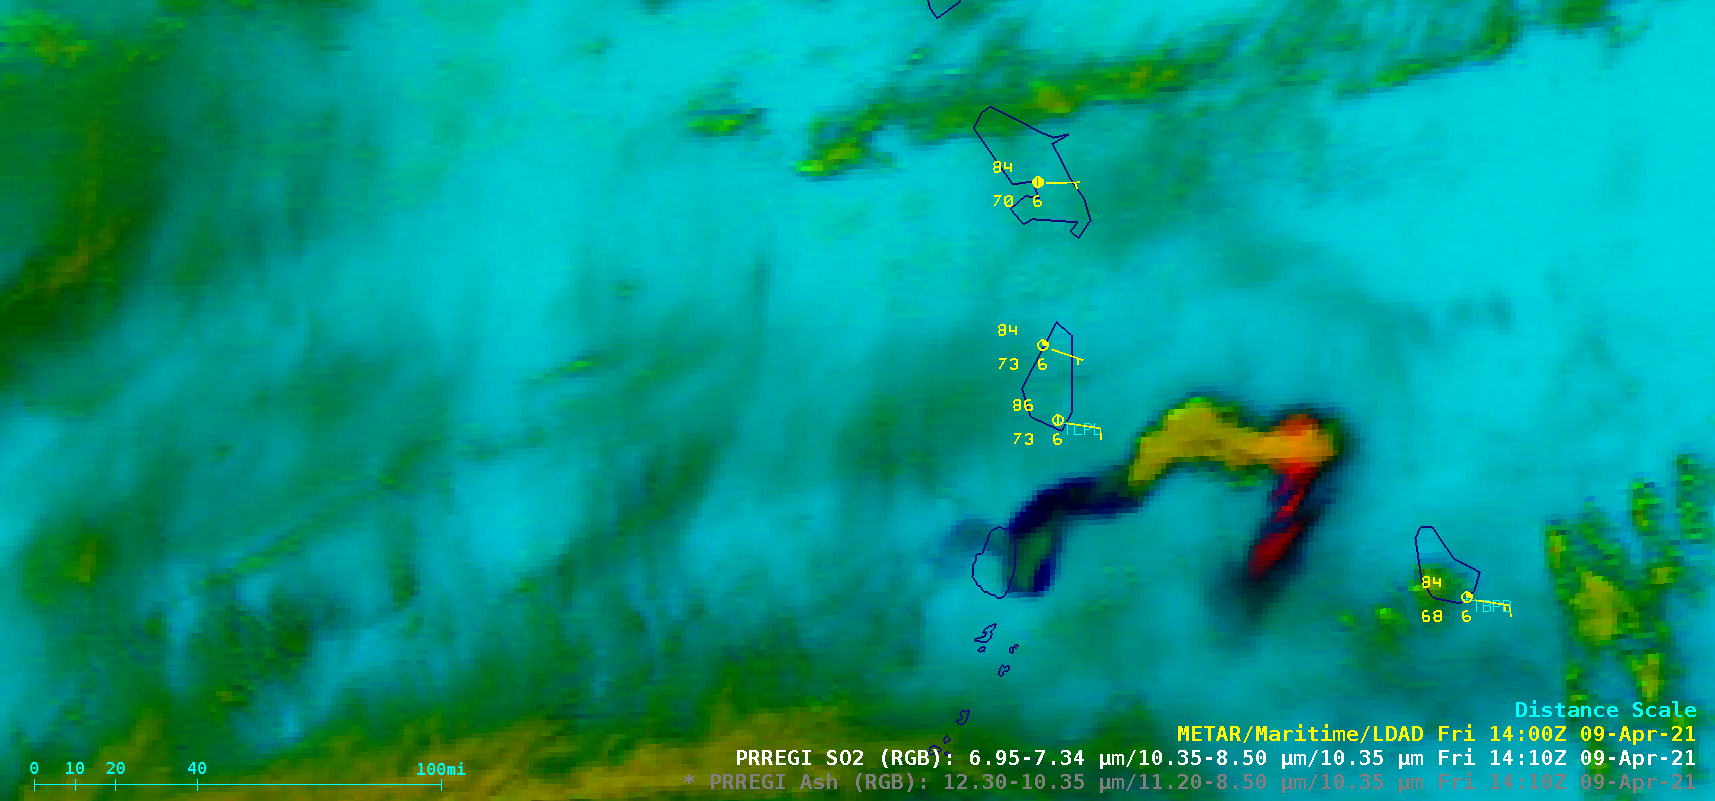
GOES-16
(GOES-East) Ash RGB and
SO2 RGB images
(above) displayed signatures of two distinct eruptions of the
La Soufrière volcano on the island of Saint Vincent in the West Indies on 09 April 2021. Signatures of high ash or SO2 concentrations appear as brighter shades of pink on the RGB images. Significant ash fall on parts of the island forced evacuations of some communities. The SO2 signature for the second eruption was much more pronounced and widespread.
The corresponding GOES-16 “Clean” Infrared Window (10.35 µm) images (below) showed that coldest cloud-top infrared brightness temperatures associated with the first eruption (which began shortly before 1250 UTC) were -62ºC, while the second and more explosive eruption (which began shortly after 1900 UTC) exhibited temperatures as cold as -78ºC.
![GOES-16 "Clean" Infrared Window (10.35 µm) images [click to play animation | MP4]](https://cimss.ssec.wisc.edu/satellite-blog/images/2021/04/wi_ir-20210409_141017.png)
GOES-16 “Clean” Infrared Window (10.35 µm) images [click to play animation | MP4]
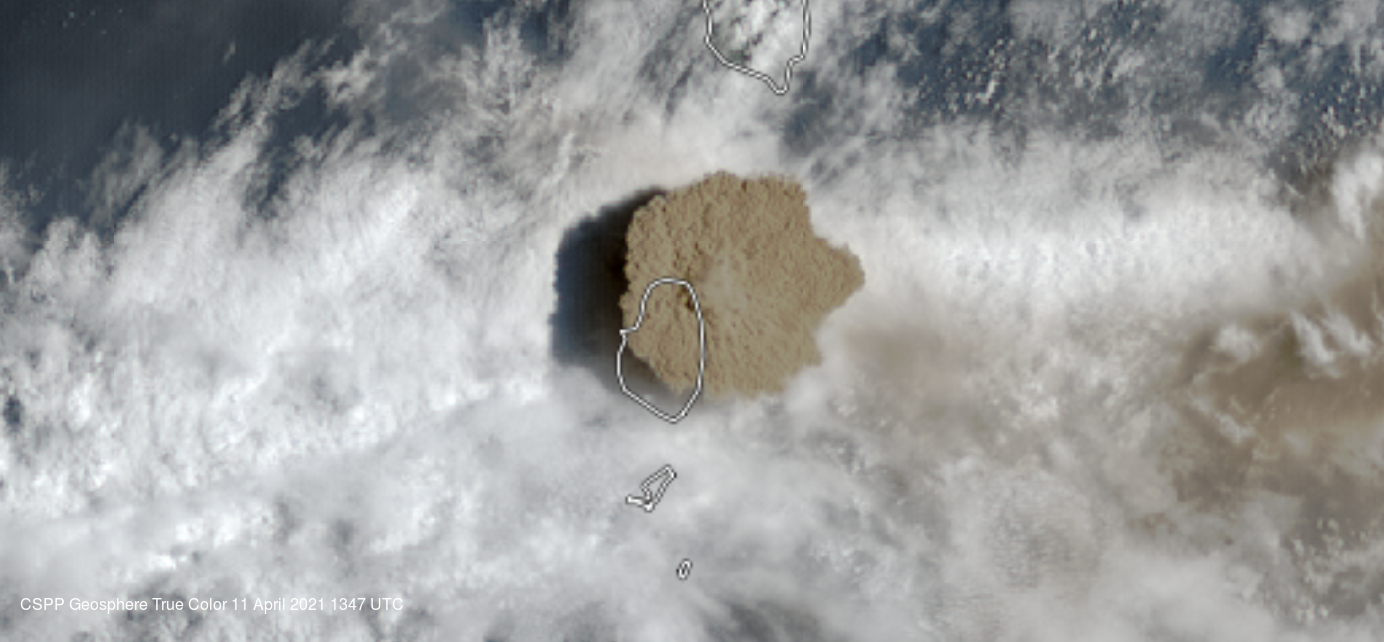
GOES-16 True Color RGB images created using
Geo2Grid (below) showed the characteristic tan-colored hues of a volcanic cloud having significant ash loading.
![GOES-16 True Color RGB images [click to play animation | MP4]](https://cimss.ssec.wisc.edu/satellite-blog/images/2021/04/210409_goes16_trueColorRGB_volcano.png)
GOES-16 True Color RGB images (credit: Tm Schmit, NOAA/NESDIS/ASPT) [click to play animation | MP4]
A number of quantitative radiometrically-retrieved products are available from the
NOAA/CIMSS Volcanic Cloud Monitoring site — some of which include Ash Height, Ash Probability, Ash Loading and Ash Effective Radius
(below).
![Ash Height product [click to play animation | MP4]](https://cimss.ssec.wisc.edu/satellite-blog/images/2021/04/210409_2000z_ash_height.png)
Ash Height product [click to play animation | MP4]
![Ash Probability product [click to play animation | MP4]](https://cimss.ssec.wisc.edu/satellite-blog/images/2021/04/210409_2000z_ash_probability.png)
Ash Probability product [click to play animation | MP4]
![Ash Loading product [click to play animation | MP4]](https://cimss.ssec.wisc.edu/satellite-blog/images/2021/04/210409_2000z_ash_loading.png)
Ash Loading product [click to play animation | MP4]
![Ash Effective Radius product [click to play animation | MP4]](https://cimss.ssec.wisc.edu/satellite-blog/images/2021/04/210409_2000z_ash_eff_radius.png)
Ash Effective Radius product [click to play animation | MP4]
===== 10 April Update =====
![GOES-16 “Clean” Infrared Window (10.35 µm) images [click to play animation | MP4]](https://cimss.ssec.wisc.edu/satellite-blog/images/2021/04/wi2_ir-20210410_105851.png)
GOES-16 “Clean” Infrared Window (10.35 µm) images [click to play animation | MP4]
1-minute
Mesoscale Domain Sector GOES-16
(GOES-East) “Clean” Infrared Window (10.35 µm) images
(above) displayed the volcanic cloud associated with numerous explosive eruptions that continued during much of the day on 10 April. The coldest cloud-top infrared brightness temperature of
-84.8ºC occurred at
1058 UTC (and would have been missed by the routine 10-minute images over that area). This cold overshooting top infrared brightness temperature roughly corresponded to an altitude of 18.2 km, or 1.8 km above the tropopause according to
12 UTC rawinsonde data from Barbados
(below).
![Plot of 12 UTC rawinsonde data from Grantley Adams, Barbados [click to enlarge]](https://cimss.ssec.wisc.edu/satellite-blog/images/2021/04/210410_12UC_TBPB_RAOB.GIF)
Plot of 12 UTC rawinsonde data from Grantley Adams, Barbados [click to enlarge]
GOES-16 True Color RGB images within +/- 30 minutes of the -84.8ºC infrared brightness temperature are shown below — an abrupt penetration of the existing volcanic cloud top was seen by the newly-developed overshooting top.
![GOES-16 True Color RGB images [click to play animation MP4]](https://cimss.ssec.wisc.edu/satellite-blog/images/2021/04/GOES-16_ABI_RadM2_true_color_2021100_105851Z.png)
GOES-16 True Color RGB images [click to play animation | MP4]
GOES-16 Ash RGB images
(below) indicated high concentrations of volcanic ash
(brighter shades of pink) spreading out slowly around the island of Saint Vincent at lower altitudes, and being transported rapidly eastward at higher altitudes. To the north, light ash fall was limiting the surface visibility to 2-3/4 miles at Saint Lucia (TLPL) — while farther to the east heavier ash fall on the island of Barbados visibility was occasionally being restricted to around 1/2 mile (1000 meters) at Grantley Adams Airport (TBPB).
![GOES-16 Ash RGB images [click to play animation | MP4]](https://cimss.ssec.wisc.edu/satellite-blog/images/2021/04/wi2_ash-20210410_105751.png)
GOES-16 Ash RGB images [click to play animation | MP4]
GOES-16 SO2 RGB images
(below) showed that high concentrations of SO2
(shades of red to orange) were also being emitted during the series of eruptions.
![GOES-16 SO2 RGB images [click to play animation | MP4]](https://cimss.ssec.wisc.edu/satellite-blog/images/2021/04/wi2_so2-20210410_105751.png)
GOES-16 SO2 RGB images [click to play animation | MP4]
GOES-17
(GOES-West) provided an oblique view of these volcanic clouds, which were very near the extreme limb of the satellite view — a comparison of GOES-17 and GOES-16 Full Disk sector “Red” Visible (
0.64 µm) images for one of the more explosive events on 10 April is shown below. The magnification factor is identical in both sets of GOES images, though they are displayed in the native projection of each satellite. A similar comparison of 10-minute Full Disk sector GOES-17 and 1-minute Mesoscale sector GOES-16 Visible images is available
here.
“Red” Visible (0.64 µm) images from GOES-17 (left) and GOES-16 (right) [click to play animation | MP4]
A toggle between True Color RGB images from GOES-16 and GOES-17 at 1930 UTC
(below) further illustrates the
parallax displacement associated with the large viewing angle from GOES-17.
![True Color RGB images from GOES-16 and GOES-17, at 1930 UTC (credit: Tim Schmit, NOAA/NESDIS/ASPB) [click to enlarge]](https://cimss.ssec.wisc.edu/satellite-blog/images/2021/04/extreme_parallax_g16_g17_2021099_1930Z.gif)
True Color RGB images from GOES-16 and GOES-17, at 1930 UTC (credit: Tim Schmit, NOAA/NESDIS/ASPB) [click to enlarge]
===== 11 April Update =====
![NOAA-20 VIIRS Day/Night Band (0.7 µm) image (credit: William Straka, CIMSS) [click to enlarge]](https://cimss.ssec.wisc.edu/satellite-blog/images/2021/04/210411_0606utc_noaa20_dayNightBand_volcanic_airglow_waves.jpeg)
NOAA-20 VIIRS Day/Night Band (0.7 µm) image (credit: William Straka, CIMSS) [click to enlarge]
A nighttime NOAA-20 VIIRS Day/Night Band (0.7 µm) image
(above) revealed mesospheric airglow waves propagating northeastward and eastward away from the volcano, which was still actively erupting every few hours.
The periodic violent eruptions continued into the daytime hours on 11 April — and GOES-16 Mid-level Water Vapor (6.9 µm) images (below) showed shock waves emanating radially outward from the initial volcanic cloud location following each eruption.
![GOES-16 Mid-level (6.9 µm) Water Vapor images [click to play animation | MP4]](https://cimss.ssec.wisc.edu/satellite-blog/images/2021/04/wi2_wv-20210411_112450.png)
GOES-16 Mid-level (6.9 µm) Water Vapor images [click to play animation | MP4]
===== 13 April Update =====
![GOES-16 "Clean" Infrared Window (10.35 µm) and Ash RGB images [click to play animation | MP4]](https://cimss.ssec.wisc.edu/satellite-blog/images/2021/04/wi2_ash-20210413_131353.png)
GOES-16 “Clean” Infrared Window (10.35 µm) and Ash RGB images [click to play animation | MP4]
Eruptions continued on the morning of 13 April, as seen in GOES-16 Infrared and Ash RGB images
(above).
A 4-day animation of GOES-16 Ash RGB images — covering the period from 1230 UTC on 09 April to 1230 UTC on 13 April — is shown below.
![GOES-16 Ash RGB images, 09-13 April [click to play MP4 animation]](https://cimss.ssec.wisc.edu/satellite-blog/images/2021/04/GOES-16_ABI_RadF_ash_2021102_100019Z.png)
GOES-16 Ash RGB images, 09-13 April (credit Tim Schmit, NOAA/NESDIS/ASPB) [click to play MP4 animation]
View only this post
Read Less


![GOES-16 Ash RGB images [click to play animation | MP4]](https://cimss.ssec.wisc.edu/satellite-blog/images/2021/04/210409_goes16_ashRGB_so2RGB_La_Soufrere_volcano_anim.gif)
![GOES-16 "Clean" Infrared Window (10.35 µm) images [click to play animation | MP4]](https://cimss.ssec.wisc.edu/satellite-blog/images/2021/04/210409_goes16_infrared_La_Soufrere_volcano_anim.gif)
![GOES-16 True Color RGB images [click to play animation | MP4]](https://cimss.ssec.wisc.edu/satellite-blog/images/2021/04/GOES-16_RadF_true_color_2021099_123000_2021099_213000.gif)
![Ash Height product [click to play animation | MP4]](https://cimss.ssec.wisc.edu/satellite-blog/images/2021/04/210409_ash_height_anim.gif)
![Ash Probability product [click to play animation | MP4]](https://cimss.ssec.wisc.edu/satellite-blog/images/2021/04/210409_ash_probability_anim.gif)
![Ash Loading product [click to play animation | MP4]](https://cimss.ssec.wisc.edu/satellite-blog/images/2021/04/210409_ash_loading_anim.gif)
![Ash Effective Radius product [click to play animation | MP4]](https://cimss.ssec.wisc.edu/satellite-blog/images/2021/04/210409_ash_effective_radius_anim.gif)
![GOES-16 “Clean” Infrared Window (10.35 µm) images [click to play animation | MP4]](https://cimss.ssec.wisc.edu/satellite-blog/images/2021/04/210410_goes16_infrared_La_Soufrere_volcano_2_anim.gif)
![GOES-16 True Color RGB images [click to play animation MP4]](https://cimss.ssec.wisc.edu/satellite-blog/images/2021/04/210410_1030utc_1130utc_goes16_trueColorRGB_La_Soufrere_volcano_anim.gif)
![GOES-16 Ash RGB images [click to play animation | MP4]](https://cimss.ssec.wisc.edu/satellite-blog/images/2021/04/210410_goes16_ashRGB_La_Soufrere_volcano_2_anim.gif)
![GOES-16 SO2 RGB images [click to play animation | MP4]](https://cimss.ssec.wisc.edu/satellite-blog/images/2021/04/210410_goes16_so2RGB_La_Soufrere_volcano_2_anim.gif)
![GOES-16 Mid-level (6.9 µm) Water Vapor images [click to play animation | MP4]](https://cimss.ssec.wisc.edu/satellite-blog/images/2021/04/210411_goes16_waterVapor_La_Soufrere_volcano_anim.gif)
![GOES-16 "Clean" Infrared Window (10.35 µm) and Ash RGB images [click to play animation | MP4]](https://cimss.ssec.wisc.edu/satellite-blog/images/2021/04/210413_goes16_infrared_ashRGB_La_Soufrere_volcano_anim.gif)

