The incipient circulation of Cyclone Seroja moved very slowly across the island of Timor in Indonesia during the 03 April – 04 April 2021 period — and the MIMIC Total Precipitable Water product (above) depicted very high values over that area (just northwest of Australia).At Kupang’s El Tari Airport, precipitation amounts included 547... Read More
![MIMIC Total Precipitable Water product [click to play animation | MP4]](https://cimss.ssec.wisc.edu/satellite-blog/images/2021/04/comp20210403.070000_tpw.png)
MIMIC Total Precipitable Water product [click to play animation | MP4]
The incipient circulation of Cyclone Seroja moved very slowly across the island of Timor in Indonesia during the 03 April – 04 April 2021 period — and the
MIMIC Total Precipitable Water product
(above) depicted very high values over that area (just northwest of Australia).
At Kupang’s El Tari Airport, precipitation amounts included 547 mm (21.5 inches) during the 48 hours ending at 00 UTC on 05 April — with the heaviest amounts of 106 mm (4.2 inches) in 6 hours and 80 mm (3.1 inches) in 3 hours occurring during the 00-06 UTC period on 04 April when the pressure was falling as Cyclone Seroja began to slowly organize and intensify (below). Flash flooding affected much of the island, with multiple deaths being reported.
![Time series plot of surface observations at El Tari Airport, Kupang [click to enlarge]](https://cimss.ssec.wisc.edu/satellite-blog/images/2021/04/210404_WATT_SFCMG.GIF)
Time series plot of surface observations at El Tari Airport, Kupang, Indonesia [click to enlarge]
2.5-minute interval rapid scan Himawari-8 “Clean” Infrared Window (10.4 µm) images
(below) revealed a few convective bursts — with cloud-top infrared brightness temperatures of -90ºC and colder
(yellow pixels embedded within darker shades of purple) — in the vicinity of Kupang (station identifier WATT) between 04 UTC on 04 April and 00 UTC on 05 April.
![JMA Himawari-8 “Clean” Infrared Window (10.4 µm) images [click to play animation | MP4]](https://cimss.ssec.wisc.edu/satellite-blog/images/2021/04/HIM08_IR_SEROJA_04APR2021_B13_2021094_070215_HIMAWARI-8_0001PANEL_FRAME0000073.GIF)
JMA Himawari-8 “Clean” Infrared Window (10.4 µm) images [click to play animation | MP4]
A NOAA-20 VIIRS Infrared Window (11.45 µm) image at 0550 UTC visualized using
RealEarth (below) showed one lone -90ºC pixel within a convective burst centered just north of Kupang.
![NOAA-20 VIIRS Infrared Window (11.45 µm) image at 0550 UTC on 04 April [click to enlarge]](https://cimss.ssec.wisc.edu/satellite-blog/images/2021/04/210404_05utc_n20_ir_zoom.png)
NOAA-20 VIIRS Infrared Window (11.45 µm) image at 0550 UTC on 04 April [click to enlarge]
CMORPH estimates of 7-day precipitation (available in RealEarth) over the region show 300-400 mm over West Timor, and values exceeding 700 mm (!!) over the adjacent ocean.
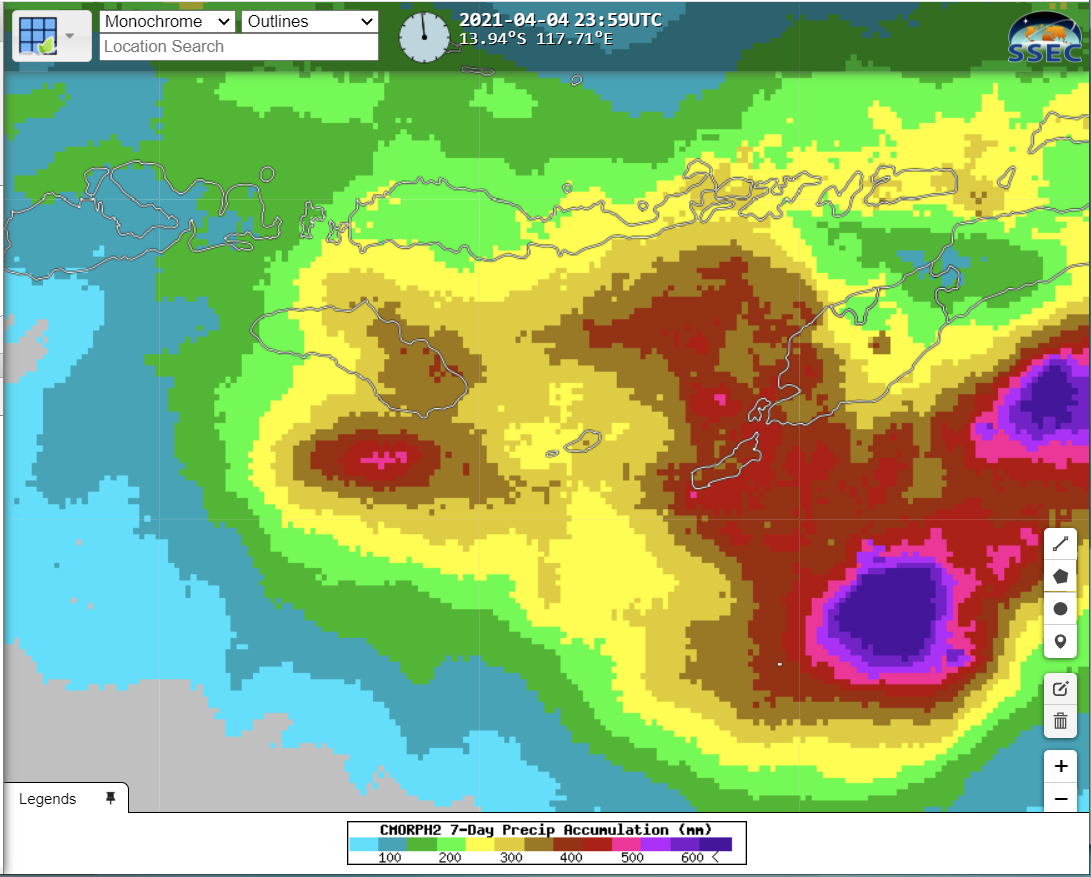
7-day CMORPH accumulation of precipitation ending 0000 UTC 5 April 2021 (Click to enlarge)
View only this post
Read Less
![MIMIC Total Precipitable Water product [click to play animation | MP4]](https://cimss.ssec.wisc.edu/satellite-blog/images/2021/04/210403_210404_mimicTPW_anim.gif)
![JMA Himawari-8 “Clean” Infrared Window (10.4 µm) images [click to play animation | MP4]](https://cimss.ssec.wisc.edu/satellite-blog/images/2021/04/210404_himawari8_infrared_TS_Seroja_anim.gif)
![GOES-16 True Color RGB images [click to play animation | MP4]](https://cimss.ssec.wisc.edu/satellite-blog/images/2021/04/210402_goes16_trueColorRGB_Central_US_smoke_plumes_anim.gif)
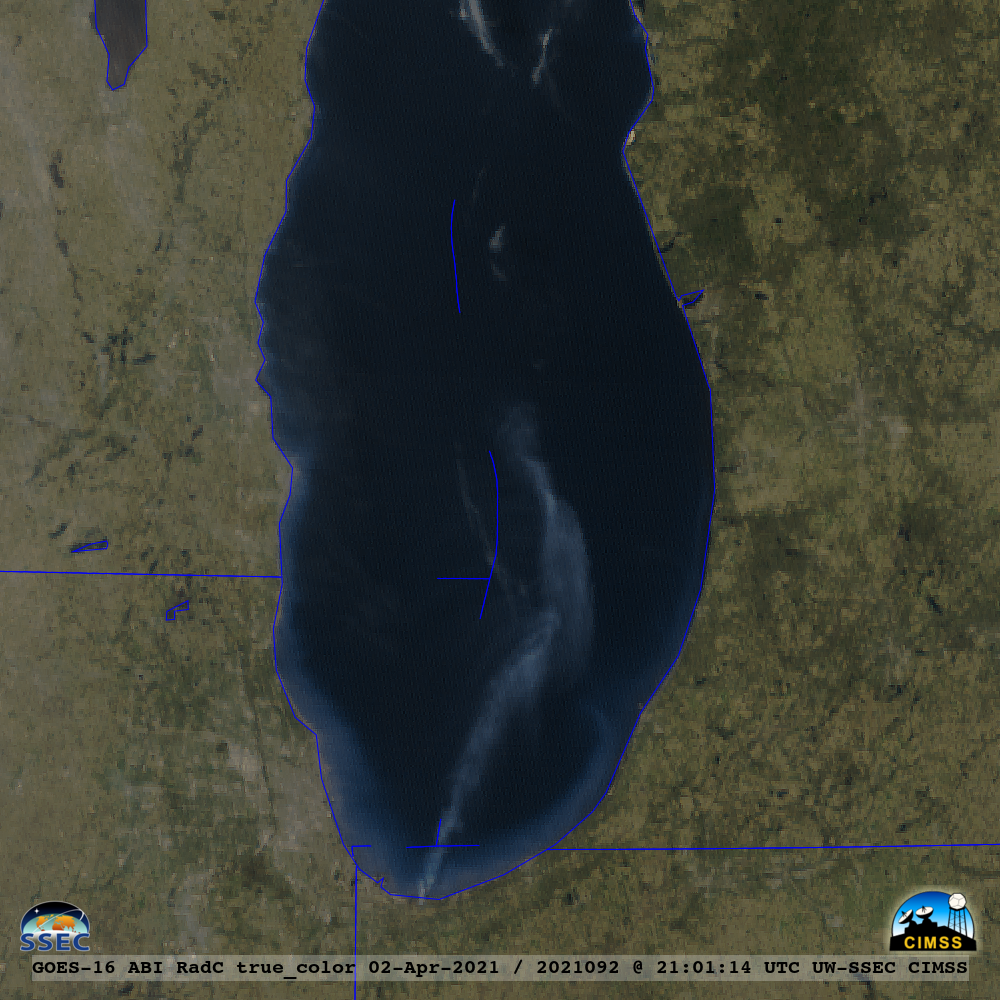
![GOES-16 True Color RGB images [click to play animation | MP4]](https://cimss.ssec.wisc.edu/satellite-blog/images/2021/04/210402_goes16_trueColorRGB_LakeMichigan_industrial_smoke_plume_anim.gif)
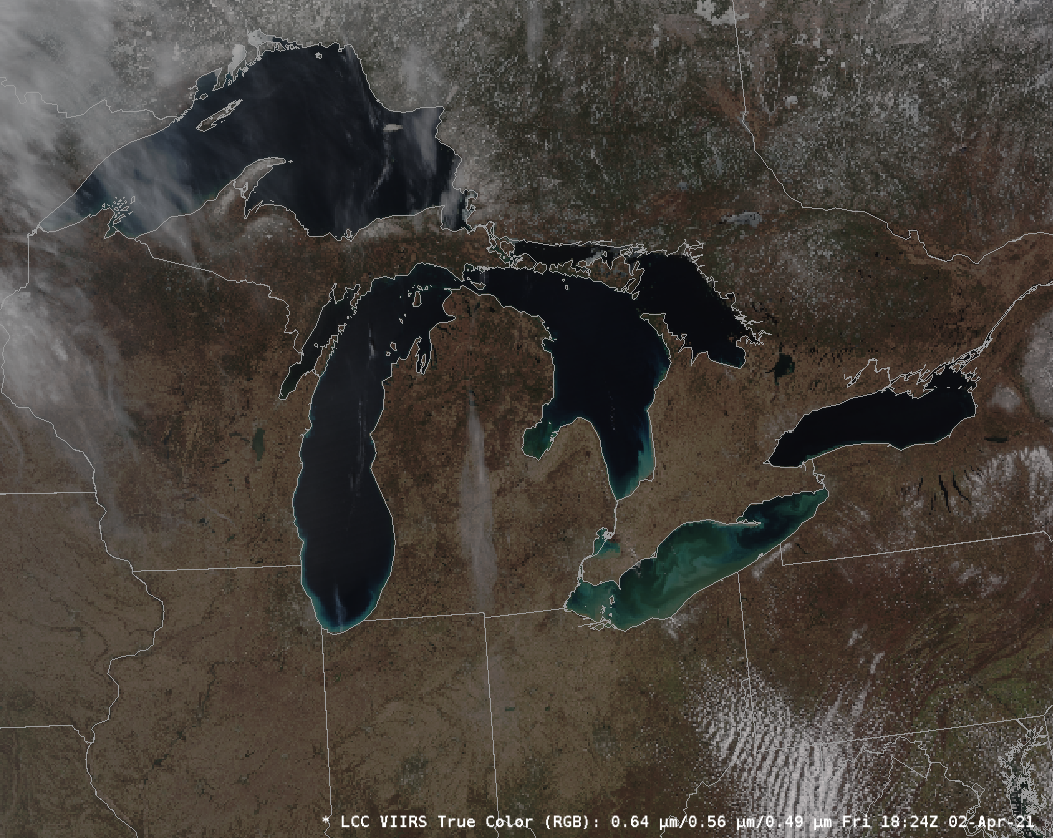
![Suomi NPP VIIRS True Color RGB and Shortwave Infrared (3.74 µm) images [click to enlarge]](https://cimss.ssec.wisc.edu/satellite-blog/images/2021/04/210402_1917utc_suomiNPP_viirs_trueColorRGB_shortwaveInfrared_Lake_Michigan_anim.gif)
![GOES-16 Fire Temperature RGB images [click to play animation | MP4]](https://cimss.ssec.wisc.edu/satellite-blog/images/2021/04/210402_goes16_fireTemperatureRGB_NE_fires_anim.gif)
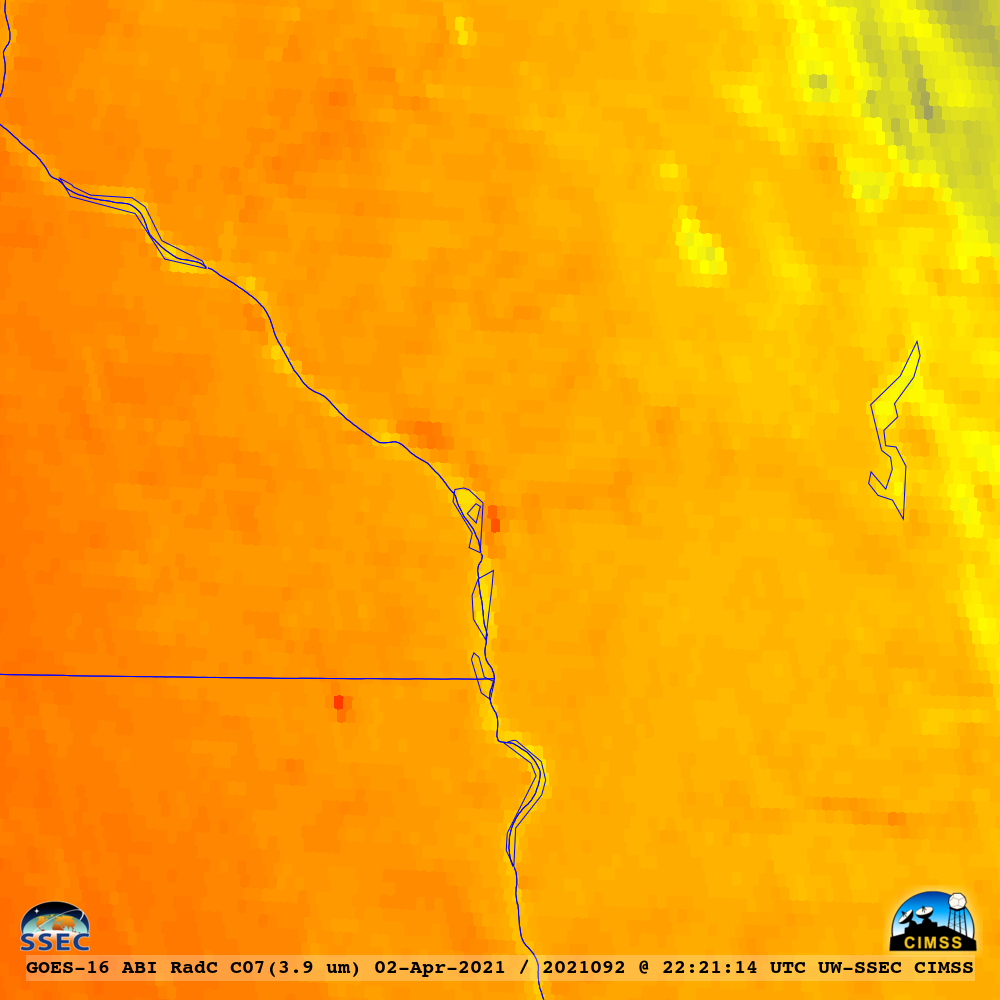
![GOES-16 Shortwave Infrared (3.9 µm) images [click to play animation | MP4]](https://cimss.ssec.wisc.edu/satellite-blog/images/2021/04/210402_goes16_shortwaveInfrared_La_Crosse_WI_auto_recycling_fire_anim.gif)
![GOES-16 True Color RGB images [click to play animation | MP4]](https://cimss.ssec.wisc.edu/satellite-blog/images/2021/04/210402_goes16_trueColorRGB_La_Crosse_WI_auto_recycling_fire_anim.gif)
![Time series plot of surface weather conditions at La Crosse Regional Airport [click to enlarge]](https://cimss.ssec.wisc.edu/satellite-blog/images/2021/04/210402_KLSE_SFCMG.GIF)
