2.5-minute interval rapid scan JMA Himawari-8 Infrared Window (10.4 µm) images (above) showed Typhoon Surigae undergoing rapid intensification (ADT | SATCON) to become a Category 4 storm as of 18 UTC on 16 April 2021.A DMSP-16 SSMIS Microwave (85 GHz) image from the CIMSS Tropical Cyclones site (below) displayed a well-defined eye, with distinct spiral... Read More
![JMA Himawari-8 Infrared Window (10.4 µm) images [click to play animation]](https://cimss.ssec.wisc.edu/satellite-blog/images/2021/04/h8_ir-20210416_180217.png)
JMA Himawari-8 Infrared Window (10.4 µm) images [click to play animation]
2.5-minute interval rapid scan
JMA Himawari-8 Infrared Window (10.4 µm) images
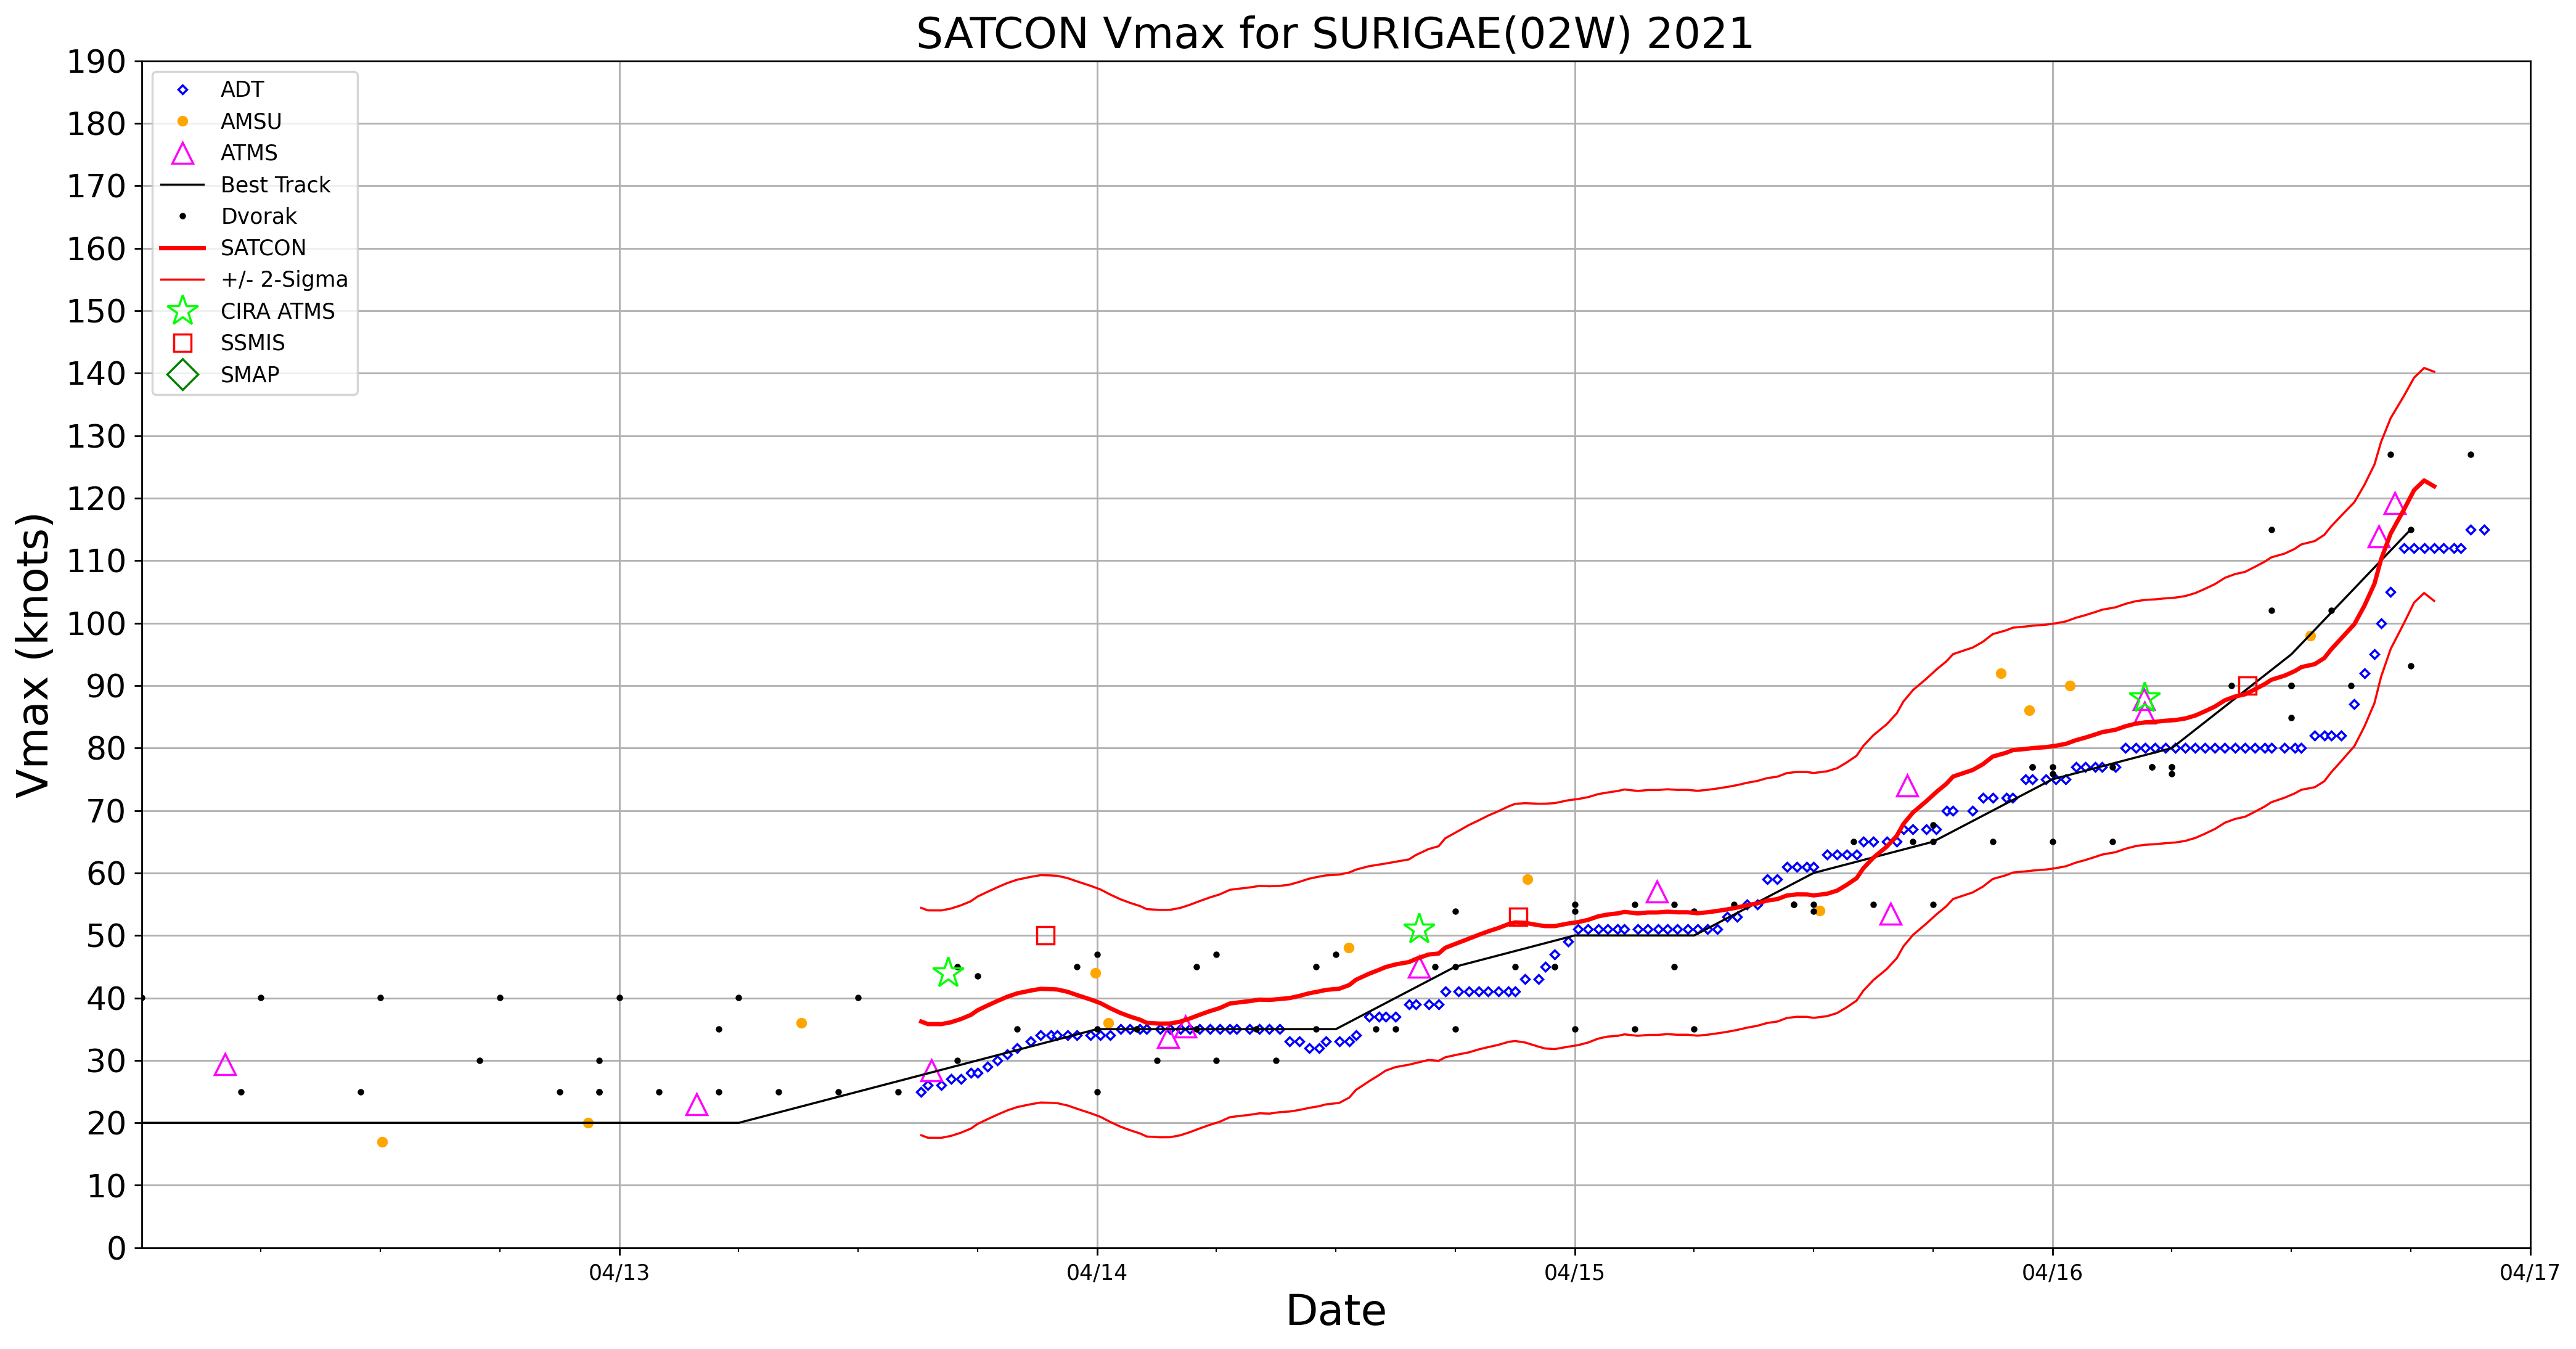
(above) showed Typhoon Surigae undergoing rapid intensification (
ADT |
SATCON) to become a Category 4 storm as of 18 UTC on 16 April 2021.
A DMSP-16 SSMIS Microwave (85 GHz) image from the CIMSS Tropical Cyclones site (below) displayed a well-defined eye, with distinct spiral bands feeding into the eyewall.
![DMSP-16 SSMIS Microwave (85 GHz) image at 1944 UTC [click to enlarge]](https://cimss.ssec.wisc.edu/satellite-blog/images/2021/04/210416_1944utc_dmsp16_ssmi_microwave_Surigae.gif)
DMSP-16 SSMIS Microwave (85 GHz) image at 1944 UTC [click to enlarge]
After sunrise, Himawari-8 “Red” Visible (0.64 µm) images
(below) showed the relatively compact eye, with hints of low-level mesovortices within the eye.
![JMA Himawari-8 "Red" Visible (0.64 µm) images [click to play animation]](https://cimss.ssec.wisc.edu/satellite-blog/images/2021/04/h8_vis-20210417_005946.png)
JMA Himawari-8 “Red” Visible (0.64 µm) images [click to play animation]
===== 17 April Update =====
![JMA Himawari-8 Infrared Window (10.4 µm) images [click to play animation | MP4]](https://cimss.ssec.wisc.edu/satellite-blog/images/2021/04/h8_ir2-20210417_120217.png)
JMA Himawari-8 Infrared Window (10.4 µm) images [click to play animation | MP4]
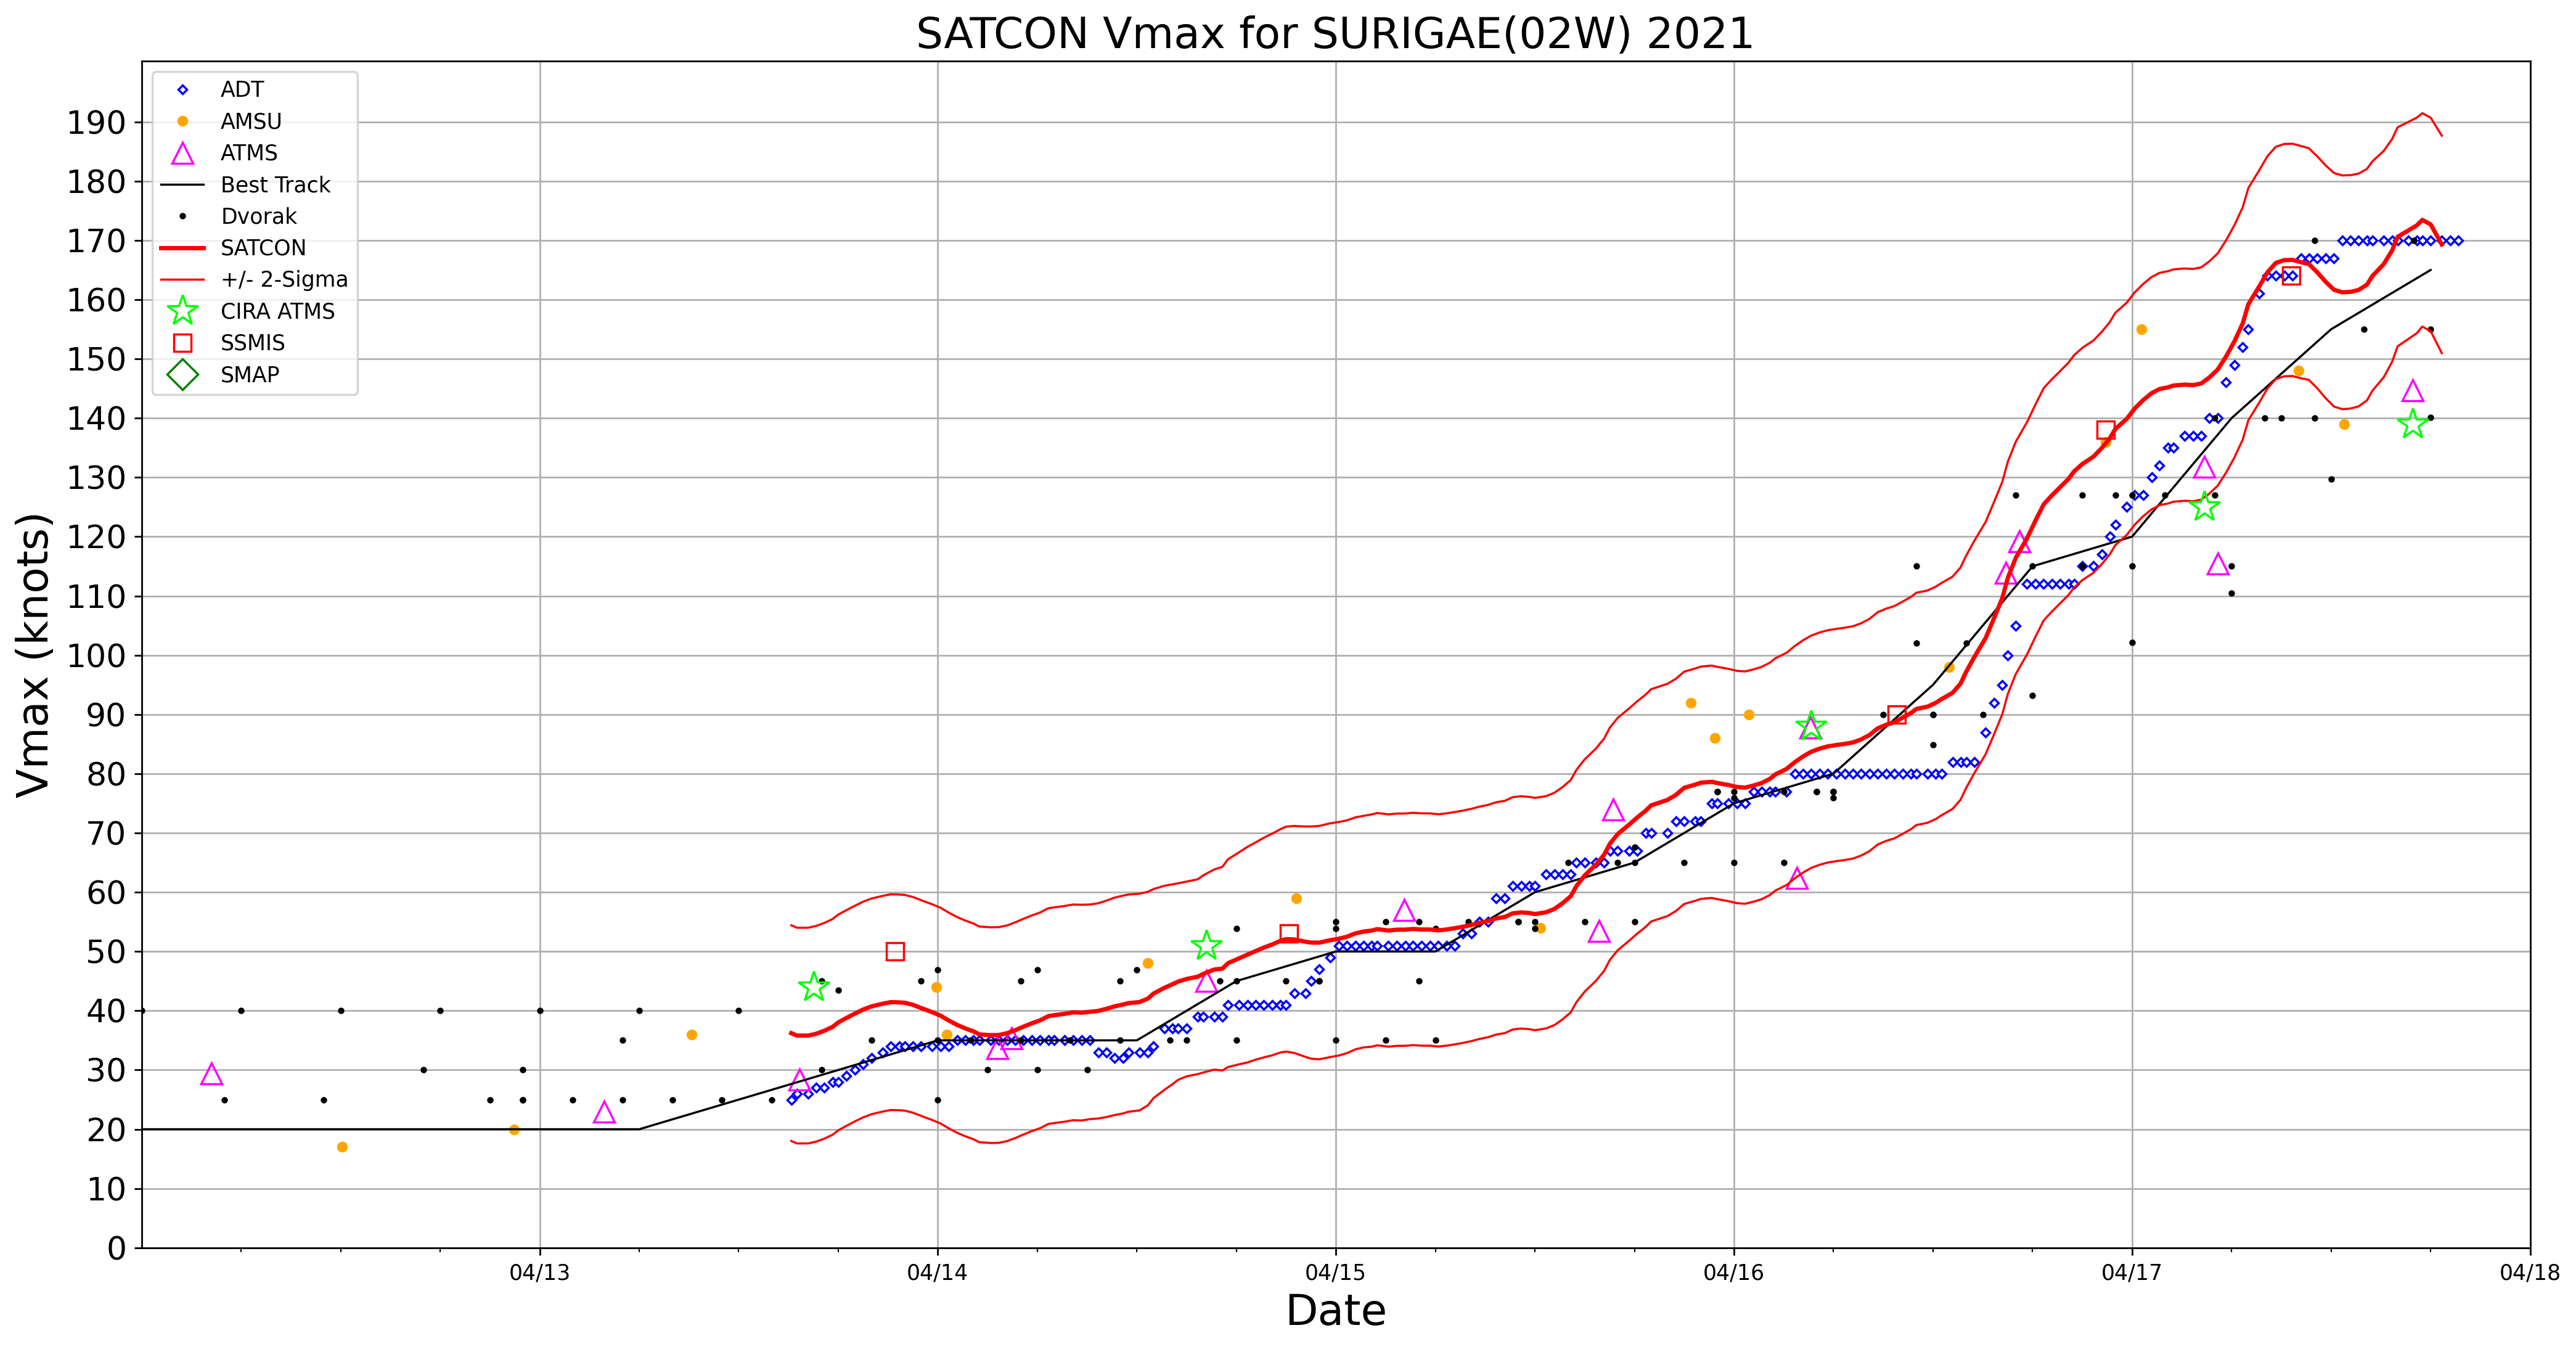
The prolonged period of rapid intensification continued overnight, and as of 12 UTC on 17 April Surigae had become a Category 5 Super Typhoon — 2.5-minute interval rapid scan Himawari-8 Infrared images
(above) showed the well-defined eye as the storm tracked northwestward across the Philippine Sea (just east of the Philippines). A faster animation (
GIF |
MP4) helped to highlight the trochoidal motion (wobble) of the eye — a behavior often seen with intense tropical cyclones. The
21 UTC advisory from
JTWC listed sustained winds of 165 knots (and objective intensity estimates from
ADT and
SATCON were around 170 knots), making Surigae the only tropical cyclone on record to reach that intensity during the month of April.
An animation of Himawari-8 Infrared images with an overlay of
deep-layer wind shear (below) indicated that Surigae was moving through a region of low to moderate wind shear; the storm was also moving across very warm water (
SST + OHC).
![Himawari-8 Infrared images, with contours of deep-layer wind shear at 18 UTC [click to enlarge]](https://cimss.ssec.wisc.edu/satellite-blog/images/2021/04/210417_himawari8_infrared_shear_Surigae_2_anim.gif)
Himawari-8 Infrared images, with contours of deep-layer wind shear at 18 UTC [click to enlarge]
Around the time that Surigae was reaching its peak intensity, a Suomi NPP VIIRS Day/Night Band (0.7 µm) image several hours before sunrise
(below) revealed concentric mesospheric airglow waves (
reference) propagating away from the energetic Category 5 tropical cyclone.
![Suomi NPP VIIRS Day/Night Band (0.7 µm) image [click to enlarge]](https://cimss.ssec.wisc.edu/satellite-blog/images/2021/04/h8_dnb_large-20210417_165946.png)
Suomi NPP VIIRS Day/Night Band (0.7 µm) image [click to enlarge]
In closer view of time-matched Himawari-8 Infrared and Suomi NPP Day/Night Band images
(below), a cluster of bright DNB pixels highlighted the presence of lightning activity along the inner edge of the northern eyewall.
![Himawari-8 Infrared Window (10.4 µm) and Suomi NPP VIIRS Day/Night Band (0.7 µm) images [click to enlarge]](https://cimss.ssec.wisc.edu/satellite-blog/images/2021/04/210417_1654utc_himawari8_infrared_suomiNPP_dayNightBand_Super_Typhoon_Surigae_anim.gif)
Himawari-8 Infrared Window (10.4 µm) and Suomi NPP VIIRS Day/Night Band (0.7 µm) images [click to enlarge]
View only this post
Read Less
![GOES-16 “Red” Visible (0.64 µm) images [click to play animation | MP4]](https://cimss.ssec.wisc.edu/satellite-blog/images/2021/04/210420_goes16_visible_STS_Potira_anim.gif)
![GOES-16 “Clean” Infrared Window (10.35 µm) images [click to play animation | MP4]](https://cimss.ssec.wisc.edu/satellite-blog/images/2021/04/210420_goes16_infrared_STS_Potira_anim.gif)
![Combined plot of all GOES-16 Atmospheric Motion Vector types (Visible, Infrared and Water Vapor) at 15-minute intervals [click to play animation | MP4]](https://cimss.ssec.wisc.edu/satellite-blog/images/2021/04/210420_STS_Potira_satellite_winds_anim.gif)
![Metop ASCAT surface scatterometer winds [click to enlarge]](https://cimss.ssec.wisc.edu/satellite-blog/images/2021/04/210420_metop_ascat_STSPotira_anim.gif)
![GOES-16 “Red” Visible (0.64 µm) images [click to play animation | MP4]](https://cimss.ssec.wisc.edu/satellite-blog/images/2021/04/210422_goes16_visible_STS_Potira_anim.gif)
![GOES-16 “Clean” Infrared Window (10.35 µm) images [click to play animation | MP4]](https://cimss.ssec.wisc.edu/satellite-blog/images/2021/04/210422_goes16_infrared_STS_Potira_anim.gif)
![JMA Himawari-8 Infrared Window (10.4 µm) images [click to play animation]](https://cimss.ssec.wisc.edu/satellite-blog/images/2021/04/210416_himawari8_infrared_Typhoon_Surigae_anim.gif)
![JMA Himawari-8 "Red" Visible (0.64 µm) images [click to play animation]](https://cimss.ssec.wisc.edu/satellite-blog/images/2021/04/210416_himawari8_visible_Typhoon_Surigae_anim.gif)
![JMA Himawari-8 Infrared Window (10.4 µm) images [click to play animation | MP4]](https://cimss.ssec.wisc.edu/satellite-blog/images/2021/04/210417_himawari8_infrared_Typhoon_Surigae_anim.gif)

![JMA Himawari-8 Infrared Window (10.4 µm) images [click to play animation | MP4]](https://cimss.ssec.wisc.edu/satellite-blog/images/2021/04/210415_himawari8_infrared_Surigae_anim.gif)
![NOAA-20 VIIRSI Infrared Window (11.45 µm) image at 1644 UTC [click to enlarge]](https://cimss.ssec.wisc.edu/satellite-blog/images/2021/04/21015_1644utc_noaa20_infrared_Tropical_Storm_Surigae_anim.gif)
![Plot of 12 UTC rawinsonde data from Yap Island [click to enlarge]](https://cimss.ssec.wisc.edu/satellite-blog/images/2021/04/210415_12UTC_PTYA_RAOB.GIF)


![Himawari-8 Visible (0.64 µm) images [click to play animation | MP4]](https://cimss.ssec.wisc.edu/satellite-blog/images/2021/04/210413_himawari8_visible_Invest94W_vortices_anim.gif)

