Monitoring dry air with NUCAPS in advance of a storm
Rapid Refresh model forecast of low-level (925-700 mb) relative humidity (0800 UTC on 15 March) and gridded NUCAPS estimates of low-level relative humidity (925-700 mb) at 0738 UTC on 15 March 2021 (click to enlarge)
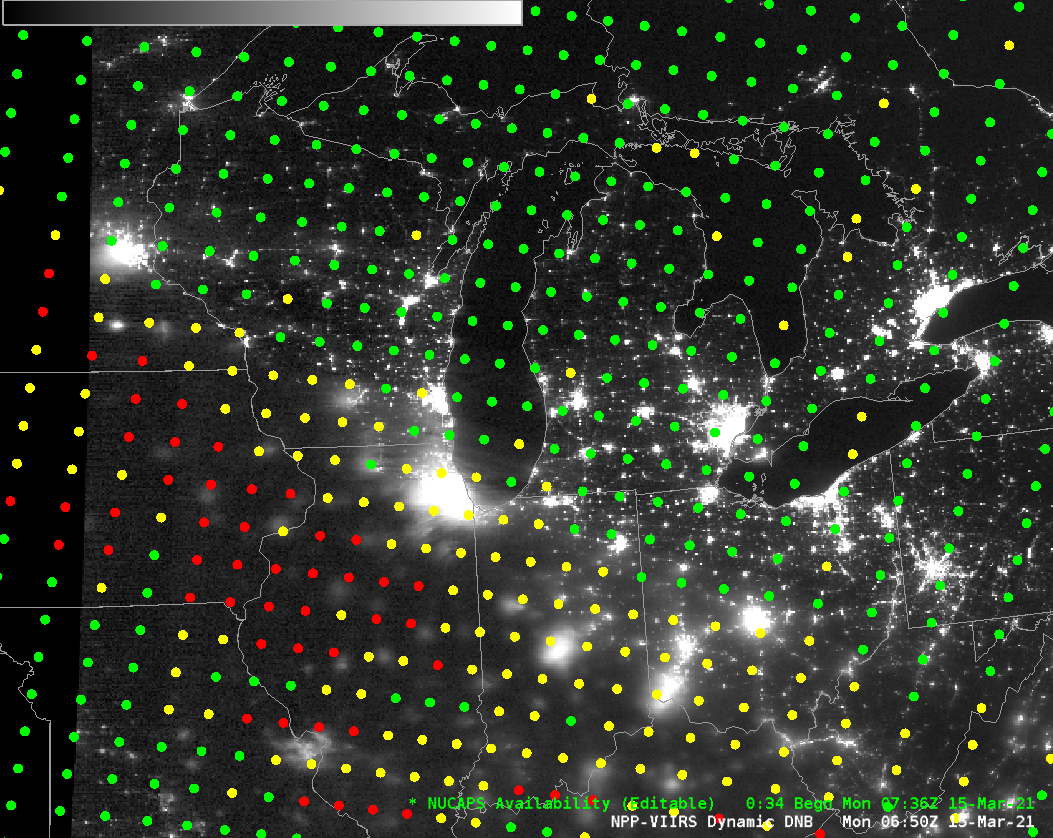
The historic storm that affected the Rockies and Plains has shifted eastward, and is forecast to affect portions of the upper Midwest (link, from here). There is abundant dry air that must be removed or eroded before the precipitation can fall around the Great Lakes. The toggle above shows Rapid Refresh model esimates of 925-700 relative humidity and gridded NUCAPS observations of the same field. (This image shows the NUCAPS sounding availability points for this pass, plotted over the Day Night Band image). Both relative humidity fields show dry air stretching northwest to southeast over the western Great Lakes.
The toggle below shows the Green Bay sounding at 0000 and 1200 UTC on 15 March (Click here to see the toggle for the Detroit sounding). Northerly winds at 0000 UTC in Green Bay (except for low-level northeasterlies) shift to east-southeasterly at low levels at 1200 UTC. Will that direction bring in moisture? East-southeasterlies with the moisture field above will not moisten the atmosphere via advection.
Upper-air Soundings at Green Bay WI (72645) at 0000 and 1200 UTC on 15 March 2021
Are there any satellite-derived winds showing southerly winds over the western Great Lakes? The animation below shows Derived Motion wind vectors, alone, at first, and then overlain on GOES-16 low-level water vapor infrared imagery (7.34 µm). Note that an obvious land-sea contrast exists in the low-level water vapor imagery over lower Michigan; this is testimony to the very dry air in place. Derived-motion wind vectors do not indicate winds moving moisture into the western Great Lakes — but this is mostly due to high clouds preventing the satellite’s view of low-level motion.
The water vapor imagery does show strong deformation: motion to the east-southeast over northeast Illinois, motion to the west-northwest over eastern Iowa and southeast Minnesota.
Derived Motion Wind vectors from GOES-16 at different levels, every 15 minutes, from 2006 UTC on 14 March 2021 through 1446 UTC on 15 March 2021. Starting at 0146 UTC, wind vectors are plotted on top of GOES-16 low-level water vapor infrared imagery (7.34 µm). (Click to enlarge)
NUCAPS soundings give the most valuable moisture information in mid-troposphere. Perhaps the 925-700 mb fields, shown above, are not the optimal level. The comparison of 850-300 mb relative humidity fields, below, shows a very similar picture to the fields at the top of this post.
Rapid Refresh model forecast of low-level (850-300 mb) relative humidity (0800 UTC on 15 March) and gridded NUCAPS estimates of low-level relative humidity (850-300 mb) at 0738 UTC on 15 March 2021 (click to enlarge)