1-minute Mesoscale Domain Sector GOES-17 (GOES-West) “Red” Visible (0.64 µm) images (above) showed the convective banding associated with Tropical Invest 90E in the East Pacific Ocean on 08 May 2021. Invest 90E was centered along a northward bulge in the ITCZ/Monsoon Trough (below).Invest 90E was located over water characterized by modest Ocean Heat Content and very... Read More
![GOES-17 “Red” Visible (0.64 µm) and "Clean" Infrared Window images [click to play animation | MP4]](https://cimss.ssec.wisc.edu/satellite-blog/images/2021/05/90e_vis-20210508_180059.png)
GOES-17 “Red” Visible (0.64 µm) and “Clean” Infrared Window (10.35 µm) images [click to play animation | MP4]
1-minute
Mesoscale Domain Sector GOES-17
(GOES-West) “Red” Visible (
0.64 µm) images
(above) showed the convective banding associated with Tropical Invest 90E in the East Pacific Ocean on 08 May 2021. Invest 90E was centered along a northward bulge in the
ITCZ/Monsoon Trough
(below).
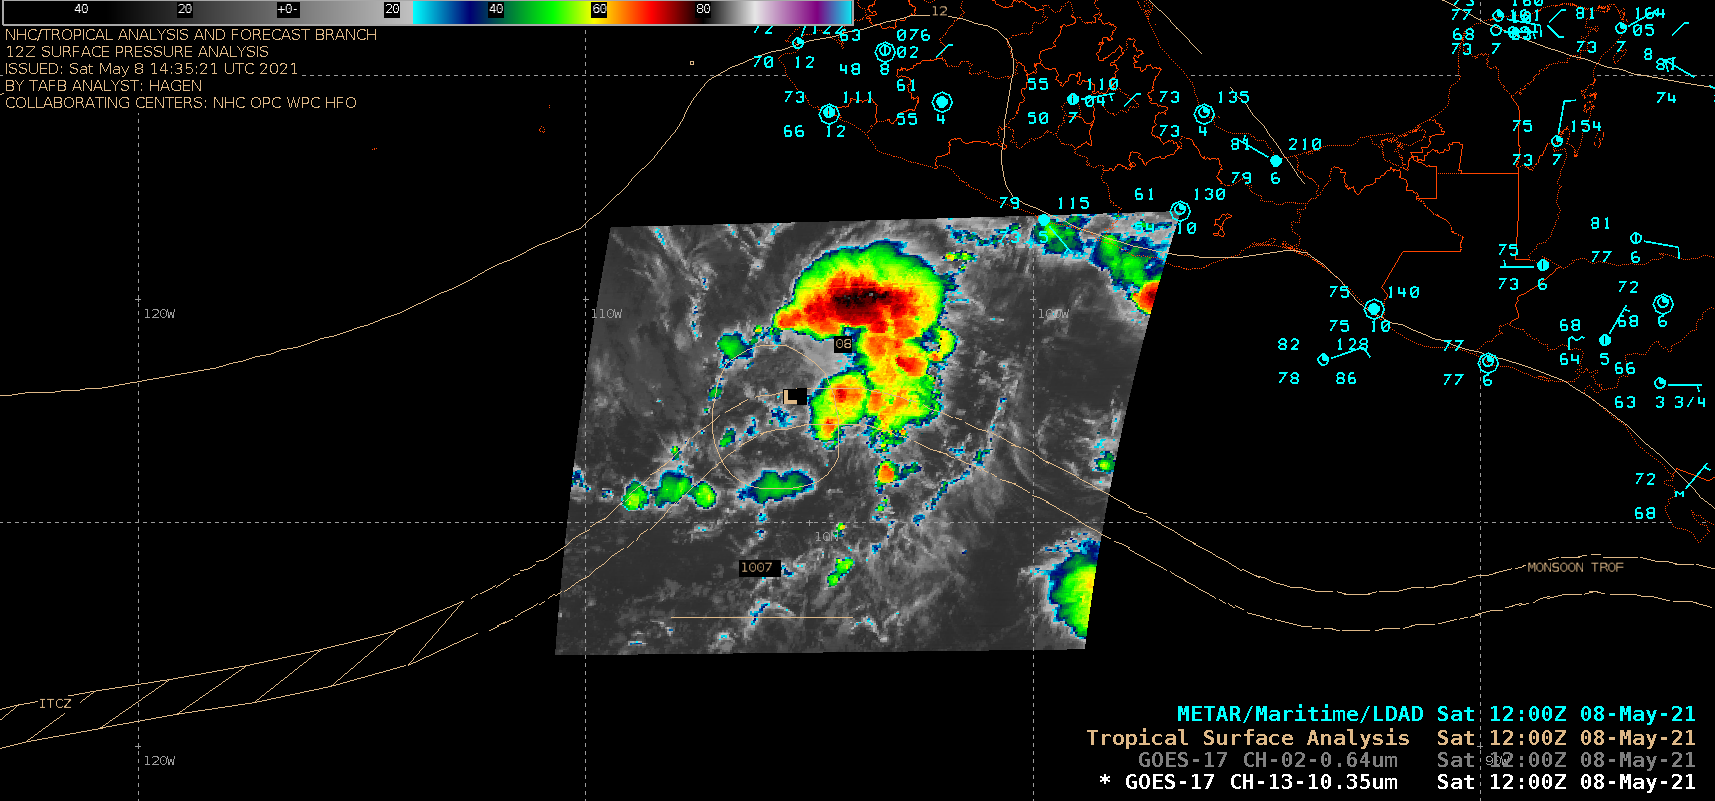
GOES-17 “Clean” Infrared Window (10.35 µm) image (Mesoscale Sector), with an overlay of the 12 UTC surface analysis [click to enlarge]
Invest 90E was located over water characterized by modest Ocean Heat Content and very warm Sea Surface Temperature values
(below), favorable factors for further intensification.
![Ocean Heat Content and Sea Surface Temperature [click to enlarge]](https://cimss.ssec.wisc.edu/satellite-blog/images/2021/05/210508_oceanHeatContent_seaSurfaceTemperature_Invest90E_anim.gif)
Ocean Heat Content and Sea Surface Temperature [click to enlarge]
===== 09 May Update =====
![GOES-17 “Red” Visible (0.64 µm) and "Clean" Infrared Window (10.35 µm) images [click to play animation | MP4]](https://cimss.ssec.wisc.edu/satellite-blog/images/2021/05/one_ir-20210509_150059.png)
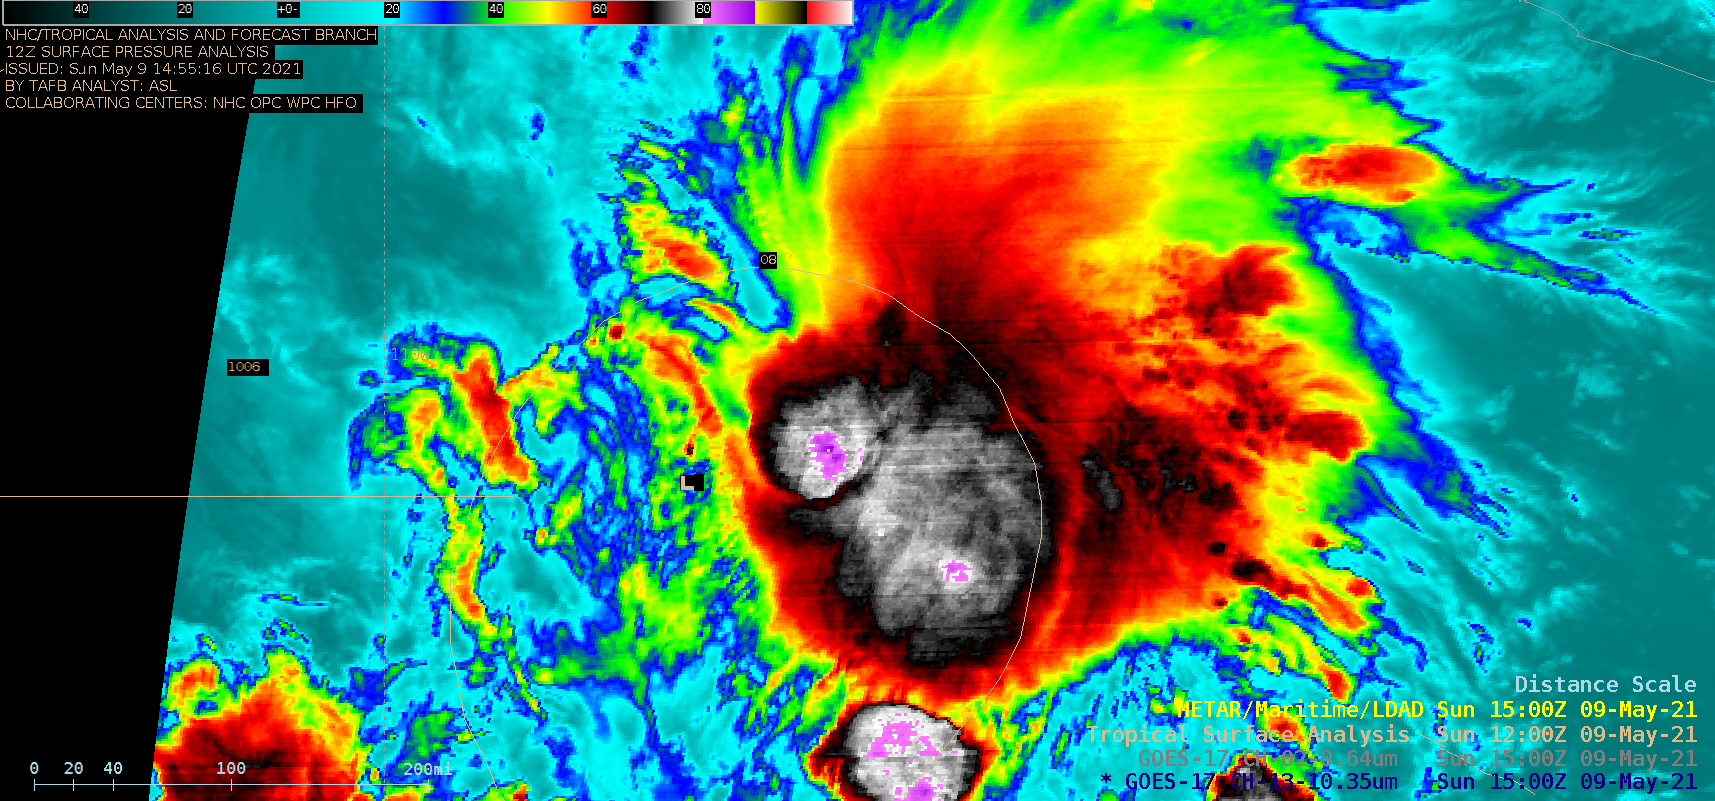
GOES-17 “Red” Visible (0.64 µm) and “Clean” Infrared Window (10.35 µm) images [click to play animation | MP4]
1-minute GOES-17 Infrared and Visible images on 09 May
(above) showed the period where Invest 90E intensified to a Tropical Depression (at 0900 UTC) and then to
Tropical Storm Andres at 1500 UTC — the earliest calendar year tropical storm on record in the East Pacific basin. The convective overshooting tops occasionally exhibited infrared brightness temperatures of -90ºC or colder
(yellow pixels embedded within dark purple regions).
A GOES-17 Infrared / Water Vapor Difference product (reference) from the CIMSS Tropical Cyclones site (below) highlighted areas of deep convection where overshooting tops were likely penetrating the tropopause (yellow to red enhancement).
![GOES-17 Infrared - Water Vapor Difference product [click to enlarge]](https://cimss.ssec.wisc.edu/satellite-blog/images/2021/05/210509_goes17_irwvdiff_TS_Andres_anim.gif)
GOES-17 Infrared – Water Vapor Difference product [click to enlarge]
GOES-17 Infrared images, with an overlay of
deep-layer wind shear (below) indicated that Andres was approaching an environment of moderate to high shear, which would limit intensification.
![GOES-17 Infrared images, with an overlay of deep-layer wind shear [click to enlarge]](https://cimss.ssec.wisc.edu/satellite-blog/images/2021/05/210509_goes17_infrared_shear_TS_Andres_anim.gif)
GOES-17 Infrared images, with an overlay of deep-layer wind shear [click to enlarge]
===== 10 May Update =====
![GOES-17 “Red” Visible (0.64 µm) and "Clean" Infrared Window (10.35 µm) images [click to play animation | MP4]](https://cimss.ssec.wisc.edu/satellite-blog/images/2021/05/ts_vis-20210510_214755.png)
GOES-17 “Red” Visible (0.64 µm) and “Clean” Infrared Window (10.35 µm) images [click to play animation | MP4]
On 10 May, 1-minute GOES-17
Infrared and Visible images (above) showed that after one final convective burst, the low-level center of Tropical Storm Andres became exposed — and the storm was then downgraded to a Tropical Depression at 2100 UTC.
View only this post
Read Less
![GOES-16 True Color RGB images [click to play animation | MP4]](https://cimss.ssec.wisc.edu/satellite-blog/images/2021/05/210518_goes16_visible_Manitoba_Ontario_wildfire_smoke_anim.gif)
![Suomi NPP VIIRS Shortwave Infrared and Day/Night Band images [click to enlarge]](https://cimss.ssec.wisc.edu/satellite-blog/images/2021/05/210519_0811utc_suomiNPP_viirs_shortwaveInfrared_dayNightBand_Manitoba_Ontario_anim.gif)
![GOES-16 Aerosol Optical Depth product [click to play animation | MP4]](https://cimss.ssec.wisc.edu/satellite-blog/images/2021/05/210519_goes16_aerosolOpticalDepth_Northeast_US_Manitoba_Ontario_wildfire_smoke_2_anim.gif)
![US Space Force EWS-G1 Infrared (10.7 µm) images [click to play animation | MP4]](https://cimss.ssec.wisc.edu/satellite-blog/images/2021/05/210516_ewsG1_infrared_Cyclone_Tauktae_anim.gif)
![DMSP-18 SSMIS Microwave (85 GHz) image at 1142 UTC [click to enlarge]](https://cimss.ssec.wisc.edu/satellite-blog/images/2021/05/210516_1142utc_dmsp18_ssmsi_microwave.gif)
![US Space Force EWS-G1 Infrared (10.7 µm) images [click to play animation | MP4]](https://cimss.ssec.wisc.edu/satellite-blog/images/2021/05/210517_ewsG1_infrared_Cyclone_Tauktae_anim.gif)
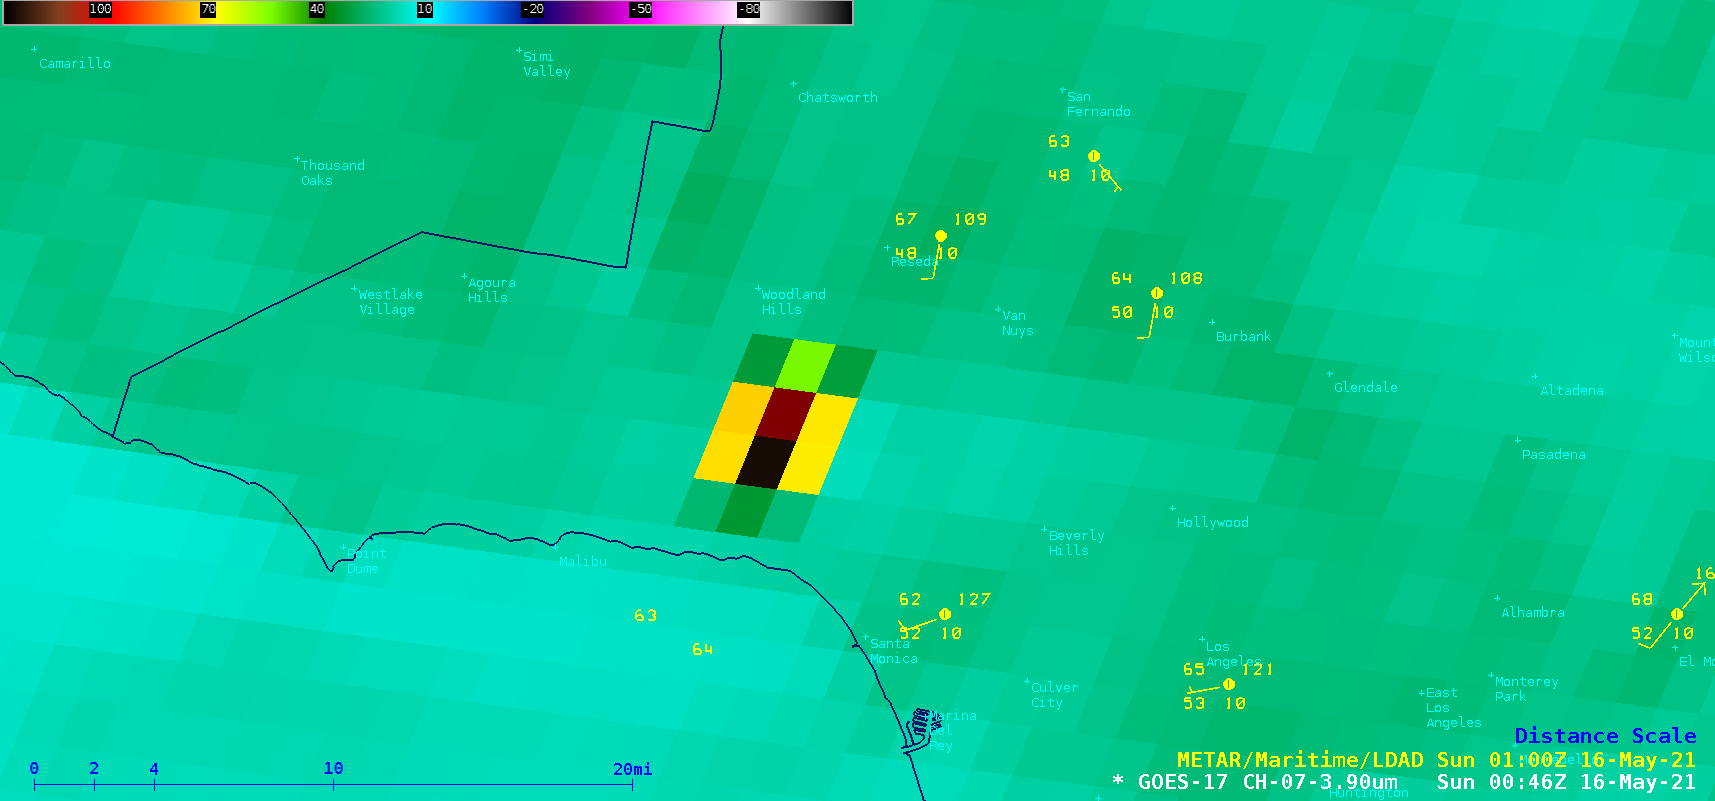
![GOES-17 Shortwave Infrared (3.9 µm) images [click to play animation | MP4]](https://cimss.ssec.wisc.edu/satellite-blog/images/2021/05/210515_goes17_shortwaveInfrared_Palisades_Fire_CA_anim.gif)
![Shortwave Infrared images from Suomi NPP VIIRS (3.74 µm) and GOES-17 ABI (3.9 µm) at 0918 UTC [click to enlarge]](https://cimss.ssec.wisc.edu/satellite-blog/images/2021/05/210516_0918utc_suomiNPP_goes17_shortwaveInfrared_Palisade_Fire_CA_anim.gif)
![GOES-17 True Color RGB images [click to play animation | MP4]](https://cimss.ssec.wisc.edu/satellite-blog/images/2021/05/210515_goes17_trueColorRGB_Palisade_Fire_CA_anim.gif)
![GOES-17 “Red” Visible (0.64 µm) and "Clean" Infrared Window images [click to play animation | MP4]](https://cimss.ssec.wisc.edu/satellite-blog/images/2021/05/210508_goes17_visible_infrared_Invest_90E_anim.gif)
![GOES-17 “Red” Visible (0.64 µm) and "Clean" Infrared Window (10.35 µm) images [click to play animation | MP4]](https://cimss.ssec.wisc.edu/satellite-blog/images/2021/05/210509_goes17_infrared_visible_Tropical_Storm_Andres_anim.gif)
![GOES-17 “Red” Visible (0.64 µm) and "Clean" Infrared Window (10.35 µm) images [click to play animation | MP4]](https://cimss.ssec.wisc.edu/satellite-blog/images/2021/05/210510_goes17_infrared_visible_Tropical_Storm_Andres_anim.gif)
